by Kirye, October 23, 2048 in NoTricksZone
Dr. Fukai also points out that global vegetation coverage increased by 11% in 29 years, from 1982 to 2010, as increasing CO2 has helped the greening of the Sahel and Sahara Desert. He contradicts the often heard media claims that drought is spreading globally, writing: “The media spread the word that desertification is progressing globally, but practically the desert is greening through CO2.” […] “Everyone should be aware that increasing CO2 concentrations in atmosphere is not in itself harmful, but it’s a good thing.”
No correlation
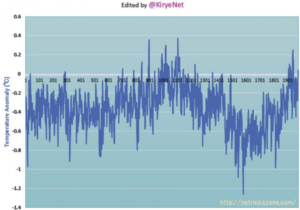
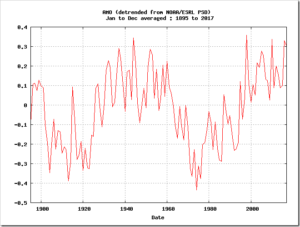
Dr. Fukai also shows that the earth’s temperature change is not simple and does not correlate at all with CO2. He shows graphs from D. M. Etheridge et al., Mauna Loa Observatory and the temperature data from Moberg et al. (2005).
Chart: ftp://ftp.ncdc.noaa.gov/pub/data/paleo/contributions_by_author/moberg2005/nhtemp-moberg2005.txt
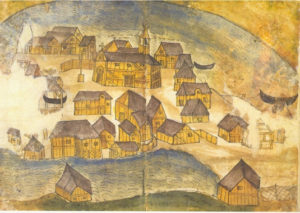
The retired Japanese professor writes that at around 1000 A.D. — the Medieval Warm Period — there were no signs showing CO2 concentration was higher. A temperature graph using data from Moberg et al. (2005) shows the Medieval Warm Period appears clearly and that CO2 was in fact around 280 ppm at that time.
…