Archives par mot-clé : Ice

Arctic Sea Ice Extent

by DMI (Danish Meterological Institute), July 2017


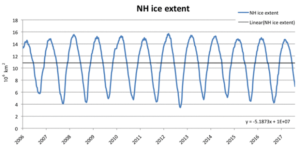
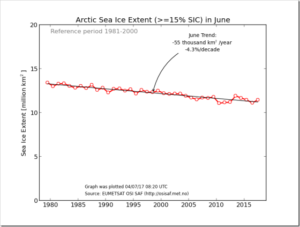
The graphic shows the mean September sea ice extent on the northern hemisphere. The plotted values correspond approximately to the sea ice area that ‘survived’ the summer melt in the respective years

The graph illustrates a decreasing trend in sea ice extent since 1978, with annual variations of occationally more than 1 million square kilometres. The 2012 sea ice minimum extented set a new minimum record.

See also here

Abrupt summer sea ice decline has not affected polar bear numbers as predicted

by  Dr. Susan J. Crockford, July 14, 2017 in ClimateChangeDispatch


Yes, Arctic sea ice has declined since satellite records began in 1979 but polar bears have adjusted well to this change, especially to the abrupt decline to low summer sea ice levels that have been the norm since 2007. Some polar bear subpopulations have indeed spent more time on land in summer than in previous decades but this had little negative impact on health or survival and while polar bear attacks on humans appear to have increased in recent years (Wilder et al. 2017), the reasons for this are not clear: reduced summer sea ice is almost certainly not the causal factor (see previous post here).

Media gets high on Antarctic Crack

by Anthony Watts, July 13, 2017 in WUWT


I thought I’d take a moment from my R&R to write about all the hullabaloo surrounding the calving of the large iceberg off the Larsen C ice shelf in Antarctica. First, a few of the headlines:

LA Times: After Antarctica sheds a trillion-ton block of ice, the world asks: Now what?

The Grauniad: Iceberg twice size of Luxembourg breaks off Antarctic ice shelf

NYT: Warnings from Antarctica

COLLAPSE OF THE EUROPEAN ICE SHEET CAUSED CHAOS

by Maja Sojtaric, June 27, 2017


The Eurasian ice sheet was an enormous conveyor of ice that covered most of northern Europe some 23,000 years ago. Its extent was such that one could have skied 4,500 km continuously across it – from the far southwestern isles in Britain to Franz Josef Land in the Siberian Arctic. Suffice to say its existence had a massive and extremely hostile impact on Europe at the time.

This ice sheet alone lowered global sea-level by over 20 meters. As it melted and collapsed, it caused severe flooding across the continent, led to dramatic sea-level rise, and diverted mega-rivers that raged on the continent. A new model, investigating the retreat of this ice sheet and its many impacts has just been published in Quaternary Science Reviews.

Lowest Solar Activity In 200 Years Accompanied By High Northern Hemispheric Snow And Ice

by P. Gosselin from F. Bosse and F. Vahrenholt, June 18, 2017


In May the sun was very quiet as sunspot number was a mere 18.8, which is only 36% of what is typical for the month this far into the cycle. Seven days saw no sunspot activity at all.

The following chart shows the current cycle, Solar Cycle 24 (red), compared to the mean of the previous cycles (blue) and the similarly behaving SC 5 (black).

It’s clear that the current cycle is significantly weaker than the mean and far weaker than the cycles we saw throughout most of the warming 20th century.

NASA Study: Mass Gains of Antarctic Ice Sheet Greater than Losses

by NASA, October 30, 2015


A new NASA study says that an increase in Antarctic snow accumulation that began 10,000 years ago is currently adding enough ice to the continent to outweigh the increased losses from its thinning glaciers.

The research challenges the conclusions of other studies, including the Intergovernmental Panel on Climate Change’s (IPCC) 2013 report, which says that Antarctica is overall losing land ice.

According to the new analysis of satellite data, the Antarctic ice sheet showed a net gain of 112 billion tons of ice a year from 1992 to 2001. That net gain slowed   to 82 billion tons of ice per year between 2003 and 2008.

They are diseases hidden in ice, and they are waking up

by Jasmin Fox-Skelly, BBC, May 4, 2017


Throughout history, humans have existed side-by-side with bacteria and viruses. From the bubonic plague to smallpox, we have evolved to resist them, and in response they have developed new ways of infecting us.

However, what would happen if we were suddenly exposed to deadly bacteria and viruses that have been absent for thousands of years, or that we have never met before?

Current Surface Mass Budget of the Greenland Ice Sheet

by DMI (Danish Meteorological Institute), May, 2017


Here you can follow the daily surface mass balance on the Greenland Ice Sheet. The snow and ice model from one of DMI’s climate models is driven every six hours with snowfall, sunlight and other parameters from a research weather model for Greenland, Hirlam-Newsnow.

See also, Study: Antarctica’s ice sheet survived warmer times, remains stable today

See also, Antarctic study shows central ice sheet is stable since milder times

Influence of high-latitude atmospheric circulation changes on summertime Arctic sea ice

by Q. Ding et al., March 13, 2017, Nature Climate Change


The Arctic has seen rapid sea-ice decline in the past three decades, whilst warming at about twice the global average rate. Yet the relationship between Arctic warming and sea-ice loss is not well understood. Here, we present evidence that trends in summertime atmospheric circulation may have contributed as much as 60% to the September sea-ice extent decline since 1979.

Egalement : Recul de la banquise arctique: 30% à 50% lié à la variabilité naturelle de l’atmosphère

Greenland was nearly ice-free for extended periods during the Pleistocene

by JM Schaefer et al., Nature, December8, 2016


Here we show that Greenland was deglaciated for extended periods during the Pleistocene epoch (from 2.6 million years ago to 11,700 years ago), based on new measurements of cosmic-ray-produced beryllium and aluminium isotopes (10Be and 26Al) in a bedrock core from beneath an ice core near the GIS summit.

Current Surface Mass Budget of the Greenland Ice Sheet

Danish Meteorological Institute (DMI), February 2017


Greenland has gained 500 Gt of ice this winter (2016-2017)

Here you can follow the daily surface mass balance on the Greenland Ice Sheet. The snow and ice model from one of DMI’s climate models is driven every six hours with snowfall, sunlight and other parameters from a research weather model for Greenland, Hirlam-Newsnow.

Cette banquise Arctique qui n’en finit pas de fondre

Prof. Dr. Istvan Marko

Depuis des années, ils guettent, telle une nuée de médecins de Molière au chevet d’un agonisant, les moindres déviations de la quantité de glace en Arctique, son épaisseur et son âge. Nombreux sont ceux qui ont prétendu qu’elle allait disparaître en 2008, 2012, 2013, 2015 et même 2016. Hélas pour eux, la glace est toujours là et bien là. Damien Ernst a parlé de “tipping point”, un point de basculement, au-delà duquel les choses se dégraderaient inéluctablement. Et d’ajouter que l’on entre dans un domaine inconnu où tout – surtout le pire, évidemment – peut arriver. Alarmisme, quand tu nous tiens !

Mais qu’en est-il vraiment du triste sort de la banquise arctique ? Fond-elle de manière anormale ? Va-t-elle disparaître dans un proche avenir ? Et qu’adviendra-t-il des ours polaires ?

Signalons d’emblée que les mesures effectuées au cours de l’année 2016 montrent effectivement que, depuis la mi-octobre, l’étendue de la banquise arctique est inférieure à celle observée les années précédentes. Il semblerait donc que la glace se reconstitue moins vite. Cependant, si l’on examine attentivement les données, on observe que le regel, lent en octobre, s’accélère et que la quantité de glace devrait revenir à la normale avant la fin de l’hiver.

nb: janvier 2017. Finalement la banquise arctique a rejoint la courbe ‘moyenne’ de surface des glaces au cours du mois de décembre 2016.

La géologie, une science plus que passionnante … et diverse