
by Bob Tisdale, December 24, 2018 in WUWT
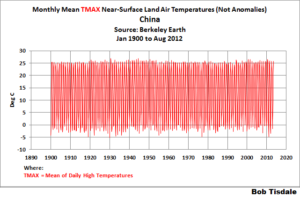
In this post, we’re going to present monthly mean TMIN and TMAX Near-Land Surface Air Temperatures (not in anomaly form) for a group of ten (10) Countries in an effort to add a little perspective to global warming. The list of countries, which follows, will, hopefully, reflect the home countries of recent visitors to WattsUpWithThat. The list is based on the number of visitors per country to my blog ClimateObservations during my peak year of 2014.
And, as always with my posts, as part of the text, there are hyperlinks to the data that were used to prepare the graphs. Just click on the links if you’re looking for the data.
This series of posts are logged under the Category of “Global Warming in Perspective” at WattsUpWithThat, with the link to that category here. The category link at my blog ClimateObservations is here.
…
