Archives par mot-clé : USA

Rising Seas? No, 3 Dozen S. Florida High-Rises Sinking From Land Subsidence

by Geology, New Science, Dec 18, 2024 in ClimatChangeDispatch


miami beach high rises

Top photo by Ryan Parker on Unsplash

Almost three dozen high-rise condos and luxury hotels along the beach in South Florida are sinking or settling in unexpected ways, in some cases because of nearby construction, according to a new study. [emphasis, links added]

The 35 buildings surveyed along an almost 12-mile (19-kilometer) stretch from Miami Beach to Sunny Isles Beach have sunk or settled by 0.8 to 3.1 inches (2 to 8 cm).

About half of the buildings are less than a decade old, according to scientists at the University of Miami Rosenstiel School of Marine, Atmospheric, and Earth Science.

The study was published on Friday.

“The discovery of the extent of subsidence hotspots along the South Florida coastline was unexpected,” Farzaneh Aziz Zanjani, the lead author, said in a statement. “The study underscores the need for ongoing monitoring and a deeper understanding of the long-term implications for these structures.”

It’s not uncommon for buildings to sink a little during and soon after construction, but the scientists called their discovery surprising because some of the changes took place several years later.

Limestone under the South Florida beach is interspersed with layers of sand, which can shift under the weight of high-rises and as a result of vibrations from foundation construction.Tidal flows also play a role.

The study used satellite images to capture the changes, with settling most noticeable in buildings in Sunny Isles Beach.

The scientists said preliminary data also suggests sinking or settling further north, along the beaches of Broward and Palm Beach counties.

The stretch of South Florida communities surveyed included Surfside, where the Champlain Towers South building collapsed in June 2021, killing 98 people.

However, that collapse is thought to have been caused by reinforced concrete that deteriorated due to poor maintenance and flawed design.

Of The Top 10 Deadliest Hurricanes in U.S. History, Most Occurred Over A Century Ago

by G. Martinez, Oct 7, 2024 in ClimateChangeDispatch


The 2024 Atlantic hurricane season is well underway, with forecasters predicting active and potentially dangerous conditions. … [emphasis, links added]

In late September, Hurricane Helene slammed into Florida’s Gulf Coast and drenched the Southeast, with devastating flooding taking a deadly toll in the mountains of North Carolina.

Here are the top 10 deadliest recorded hurricanes in U.S. history, according to the National Weather Service.

10. Last Island hurricane (1856)

The Last Island hurricane killed 400 people after slamming into the Louisiana coast in August 1856.

The highest points of the island were left under five feet of water in the wake of the storm, with the resort hotel and surrounding gambling establishments destroyed, according to NOAA.

The island itself was devastated, left void of vegetation, and split in half, NOAA said.

9. Labor Day hurricane (1935)

Florida’s Fossil Fuel Renaissance: Why the Sunshine State is Laughing Off Climate Hysteria

by C. Rotter, Aug 24, 2024 in WUWT


Maguire’s article, which is as much a lament as it is a piece of journalism, paints Florida as the villain in a story where the rest of the country is the hero, gallantly marching toward a green utopia. But here’s the kicker: Florida’s doing just fine, and the people who live there know it. Let’s break down the absurdity of the climate scolds and see why Florida’s energy strategy is not only sensible but downright smart.

Fossil Fuels: The Workhorse of Florida’s Energy Grid

According to Maguire, Florida’s reliance on fossil fuels—gasp—has actually increased in 2024, a move that he seems to think is tantamount to environmental heresy. “Florida reverses energy transition by cranking fossil fuel use,” his headline wails, as if the state had suddenly decided to reverse gravity. But let’s get real: fossil fuels, particularly natural gas, are the backbone of Florida’s energy grid for a very simple reason—they work. When the summer sun is beating down, and everyone’s cranking up the AC, no one wants to hear that their power has been cut because the wind isn’t blowing or a cloud passed over a solar farm.

Maguire points out that over 80% of Florida’s electricity has come from fossil fuels since the beginning of June, the highest share in over three years. He compares this to the national average of 62.4% and Texas’s 62%, as if this somehow proves Florida is an outlier in the worst way. But let’s be honest: these are numbers that should make Floridians proud. While the rest of the country toys with unreliable renewables, Florida is ensuring that its citizens have a reliable, affordable energy supply.

The Reality of Renewable Energy

Renewables sound great on paper, don’t they? Free energy from the sun and wind—what’s not to love? But here’s where the rubber meets the road: renewables aren’t ready for prime time, especially not in a state like Florida, where reliability isn’t just a luxury, it’s a necessity. Imagine the chaos if millions of Floridians were left in the sweltering heat because the sun decided to take a day off. Florida’s summer is no joke, and neither is the demand for electricity. The state’s grid needs to be as robust as a linebacker, not as fragile as a flower.

And it’s not like Florida has completely ignored renewable energy. Florida Power & Light (FPL), the largest utility in the state, is leading a solar charge, aiming to install 30 million solar panels by 2030. But here’s the kicker—Florida’s leaders know that solar is a supplement, not a substitute. That’s why they haven’t thrown the baby out with the bathwater and abandoned fossil fuels.

Climate Activists Are Wrong About Which Energy Source Reduces Air Pollution

by S. Graham, June 20, 2024 in WUWT


oday’s media are filled with concerns about air pollution. But few people know which energy source has produced the greatest modern reduction in air pollution. The answer isn’t wind or solar energy.

During the 1950s, my grandfather had a coal furnace in his basement, like many homes in Chicago. Five days after a winter snowfall, the snow was covered with a visible black film of dust from coal furnaces. Our younger generation does not know the original reason for “spring cleaning.” Every spring, homeowners would wash their inside walls to remove coal dust.

It was the rising use of gas fuel, primarily natural gas along with propane, that produced the greatest reduction in air pollution in the United States and across the world. Gas furnaces and stoves have replaced wood in businesses and homes in developed nations. And natural gas power plants have replaced coal-fired plants to generate electricity, with gas becoming the leading fuel for industry.

Natural gas and propane are clean-burning fuels that emit no harmful pollutants when burned. When gas heating is substituted for coal or wood heating, indoor particulate pollution is reduced by 1,000 times.

Today, 70% of US homes use natural gas or propane, a percentage that has been rising for decades. Gas fuels have also become the leading heating and cooking source in Europe, providing 83% of heat energy in the Netherlands and 78% in the United Kingdom. But there are still 70 million wood stoves in Europe.

The World Health Organization estimates that 2 billion people in developing nations still cook using open fires or inefficient stoves fueled by kerosene, biomass (wood, charcoal, animal dung, or crop waste), and coal. These fuels generate harmful indoor air pollution. Indoor air pollution is estimated to cause more than 3 million deaths annually in poor nations. Emerging nations need gas fuels to boost health and well-being.

Official Temperature Data Isn’t ‘Data’ At All

by H.S. Burnett, Apr 21, 2024 in WUWT


IN THIS ISSUE:

  • Official Temperature Data Isn’t ‘Data’ At All
  • Video of the Week: This is hilarious! Is there nothing that climate change can’t do?
  • Human Impact on the Carbon Cycle Is Minimal
  • Islands Still Growing in the Midst of Climate Change
  • Podcast of the Week: Save the Whales, Kill the Turbines – The Climate Realism Show #104
  • Climate Comedy
  • Recommended Sites

Warming Earth Has Changed U.S. Hardiness Zones

by  K. Hansen, March 4, 2024 in WUWT


Several times I have had readers at WUWT ask in comments:  “If the climate is changing, why haven’t the planting zone maps changed?”

Well, they have and they do.  The U.S. Department of Agriculture issues a new U.S.D.A. “Plant Hardiness Zone Map” periodically.  A new version of the map was just released on Nov. 15, 2023.  I became aware of it because my wife is an avid gardener and follows our local agricultural County Cooperative Extension news.

When she followed the link to the new Plant Hardiness map and checked our very local area, she was surprised to see that it had “warmed” here by 5°F.   Here is the bit of the page she was looking at:

She was a bit perplexed by this news, as we have been having not “hot” years but cooler years recently. It took me a minute to sort through it to see that the drop down was not clear on what temperature change they were talking about.  That temperature change elevated us one half a zone from zone 5b to zone 6a.


Nationwide Cold Wave Continues with Numerous Low Temperature Records Likely to Be Set…Intense Great Lakes Snow Event on The Way

by P. Dorian, Nov 16, 2022 in WUWT


Overview

Temperatures across the nation on Wednesday morning averaged out to an impressive reading of nearly 12 degrees (F) below-normal for mid-November and no state in the Lower 48 escaped the colder-than-normal chill.  The first widespread snow event of the season took place late Tuesday across the interior, higher elevation locations of the Mid-Atlantic/Northeast US with half of foot of snow recorded in many spots.  The next few days will feature a “Great Lakes snow-making machine” that will be turned on in full force and the result may be several feet of snow in some downstream locations such as Buffalo and Watertown in western New York State.  The nationwide cold wave will continue right through the upcoming weekend.

New Research: Eastern U.S. Warming Over Last 50 Years Overstated By 50%

by C. Morrison, Nov 24, 2022 in ClimateChangeDispatch


The widespread use of regularly adjusted global and local surface temperature datasets showing increasingly implausible rates of warming has been dealt a further blow with new groundbreaking research that shows 50% less warming over 50 years across the eastern United States.

The research attempts to remove distortions caused by increasing urban heat and uses human-made structure density data over 50 years supplied by the Landsat satellites. [bold, links added]

The 50% reduction in the warming trend is in comparison with the official National Oceanic and Atmospheric Administration (NOAA) homogenized surface temperature dataset.

The research was compiled by two atmospheric scientists at the University of Alabama in Huntsville, Dr. Roy Spencer and Professor John Christy.

They used a dataset of urbanization changes called ‘Built-Up’ to determine the average effect that urbanization has had on surface temperatures.

Urbanization differences were compared to temperature differences from closely spaced weather stations. The temperature plotted was in the morning during the summertime.

A full methodology of the project is shown here in a posting on Dr. Spencer’s blog.

Dr. Spencer believes that the ‘Built-Up’ dataset, which extends back to the 1970s, will be useful in ‘de-urbanizing’ land-based surface temperature measurements in the U.S. as well as other countries.

All the major global datasets use temperature measurements from the Integrated Surface Database (ISD), and all have undertaken retrospective upward adjustments in the recent past.

In the U.K., the Met Office removed a ‘pause’ in global temperatures from 1998 to around 2010 by two significant adjustments to its HadCRUT database over the last 10 years.

The adjustments added about 30% warming to the recent record. Removing the recent adjustments would bring the surface datasets more in line with the accurate measurements made by satellites and meteorological balloons.

Of course, if the objective is to promote a command-and-control Net Zero project using widespread fear of rising temperatures to mandate huge societal and economic changes, a little extra warming would appear useful.

But warming on a global scale started to run out of steam over 20 years ago, and the stunt can only be pulled for so long before the disconnect with reality becomes too obvious.

There is a danger that the integrity of the surface measurements will be put on the line. Earlier this year, two top atmospheric scientists, Emeritus Professors William Happer and Richard Lindzen told a U.S. Government inquiry that “climate science is awash with manipulated data, which provides no reliable scientific evidence.

LA Times reveals 2020 CA Wildfire CO2 Wiped Out 18 Years of the State’s Emissions Reductions

by L. Hamlin, Oct 22, 2022 in WUWT


The article notes that “researchers estimated that about 127 million metric tons of carbon dioxide equivalent were released by the fires, compared with about 65 million metric tons of reductions achieved in the previous 18 years.”

The Times article provided the usual climate alarmist hype that “climate change” is responsible for the California’s increased wildfire damage noting:

“Forests have long played a role in that system, with large trees sequestering carbon and helping to alleviate some emissions. But California’s new breed of climate-change-fueled fires are burning hotter and faster than those of the past, sometimes slowing the regrowth process and even converting some areas from coniferous trees into grasslands, shrubs and chaparral, the researchers said.”

However a 2021 prior WUWT article addressed the fact that year 2020 wildfire emissions likely wiped out the state AB 32 emissions reductions and also addressed in detail the huge state government forest management failures that have contributed to the states wildfire growth and increasing risks over the past decade with these critical failures hidden from view in the Times article.  This prior WUWT article notes:

“California’s climate alarmists claim “climate change” is responsible for this wildfire outcome but an extensive 2018 California Legislative Analyst Office (LAO) report presents clear and compelling evidence demonstrating that decades of forest mismanagement by the state have in fact created the growing wildfire crisis.

The LAO report notes that increased fire risks are present throughout California driven by forest conditions that have been allowed by the state to develop for decades.”

Provided below are some of the highlights (or lowlights) of the state governments forest management failures that have led directly to increased wildfire growth and risks that have nothing to do with “climate change” as addressed in the states LAO analysis and presented in the prior WUWT article.

50-Year U.S. Summer Temperature Trends: ALL 36 Climate Models Are Too Warm

by Dr Roy Spencer, Oct 20, 2022 in GloablWarming


I’ll get right to the results, which are pretty straightforward.

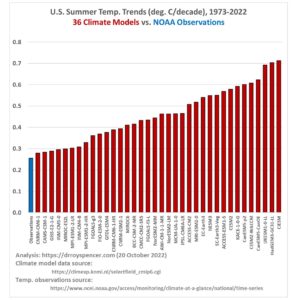
As seen in the accompanying plot, 50-year (1973-2022) summer (June/July/August) temperature trends for the contiguous 48 U.S. states from 36 CMIP-6 climate model experiments average nearly twice the warming rate as observed by the NOAA climate division dataset.


The 36 models are those catalogued at the KNMI Climate Explorer website, using Tas (surface air temperature), one member per model, for the ssp245 radiative forcing scenario. (The website says there are 40 models, but I found that four of the models have double entries). The surface temperature observations come from NOAA/NCEI.

The official NOAA observations produce a 50-year summer temperature trend of +0.26 C/decade for the U.S., while the model trends range from +0.28 to +0.71 C/decade.

As a check on the observations, I took the 18 UTC daily measurements from 497 ASOS and AWOS stations in the Global Hourly Integrated Surface Database (mostly independent from the official homogenized NOAA data) and computed similar trends for each station separately. I then took the median of all reported trends from within each of the 48 states, and did a 48-state area-weighted temperature trend from those 48 median values, after which I also got +0.26 C/decade. (Note that this could be an overestimate if increasing urban heat island effects have spuriously influenced trends over the last 50 years, and I have not made any adjustment for that).

The importance of this finding should be obvious: Given that U.S. energy policy depends upon the predictions from these models, their tendency to produce too much warming (and likely also warming-associated climate change) should be factored into energy policy planning. I doubt that it is, given the climate change exaggerations routinely promoted by environment groups, anti-oil advocates, the media, politicians, and most government agencies

The Permian Basin: The gift that keeps on giving!

by D. Middleton, Oct 4, 2022 in WUWT


SEPTEMBER 30, 2022
Advances in technology led to record new well productivity in the Permian Basin in 2021

The Permian Basin in western Texas and eastern New Mexico is one of the world’s most prolific unconventional oil- and natural gas-producing regions. The Permian Basin has become more productive because of the technological advancements in drilling and completion techniques, which allow operators to economically extract hydrocarbons from the low permeability reservoirs.

The stacked reservoirs of the Permian Basin, and the Delaware and Midland subbasins within it, vary in thickness and depth. Improved geological understanding, known as subsurface delineation, helps operators place wells to optimize well spacing in the most productive areas.

The Permian Basin has produced oil and associated natural gas from vertical wells for decades. Since 2010, advances in hydraulic fracturing and horizontal drilling led to rapid production growth. The number of new horizontal wells increased to 4,524 in 2021, compared with 350 in 2010. In June 2022, the Permian Basin accounted for about 43% of U.S. crude oil production and 17% of U.S. natural gas production (measured as gross withdrawals).

The length of a well’s horizontal section, or lateral, is a key factor in well productivity. In the Permian Basin, average well horizontal length has increased to more than 10,000 feet in the first nine months of 2022, compared with less than 4,000 feet in 2010.


See also:

Malthus, Ehrlich and now… Peak Permian

Notable US Hurricanes In History

by P. Homewood, Oct 1, 2022 in NotaLotofPeopleKnowThat


Graphs only tell part of the story when it comes to hurricanes. They give the numbers, but don’t give much idea of the devastation they bring.

The National Hurricane Center has produced a list of some of the most notable hurricanes to hit the US:

https://www.nhc.noaa.gov/outreach/history/#camille

I won’t reprint the whole  list, but it’s worth a read.

The list certainly is not all-inclusive. There are many more which could have been added, such as the 150 mph Indianola hurricane in 1886,  and Carla in 1961, the 8th and 9th most intense hurricanes on record.

But the list gives a good impression of how catastrophic US hurricanes have always been.

The timeline I have prepared below just covers the period 1900 to 1969 and summarises just how frequent these disastrous hurricanes actually are.

Good News: 2022 Hurricane Season Mild. Bad News: Pressure Pattern Threatens Europe with Hell Winter

by P. Gosselin, Sep 19, 2022 in WUWT


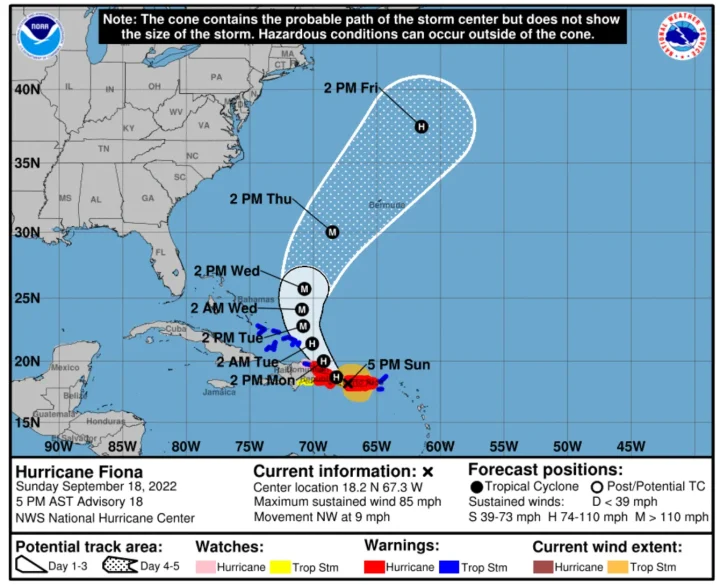
This year’s hurricane season has been unusually quiet. The USA has gotten off easy so far in terms of landfalls and damage, thus once again contradicting all the doomsday scenarios from the climate alarmists.

Mid September is usually the peak of hurricane activity. But right now it’s quiet and there are no threats to the US mainland – for the time being. Here’s the latest update from the National Hurricane Center (NHC):

Potential killer winter on top of acute energy crisis

On another subject, some forecasters have been projecting a milder than normal winter for Europe, which would be welcome with a red carpet due to the continent’s acute energy crisis.

However, Joe notes there are signs this may not be the case. That would mean the coming winter could become – in the current dire energy situation – the Mother of Nightmares: a bitter cold winter with energy outages. In the event of blackouts, which many experts warn have a high chance of occurring, Europe would then be facing a humanitarian and economic crisis on a scale not seen in a very long time.

“Look at what the surface maps are showing,” Bastardi says. “When you have high pressure over Greenland and Iceland, and low pressure over Spain like that, folks, that is an ugly looking situation for the winter. That is similar to 2010/11.”

China’s Coal-Fired Power Boom Is Soaring To New Levels

by WJS Editorial Board, Sep 13, 2022 in ClimateChangeDispatch


An unspoken truth of the climate-change crusade is this: Anything the U.S. does to reduce emissions won’t matter much to global temperatures.

U.S. cuts will be swamped by the increases in India, Africa, and especially China. Look no further than China’s boom in new coal-fired electricity.

Under the nonbinding 2015 Paris climate agreement, China can increase its emissions until 2030. And is it ever. [bold, links added]

Between 2015 and 2021, China’s emissions increased by some 11%, according to the Climate Action Tracker, which evaluates nationally determined contributions under the Paris agreement.

The U.S. has reduced its emissions by some 6% between 2015 and 2021. Beijing made minimal new commitments at last year’s Glasgow confab on climate, despite world pressure.

S&P Global Commodity Insights recently estimated that China is planning or building coal-fired power plants with a total capacity of at least 100 gigawatts. Those are merely the projects whose development status is confirmed, so the real number is almost certainly higher.

The total U.S. power capacity is some 1,147 gigawatts. One gigawatt is enough energy to power as many as 770,000 homes.

The nonprofit Global Energy Monitor tracks coal-fired power projects worldwide of 30 megawatts or more, including those planned for the long-term.

It estimates that, as of July 2022, China had some 258 coal-fired power stations—or some 515 individual units—proposed, permitted, or under construction. If completed, they would generate some 290 gigawatts, more than 60% of the world’s total coal capacity under development.

Global Energy Monitor also reports that as of July China had 174 new coal mines or coal-mine expansions proposed, permitted, or under construction that when complete would produce 596 million metric tonnes per year.

U.S. Petroleum Reserves Hit Lowest Level In Decades Ahead Of Winter Months

by B. Ziesloft, Aug 19, 2022 in DailyWire


Strategic Petroleum Reserve levels have reached their lowest levels in four decades as autumn and winter weather conditions approach, according to data from the Energy Information Administration.

President Joe Biden has responded to rising gas prices by releasing one million barrels of oil per day from the Strategic Petroleum Reserves — a stock of emergency crude oil created to “reduce the impact of disruptions in supplies of petroleum products.” Though reserves in January 2021 were as high as 638 million barrels, reserves have fallen to 461 million barrels as of August 2022 — a level not seen since March.

The national average price of gasoline was $2.38 per gallon when President Joe Biden assumed office, according to the Energy Information Administration, and increased to $3.53 per gallon by the start of the Russian invasion of Ukraine. Prices surpassed $5.00 per gallon in early June before subsiding to $3.92 per gallon as of Friday, according to AAA.

Biden nixed an expansion of the Keystone XL Pipeline upon his entrance into office. Yet the commander-in-chief has repeatedly cast the actions of Russian President Vladimir Putin as the main factor behind soaring energy costs.

“Putin’s Price Hike hit hard in May here and around the world: high gas prices at the pump, energy, and food prices accounted for around half of the monthly price increases, and gas pump prices are up by $2 a gallon in many places since Russian troops began to threaten Ukraine,” Biden said in a June statement. “Even as we continue our work to defend freedom in Ukraine, we must do more — and quickly — to get prices down here in the United States.”

 …

STUDY: 96% OF U.S. CLIMATE DATA IS CORRUPTED

by Heartland Institute, July 27, 2022


Official NOAA temperature stations produce corrupted data due to purposeful placement in man-made hot spots

Nationwide study follows up widespread corruption and heat biases found at NOAA stations in 2009, and the heat-bias distortion problem is even worse now

ARLINGTON HEIGHTS, IL (July 27, 2022) – A new study, Corrupted Climate Stations: The Official U.S. Surface Temperature Record Remains Fatally Flawed, finds approximately 96 percent of U.S. temperature stations used to measure climate change fail to meet what the National Oceanic and Atmospheric Administration (NOAA) considers to be “acceptable” and  uncorrupted placement by its own published standards.

The report, published by The Heartland Institute, was compiled via satellite and in-person survey visits to NOAA weather stations that contribute to the “official” land temperature data in the United States. The research shows that 96% of these stations are corrupted by localized effects of urbanization – producing heat-bias because of their close proximity to asphalt, machinery, and other heat-producing, heat-trapping, or heat-accentuating objects. Placing temperature stations in such locations violates NOAA’s own published standards (see section 3.1 at this link), and strongly undermines the legitimacy and the magnitude of the official consensus on long-term climate warming trends in the United States.

“With a 96 percent warm-bias in U.S. temperature measurements, it is impossible to use any statistical methods to derive an accurate climate trend for the U.S.” said Heartland Institute Senior Fellow Anthony Watts, the director of the study. “Data from the stations that have not been corrupted by faulty placement show a rate of warming in the United States reduced by almost half compared to all stations.”

NOAA’s “Requirements and Standards for [National Weather Service] Climate Observations” instructs that temperature data instruments must be “over level terrain (earth or sod) typical of the area around the station and at least 100 feet from any extensive concrete or paved surface.” And that “all attempts will be made to avoid areas where rough terrain or air drainage are proven to result in non-representative temperature data.” This new report shows that instruction is regularly violated.

READ THE REPORT (PDF).


New Study: 96% Of U.S. Climate Data Is Corrupted

by Heartland Institute, July 28, 2022  in ClimaterChangeDispatch


A new study, Corrupted Climate Stations: The Official U.S. Surface Temperature Record Remains Fatally Flawed, finds approximately 96 percent of U.S. temperature stations used to measure climate change fail to meet what the National Oceanic and Atmospheric Administration (NOAA) considers to be “acceptable” and uncorrupted placement by its own published standards. [bold, links added]

The report, published by The Heartland Institute, was compiled via satellite and in-person survey visits to NOAA weather stations that contribute to the “official” land temperature data in the United States.

The research shows that 96% of these stations are corrupted by localized effects of urbanization – producing heat bias because of their close proximity to asphalt, machinery, and other heat-producing, heat-trapping, or heat-accentuating objects.

Placing temperature stations in such locations violates NOAA’s own published standards (see section 3.1 at this link) and strongly undermines the legitimacy and the magnitude of the official consensus on long-term climate warming trends in the United States.

“With a 96 percent warm bias in U.S. temperature measurements, it is impossible to use any statistical methods to derive an accurate climate trend for the U.S.,” said Heartland Institute Senior Fellow Anthony Watts, the director of the study.

How Eco-Activists And Lawsuits Are Worsening Wildfires

by J. Wood, July 27, 2022 in Climate ChangeDispatch


With more than three million acres already burned or burning, 2022 is shaping up to be another devastating year for wildfires in the U.S.

America’s forests need to be managed more actively, a task the Biden administration took up earlier this year when it announced a 10-year strategy to reduce excess fire fuels, like downed trees and underbrush, on up to 20 million acres of national forest and 30 million acres of other lands. [bold, links added]

This plan is a step in the right direction, but it’s unlikely to come to fruition if the administration doesn’t first tackle two major obstacles to forest restoration: environmental red tape and litigation.

Projects to clear out fire fuel often face substantial delays. New research from the think tank where I work, the Property and Environment Research Center, found that it takes an average of 3.6 years for efforts to clear downed, unhealthy, and too densely grown trees to move from the required environmental review to on-the-ground work.

For prescribed burns, the delay is even longer, 4.7 years. And these are the averages. Many urgently needed projects take much longer.

While many bureaucratic, technical, and fiscal obstacles affect these delays, red tape and lawsuits are substantial contributors.

Whither US Oil Production?

by. P. Homewood, Mar 13, 2022 in NotaLotofPeopleKnowThat


This single chart from the US EIA explains just why oil prices are shooting up there:

https://www.eia.gov/petroleum/production/

The oil boom initiated by Trump saw crude oil output increase by a half between 2016 and 2019.

Output naturally collapsed in early 2020 as a result of the pandemic, which affected both supply and demand. But since then output has only slowly recovered, and is still 9% below 2019 levels.

It is worth pointing out that demand in 2021 was still not back to 2019 levels. Assuming it recovers this year, it is likely to put further upward pressure on prices, unless production increases as well.

To put the numbers into perspective, the US produces a sixth of the world’s crude oil. The increase US output between 2016 and 2019 was 205 million tonnes, and represents 5% of global output.

Small changes in supply have a disproportionate effect on international oil prices, because demand is so inelastic. An extra 5% on world production would have a significant impact on prices.


Six States Provide 55% of US Primary Energy… (And Federal Oil & Gas Leasing to Resume!)

by D. Middleton, Aug 31, 2021 in WUWT


AUGUST 31, 2021
Six U.S. states accounted for over half of the primary energy produced in 2019

In 2019, the top six primary energy-producing states—Texas, Pennsylvania, Wyoming, Oklahoma, West Virginia, and North Dakota—accounted for 55 quadrillion British thermal units (quads), or 55% of all of the primary energy produced in the United States. In 2000, these six states had accounted for 39% of the nation’s primary energy production, indicating that primary energy production has become more concentrated to the top producing states.

Primary energy production in the United States grew 40% from 2009 to 2019, driven largely by increased crude oil and natural gas production in Texas, Pennsylvania, Oklahoma, and North Dakota. During that period, advances in hydraulic fracturing and horizontal drilling made drilling for previously inaccessible crude oil and natural gas more economical in the United States. Between 2009 and 2019, production of primary energy more than doubled in Texas and Oklahoma, more than tripled in Pennsylvania, and more than quadrupled in North Dakota.

[…]

New Study Casts Doubt On Controversial Theory Linking Melting Arctic To Severe Winter Weather

by P. Voosen, May 13, 2021 in ClimagteChangeDispatch


Every time severe winter weather strikes the United States or Europe, reporters are fond of saying that global warming may be to blame.

The paradox goes like this: As Arctic sea ice melts and the polar atmosphere warms, the swirling winds that confine cold Arctic air weaken, letting it spill farther south.

But this idea, popularized a decade ago [and was the outlandish plotline in The Day After Tomorrow, pictured], has long faced skepticism from many atmospheric scientists, who found the proposed linkage unconvincing and saw little evidence of it in simulations of the climate.

Now, the most comprehensive modeling investigation into this link has delivered the heaviest blow yet: Even after the massive sea ice loss expected by midcentury, the polar jet stream will only weaken by tiny amounts—at most only 10% of its natural swings.

And in today’s world, the influence of ice loss on winter weather is negligible, says James Screen, a climate scientist at the University of Exeter and co-leader of the investigation, which presented its results last monthat the annual meeting of the European Geosciences Union.

EIA: U.S. CO2 Emissions Declined 11% in 2020 – No Change in Rising Atmospheric Carbon Dioxide

by Anthony Watts, Apr 10, 2021 in WUWT


Climate change action proponents regularly tell us we have to reduce our carbon dioxide (CO2) emissions to prevent “climate change”, even to the point of curtailing industry, travel, and food consumption. Fortunately, a real-world test of just those very things happened in 2020 due to the COVID-19 related lockdowns.

In a report released April 12th by the U.S. Energy Information Administration (EIA) the Monthly Energy Review, they report that energy-related CO2 emissions decreased by 11% in the United States in 2020 primarily because of the effects of the COVID-19 pandemic and related restrictions.

Furthermore, U.S. energy-related CO2 emissions fell in every end-use (consumer) sector for the first time since 2012. The EIA notes:

“CO2 emissions associated with energy use fell by 12% in the commercial sector in 2020. Part of this drop in emissions was due to pandemic restrictions. Because electricity is a large source of energy for the commercial sector, the declining carbon intensity of electric power also contributed to declining CO2emissions from commercial activity. Emissions from commercial electricity use fell by 13%. Commercial petroleum and natural gas emissions fell by 13% and 11%, respectively.”

“Within the U.S. power sector, emissions from coal declined the most, by almost a fifth, at 19%. Natural gas-related CO2 emissions rose by 3%. Also of note in 2020; fossil fuel generation declined, while power generation from renewables from wind and solar continued to grow.”


As seen in the graph above, CO2 in the atmosphere increased during 2020 during the economy crippling lockdowns at the same rate it has been for decades. There isn’t even a blip.

This lack of any reduction in atmospheric CO2 concentration clearly demonstrates that no matter how much the U.S. reduces CO2 emissions, no one living today will, at any point in life, see a measurable change in climate attributable to the reduction. This is especially true since other countries, such as China, who only give lip-service to the COemissions reduction demanded by the 2015 Paris Climate Accord.

Sea Level and the Jersey Shore

by Kip  Hansen, March 22, 2021 in WUWT


Dr. Judith Curry has been writing about Sea Levels and New Jersey [and here], spurred on by a request for an evaluation of the topic from the New Jersey Business & Industry Association(NJBIA).  The NJBIA is concerned because a study by a team of sea level researchers at Rutgers University has called for “draconian policies unsupported by science” that would “harm our economy today” by overreacting to “legitimate concerns about climate change, sea level rise, and flooding”.   Dr. Curry’s full report is titled: “Assessment of projected sea level rise scenarios for the New Jersey Coast”.

Dr. Curry’s CFAN report contains this summary:

The summary conclusions of the CFAN Review are:

—  The sea level projections provided by the Rutgers Report are substantially higher than those provided by the IPCC, which is generally regarded as the authoritative source for policy making. The sea level rise projections provided in the Rutgers Report, if taken at face value, could lead to premature decisions related to coastal adaptation that are unnecessarily expensive and disruptive.

—  Scenarios out to 2050 for sea level rise and hurricane activity should account for scenarios of variability in multi-decadal ocean circulation patterns.

—  Best practices in adapting to sea level rise use a framework suitable for decision making under deep uncertainty. The general approach of Dynamic Adaptive Policy Pathways is recommended for sea level rise adaptation on the New Jersey coast.

I wrote a piece here at WUWT a year ago, titled “Atlantic City:   I’ll meet you tonite…..”, prompted by the Governor of New Jersey’s executive order stating that  “New Jersey has set a goal of producing 100 percent clean energy by 2050.” and  “New Jersey will become the first state to require that builders take into account the impact of climate change, including rising sea levels, in order to win government approval for projects.”  The sea level rise part of this executive order was based on an earlier draft of  the same  study by researchers at Rutgers University.

California’s Energy Scorecard Fails On The World Stage – OpEd

by R. Stein, Sept 21, 2021 in EurasiaReview


California, with 0.5 percent of the world’s population (40 million vs 8 billion) professes to be the leader of everything and through its dysfunctional energy policies imports more electricity than any other state – currently at 32 percent from the Northwest and Southwest – and has forced California to be the only state in contiguous America thatimports most of its crude oil energy demands from foreign country suppliers to meet the energy demands of the state.

State energy policies have made California electricity and fuel prices among the highest in the nation which have been contributory to the rapid growth of “energy poverty” for the 18 million (45 percent of the 40 million Californians) that represent the Hispanic and African American populations of the state.

Access to electricity is now an afterthought in most parts of the world, so it may come as a surprise to learn that 16 percent of the world’s population — an estimated 1.2 billion people — are still living without this basic necessity. Lack of access to electricity, or “energy poverty”, is the ultimate economic hindrance as it prevents people from participating in the modern economy.

Almost half the world — over three billion people — live on less than $2.50 a day. At least 80 percent of humanity, or almost 6 billion, lives on less than $10 a day. Other nations and continents living in abject poverty without electricity realize California, and large parts of the U.S. buying into green new deals, renewable futures, and zero-carbon societies are left with the dystopic reality of mass homelessness, filth and rampant inequality that increasingly characterize the GND core values.