New Study Reveals True Cause Of Coral Bleaching (And It’s Not Global Warming)

by Brook Hays, July 16, 2019 in ClimateChangeDispatch


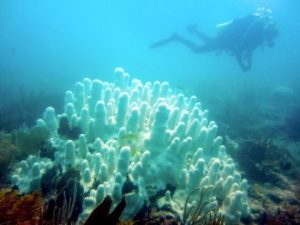
Corals are disappearing across the world’s oceans, and most scientists have pointed to warming water temperatures — the result of climate change — as the primary driver.

But new research suggests nitrogen pollution is the main cause of coral bleaching in Florida.

The study, published this week in the journal Marine Biology, was compiled using the three-decades worth of observational data collected at the Looe Key Reef in the lower Florida Keys.

“Our results provide compelling evidence that nitrogen loading from the Florida Keys and greater Everglades ecosystem caused by humans, rather than warming temperatures, is the primary driver of coral reef degradation at Looe Key Sanctuary Preservation Area,” lead study author Brian Lapointe, research professor at Florida Atlantic University’s Harbor Branch Oceanographic Institute, said in a news release.

Data collected at the test site showed nutrient runoff has boosted the nitrogen-phosphorus ratio in reef algae.

As more and more treated sewage and fertilizers from commercial farms rinse into local waterways and flood the oceans with nutrients, including reactive nitrogen, corals are unable to absorb sufficient levels of phosphorous.

“Our results provide compelling evidence that nitrogen loading from the Florida Keys and greater Everglades ecosystem caused by humans, rather than warming temperatures, is the primary driver of coral reef degradation at Looe Key Sanctuary Preservation Area,” lead study author Brian Lapointe, research professor at Florida Atlantic University’s Harbor Branch Oceanographic Institute, said in a news release.

10 fallacies about Arctic sea ice & polar bear survival: teachers & parents take note

by S. Crockford, July 15, 2019, in WUWT/PolarBearScience


Summer sea ice loss is finally ramping up: first year is disappearing, as it has done every year since ice came to the Arctic millions of years ago. But critical misconceptions, fallacies, and disinformation abound regarding Arctic sea ice and polar bear survival. Ahead of Arctic Sea Ice Day (15 July), here are 10 fallacies that teachers and parents especially need to know about.

As always, please contact me if you would like to examine any of the references included in this post. These references are what make my efforts different from the activist organization Polar Bears International. PBI virtually never provide references within the content it provides, including material it presents as ‘educational’. Links to previous posts of mine that provide expanded explanations, images, and additional references are provided.

The cartoon above was done by Josh: you can drop off the price of a beer (or more) for his efforts here.


NO EXPERIMENTAL EVIDENCE FOR THE SIGNIFICANT ANTHROPOGENIC CLIMATE CHANGE

by J. Kauppinen and P. Malmi, July 13, 2019 in Physics.gen-ph


Abstract. In this paper we wil lprove that GCM-models used inI IPCC report AR5 fail to calculate the influences of the low cloud cover changes on the global temperature. That is why those models give a very small natural temperature change leaving a very large change for the contribution of the green house gases in the observed temperature. This is the reason why IPCC has to use a very large sensitivity to compensate a too small natural component. Further they have to leave out the strong negative feedback due to the clouds in order to magnify the sensitivity. In addition, this paper proves that the changes in the low cloud cover fraction practically control the global temperature.

1. Introduction

The climate sensitivity has an extremely large uncertainty in the scientific lit- erature. The smallest values estimated are very close to zero while the highest ones are even 9 degrees Celsius for a doubling of CO2. The majority of the papers are using theoretical general circulation models (GCM) for the estimation. These models give very big sensitivities with a very large uncertainty range. Typically sensitivity values are between 2–5 degrees. IPCC uses these papers to estimate the global temperature anomalies and the climate sensitivity. However, there are a lot of papers, where sensitivities lower than one degree are estimated without using GCM. The basic problem is still a missing experimental evidence of the cli- mate sensitivity. One of the authors (JK) worked as an expert reviewer of IPCC AR5 report. One of his comments concerned the missing experimental evidence for the very large sensitivity presented in the report [1]. As a response to the com- ment IPCC claims that an observational evidence exists for example in Technical Summary of the report. In this paper we will study the case carefully.

2. Low cloud cover controls practically the global temperature

Antarctica was warmer one thousand years ago — and life was OK

JoNova, July 11, 2019


Remember when polar amplification was the rage? So much for that theory

Antarctica is twice the size of the US or Australia. Buried 2 km deep under domes of snow, it holds 58 meters of global sea level to ransom. The IPCC have been predicting its demise-by-climate-change for a decade or two.

A new paper looks at 60 sites across Antarctica, considering everything from ice, lake and marine cores to peat and seal skins. They were particularly interested in the Medieval Warm Period, and researched back to 600AD.  During medieval times (1000-1200 AD) they estimate Antarctica as a whole was hotter than it is today.  Antarctica was even warmer still  — during the dark ages circa 700AD.

Credit to the paper authors: Sebastian Lüning, Mariusz Gałka, and Fritz Vahrenholt

Feast your eyes on the decidedly not unprecedented modern tiny spike:

The little jaggy down after 2000 AD is real. While there was rapid warming across Antarctica from 1950-2000, in the last twenty years, that warming has stalled. Just another 14 million square kilometers that the models didn’t predict.

We already knew the Medieval Warm Period was a global phenomenon, thanks to hundreds of proxies, and 6,000 boreholes. But this new paper is a great addition.

With an awesome dedication to detail, the team put all the big oceanic and other factors into one big graph. It is nice to see them side by side so we can see the connections between them.

Energy Dominance: US Crude Oil Production Tops 12 Million Barrels per Day in April!

by David Middleton, July 15, 2019 in WUWT


JULY 8, 2019
U.S. crude oil production surpassed 12 million barrels per day in April

U.S. crude oil production and lease condensate reached another milestone in April 2019, totaling 12.2 million barrels per day (b/d), according to EIA’s latest Petroleum Supply Monthly. April 2019 marks the first time that monthly U.S. crude oil production levels surpassed 12 million b/d, and this milestone comes less than a year after U.S. crude oil production surpassed 11 million b/d in August 2018.

Texas and the Federal Offshore Gulf of Mexico (GOM), the two largest crude oil production areas in the United States, both reached record levels of production in April at 4.97 million b/d and 1.98 million b/d, respectively. Oklahoma also reached a record production level of 617,000 b/d.

The U.S. onshore crude oil production increase is driven mainly by developing low permeability (tight) formations using horizontal drilling and hydraulic fracturing. EIA estimates that crude oil production from tight formations in April 2019 reached 7.4 million b/d, or 61% of the U.S. total.

Study: Clouds, Solar Cycles Play Major Role In Climate Change

by  G. Lloyd, July 15, 2010 in ClimateChangeDispatch


Sand deposits near the Gobi Desert in China may seem a strange place to look for evidence that cosmic rays can control how clouds are formed and the impact they have on Earth’s climate.

But Japanese scientists have measured the size of sand grains and the distance they traveled 780,000 years ago to add a new level of understanding to one of the questions that continue to baffle climate science: clouds.

The findings, published in Nature, point to big trends in natural variation of past and future climate that operate apart from greenhouse gas levels.

The study adds weight to a contentious theory by Danish researcher Henrik Svensmark, of the Danish National Space Institute in Copenhagen, which uses cosmic rays and clouds to question the sensitivity of climate to carbon dioxide in the atmosphere.

Red Sea Temperature Record Shows It Follows The AMO, Not CO2 … “Natural Climate Oscillations”

by P. Gosselin, July 7, 2019 in NoTricksZone


AMO cycle on the downward side: Red Sea to cool in the coming decades

By Die kalte Sonne
(German text translated by P Gosselin)

Seven years ago, in our book “The Forgotten Sun”, we proposed using ocean cycles for medium-term forecasts. At the time, the climate establishment was strictly opposed to this. Today fortunately times have changed.

On March 15, 2019, a team led by George Krokos analyzed the temperature development of the Red Sea in Geophysical Research Letters, which has become noticeably warmer in recent decades. The researchers put this into a long-term context and found a strong correlation with the 70-year ocean cycle of the AMO (Atlantic Multidecade Oscillation).

Now that AMO has reached its peak, Krokos and colleagues expect the Red Sea to cool in the next three decades.

Abstract:

Natural Climate Oscillations may Counteract Red Sea Warming Over the Coming Decades
Recent reports of warming trends in the Red Sea raise concerns about the response of the basin’s fragile ecosystem under an increasingly warming climate. Using a variety of available Sea Surface Temperature (SST) data sets, we investigate the evolution of Red Sea SST in relation to natural climate variability. Analysis of long‐term SST data sets reveals a sequence of alternating positive and negative trends, with similar amplitudes and a periodicity of nearly 70 years associated with the Atlantic Multidecadal Oscillation. High warming rates reported recently appear to be a combined effect of global warming and a positive phase of natural SST oscillations. Over the next decades, the SST trend in the Red Sea purely related to global warming is expected to be counteracted by the cooling Atlantic Multidecadal Oscillation phase. Regardless of the current positive trends, projections incorporating long‐term natural oscillations suggest a possible decreasing effect on SST in the near future.

My new video – Climate Change Reconsidered II: Fossil Fuels

by Anthony Watts, July 14,2019 in WUWT


In the first part of a new video series, I give an outline of Chapter One of Climate Change Reconsidered II: Fossil Fuels, which covers environmental economics. I explain the role of economics in protecting the environment. In a nutshell, it’s this: economic prosperity gives humans the time to care about the environment. Otherwise it’s just a day-to-day battle for survival.

Climate Change Reconsidered II: Fossil Fuels assesses the costs and benefits of the use of fossil fuels (principally coal, oil, and natural gas) by reviewing scientific and economic literature on organic chemistry, climate science, public health, economic history, human security, and theoretical studies based on integrated assessment models (IAMs). It is the fifth volume in the Climate Change Reconsidered series and, like the preceding volumes, it focuses on research overlooked or ignored by the United Nations’ Intergovernmental Panel on Climate Change (IPCC).

Additional background information about Climate Change Reconsidered II: Fossil Fuels is available at these links:

Message from the Coauthors (2-page PDF)
About the Coauthors (1-page PDF)
About NIPCC (1-page PDF)
Impact of Fossil Fuels on Human Health (full-color graphic, PDF)
Complete background package (5-page PDF)


Anchorage “Record” Was Not Actually A Record!

by P. Homewood, July 14, 2019 in NotaLotofPeopleKnowThat


The US state of Alaska, part of which lies inside the Arctic Circle, is sweltering under a heatwave, with record temperatures recorded in several areas, including its largest city.

Temperatures reached 90F (32C) in Anchorage on Thursday, shattering the city’s previous record of 85F.

https://www.bbc.co.uk/news/world-us-canada-48890556

The report clearly implied global warming as the cause, with several references to climate change links throughout the article.

As I pointed out at the time, the all-time record temperature for Alaska was set as long ago as 1915, when an incredible 100F was measured at Fort Yukon.

This story follows the usual BBC recipe for Arctic heatwaves:

  • Record temperatures = global warming
  • Hot weather is unprecedented in the Arctic. Most people would believe that temperatures of 90F simply never used to occur in the Arctic, it just sounds so unimaginable.

Unfortunately for the BBC, it turns out that the Anchorage temperature is not even a record!

I have now had time to check through the NOAA data files, and have discovered that back in June 1931, the temperature actually reached 92C at Anchorage:

Super salty, subzero Arctic water provides peek at possible life on other planets

by University of Washington, July 12, 2019 in ScienceDaily


On Earth, scientists are studying the most extreme environments to learn how life might exist under completely different settings, like on other planets. A University of Washington team has been studying the microbes found in “cryopegs,” trapped layers of sediment with water so salty that it remains liquid at below-freezing temperatures, which may be similar to environments on Mars or other planetary bodies farther from the sun.

At the recent AbSciCon meeting in Bellevue, Washington, researchers presented DNA sequencing and related results to show that brine samples from an Alaskan cryopeg isolated for tens of thousands of years contain thriving bacterial communities. The lifeforms are similar to those found in floating sea ice and in saltwater that flows from glaciers, but display some unique patterns.

“We study really old seawater trapped inside of permafrost for up to 50,000 years, to see how those bacterial communities have evolved over time,” said lead author Zachary Cooper, a UW doctoral student in oceanography.

China has slashed clean energy funding by 39%, leading a global decline

by From MIT Technology review, July 12, 2019 in WUWT


The big picture: The new report suggests last year’s slowdown in renewable-energy construction has extended into 2019, taking the world in exactly the wrong direction at a critical time (see “Global renewables growth has stalled—and that’s terrible news”). Every major report finds that the world needs to radically accelerate the shift to clean energy to have any hope of not blowing past dangerous warming thresholds (see “At this rate, it’s going to take 400 years to transform the energy system”).

GLOBAL INVESTMENT IN GREEN ENERGY DROPS SHARPLY

by GWPF, July 12, 2019 in FinacialTimes


Investment in clean energy slipped to $117.6bn, a decline of 14 per cent compared with the same period last year, according to new research from Bloomberg New Energy Finance.

A sudden change in China’s renewable energy policies last year — when it curbed solar and wind subsidies — has dramatically reduced the number of new projects in the world’s largest market.

Clean energy investment in China was down 39 per cent during the first half of this year, compared with the same period last year.

However, those figures could improve later this year, suggested Justin Wu, BNEF’s head of Asia-Pacific.

Source: BloombergNEF.

Rare fossil in a fossil reveals a dinosaur’s surprising last meal

by Michael Gresko, July 11, 2019 in NationalGeographic


The find—described today in the journal Current Biology—is the fourth Microraptor fossil to preserve stomach contents, but it’s the first to show that Microraptor ate lizards. Previous fossils captured it eating small mammals, fish, or birds. The specimen also reveals that, like some predatory birds today, Microraptor had a taste for swallowing lizards whole and head-first.

This fossil of the feathered dinosaur Microraptor also preserves the animal’s last meal: a lizard it seems to have swallowed whole and head first.

PHOTOGRAPH BY XUWEI YIN

Land’s complex role in climate change

by  Pielke et al., 2016 in PhysicsToday


To date, most reporting on climate has focused on the possibility of catastrophic warming due to carbon dioxide and other greenhouse gases released into the atmosphere. The assessment of climate change risk has essentially been distilled to a single metric: the global average surface temperature. That reality was evident at the 2015 United Nations Climate Change Conference in Paris, where the central negotiating point was whether the global temperature rise should be limited to 1.5 °C or 2 °C. Indeed, a 2016 opinion piece by Simon Lewis (University College London and the University of Leeds, UK) states that, “by endorsing a limit of 1.5 °C, the [Paris] climate negotiations have effectively defined what society considers dangerous.”

But the reality of humans’ impact on climate is exceedingly complex.2 Even if greenhouse gas emissions could be elimi- nated completely, other harmful anthropogenic sources of cli- mate change would remain. And even if global average tem- peratures were contained, human impacts on climate would manifest in other potentially dangerous ways.

One often overlooked human factor is land use. Deforestation, dry land farming, irrigated agriculture, overgrazing, and other alterations to the natural landscape can disrupt Earth’s natural balances and change weather patterns. As with the addition of CO2into the atmosphere, the effects can last for decades or longer and affect regions distant from the original offense. Given continued rapid population growth, they threaten to be irreversible.

Polar Bears Are Thriving Despite Global Warming: Here’s Why

by Susan J. Crockford, July 11, 2019 in ClimateChangeDispatch


This essay explains in simple terms why so many people still believe that polar bears are in peril when nothing could be further from the truth; it is an essential lesson that shatters the basis of the shameful indoctrination of young school children and undermines the baseless claims of activist protestors.

It was written and translated into French for a special climate change feature issue (July) of the monthly French magazine Valeurs Actuelles (reviewed here) and reprinted by the French hunting magazine Chasses Internationales.

It has also been translated into German for a dedicated climate change issue (11 July) of the Swiss weekly magazine Die Weltwoche.

I have added a couple of figures to illustrate this English version of the essay.

Celebrating America’s Environmental Stewardship

by Jim Steele, July 10, 209 in WUWT


What’s Natural?

Celebrating America’s Environmental Stewardship

I resent the one-sided mis-characterization of humanity as “destroyers of our environment”. Humans certainly had negative impacts on most ecosystems. However, in contrast to a recent United Nations report insinuating we are threatening one million species with extinction, humans have been working hard to restore nature and prevent further extinctions. Most endangered species are still staggering from disruptions initiated centuries ago. But now humans are correcting past mistakes.

Islands have been extinction hotspots. Sixty-one percent of all known extinctions have occurred on islands and 37% of today’s critically endangered species are found only on islands. The main driver of island extinctions has been purposeful or unintentional introductions of alien species. Introduced species are implicated in 81% of all island extinctions. With no natural predators, Island species did not evolve needed behaviors to avoid introduced rats, cats and stoats. Researchers now suggest eradication of rats and other introduced mammals could prevent the extinction of up to 75% of threatened island birds, reptiles and mammals.


Ice Box July: Unusual Cold, Surface Frost Sweep Across Central Europe!

by P. Homewood, July 10, 2019 in NotALotOfPeopleKnowThat


No Tricks Zone has the latest on the coldwave gripping much of Northern Europe. Following a new record low for July set in Lower Saxony last week, there are unconfirmed reports of a new record July low for the whole of the Netherlands:
.
.

From No Tricks Zone:

Where have all the globe-trotting climate ambulance chasers gone? Well, they’re nowhere to be found in Europe nowadays.

The reason is the unusual cold that has swept across a large swath of the continent and which has sent temperatures plummeting to near freezing.

Icebox July: Parts of Central Europe saw ground surface frost yesterday morning. Source: Wetteronline.de

Yesterday morning ground frost hit parts of Belgium, Holland, Germany and the Czech Republic, as the above chart shows. Unsurprisingly, the media have been curiously silent about it.

Record Dutch July low


Climate scientists fiddling the data again and again and again and again

by Paul Matthews, June 30, 2019 in ClimateScepticism


The history of climate scientists adjusting data to try to make recent warming look greater than it really is goes back quite a long way – it’s a regular topic at Paul Homewood’s blogfor example. But climate scientists continue to do it, giving the sceptics plenty of ammunition. Here are three recent blog posts discussing how climate scientists continue to adjust data to exaggerate warming.

At Pierre Gosselin’s blog there’s a guest post by Kirje from Japan, on NASA GISS temperature adjustments. In the latest GISS version, V4, the supposedly “unadjusted” data sets are different from the unadjusted data in the previous version V3.

Tony Heller has a graph of the 2000, 2017 and 2019 version of NASA GISTEMP, showing that Gavin Schmidt and his team have managed to crank up  warming, particularly in the era of the inconvenient pause. You can also see this effect in fig 2 and fig 4 of the GISS history page.

Here in the UK, the HadCRUT4 team are doing the same thing. Clive Best asks Whatever happened to the Global Warming Hiatus? The answer is that they have demolished it with a sequence of adjustments to the data. HadCRUT3, as published in 2014, shows a clear pause, with no warming from about 2001-2013, but the latest new improved data set HadCRUT4.6 cranks recent temperatures upwards. Clive thought that night be due to including different measurement stations, but checked and found that was not the case. The numbers have simply been adjusted.

….

Here the red diamond is the raw data, the green diamond is HadSST3, and the new HadSST4 is shown as the black line, with grey shading representing uncertainty. In the early years of the 20th century, there was global warming that doesn’t fit with the carbon-dioxide-controlled theory of climate scientists, so that is adjusted downwards. But look at the trend over the pause era, since 2000. The raw data shows literally no trend at all. HadSST3 adjusted the trend upwards to create warming, and HadSST4 adjusts things upwards again, roughly doubling the previous adjustment. And this is in an era when the data quality should be excellent, thanks to the introduction of the ARGO float system.

‘Woke’ Climate Scientists Reveal Deep, Hard-Core Biases In New Article

by Judith Curry, July 9, 2019 in ClimateChangeDispatch


It’s getting worse.

About 5 years ago, I wrote two blog posts on climate scientists’ pre-traumatic stress syndrome:

Mother Jones has a new article on the same topic: It’s the end of the world as they know it: The distinct burden of being a climate scientist.

The following scientists were interviewed: Kim Cobb, Priya Shukla, Peter Kalmus, Sarah Myhre, Jacquelyn Gill, Katharine Wilkinson, Eric Holthaus, David Grinspoon, Ken Caldeira.

Lots of ‘trauma,’ read the article to get a flavor. This sentence pretty much sums things up:

“There’s deep grief and anxiety for what’s being lost, followed by rage at continued political inaction, and finally hope that we can indeed solve this challenge. There are definitely tears and trembling voices.”

End of civilization?

The title of the article is: “It’s the end of the world as they know it.” Some selected quotes:

Scientists: Humans Perform As Well Or Better When Exposed To High (5000-15000 ppm) vs. Low CO2 Concentrations

by K. Richard, July 8, 2019 in NoTricksZone


A new paper finds the performance of test-taking (cognitive, decision-making) “astronaut-like” subjects exposed to 5000 ppm CO2 was “similar to or exceeded” the performance of those exposed to baseline (600 ppm). This study follows up on a 2018 paper that determined submariners exposed to 15000 ppm CO2 performed just as well as subjects exposed to 600 ppm.

Those of us who own CO2 monitors know that indoor (bedroom) CO2 concentrations typically vary between about 600 ppm during the day and 1000 ppm overnight – the latter earning a frowny face air quality rating.


CO2 is a cognitively-impairing toxin?

In recent years there has been a push to create the impression carbon dioxide is a pollutant, or toxin. Consequently, there have been a few studies suggesting exposure to higher CO2 concentrations (~1500 to 2500 ppm) severely impair human cognitive and decision-making performance (Satish et al., 2012, Allen et al., 2016).

If true, this would be rather problematic for elementary school children, as they are routinely exposed to CO2 concentrations ranging between about 1500 and 3000 ppm in their classrooms (Corsi et al., 2002).

Driving alone in one’s vehicle could mean exposure to “3700 ppm … above outdoor [CO2] concentrations” (Satish et al, 2012), or about 4100 ppm.

This elevated-CO2-is-toxic-to-brain-functioning paradigm suggests the world’s highways are teeming with cognitively-impaired drivers.

Capture et stockage du CO2 : une situation étrange…

by Claude Mandril, 13 mai 2019 in ConnaissanceDesEnergies


La capture et le stockage de CO2 (CCS(1)) est indispensable…

Les accords de Paris ont donné l’objectif : un réchauffement climatique « well below 2°C » d’ici 2100 par rapport aux températures de l’ère préindustrielle.

Le dernier rapport du GIEC montre par ailleurs qu’on serait « beaucoup mieux » à + 1,5°C, et que tout dixième de degré compte : + 1,7°C vaut mieux que + 1,8°C. Il faut donc, ajoute le GIEC, atteindre la neutralité carbone autour de 2050.

Or il est complètement exclu d’arrêter toutes les émissions de gaz à effet de serre, et de loin ! :

  • l’AIE estime dans son scénario Sustainable Development (le plus contraignant)(2) que les énergies fossiles représenteront encore 60% de la fourniture mondiale d’énergie en 2040. Même si on juge l’AIE timorée, on est clairement hors limite ! ;

  • la capacité d’extraction charbonnière en Chine a augmenté de 6% en 2018 (selon la National Energy Administration en Chine) ;

  •  et surtout, n’oublions pas les émissions « de procédé » (ciment, sidérurgie, chimie, agroalimentaire).

Donc il faudra des « puits » de carbone. En premier lieu, les forêts mais à condition qu’elles soient exploitées et que les produits de cette exploitation donnent un stockage permanent. L’incendie de Notre-Dame de Paris montre que ce n’est pas garanti… L’usage du bois en chaudière réduit les émissions en remplaçant des émissions de carbone fossile, mais ce n’est pas un puits (sauf avec CCS !).

Reste donc la CCS, qui est indispensable. D’ailleurs, sur les 4 scénarios du GIEC, 3 comportent le déploiement de la CCS, le 4e étant un repoussoir.

Et pourtant la CCS est complètement ignorée voire vilipendée, sauf dans une dizaine de pays.

Examinons les critiques ou les objections :


What Humans Contribute to Atmospheric CO2: Comparison of Carbon Cycle Models with Observations

by Herman Harde, April 3, 2019 in Earth Sciences


Abstract: The Intergovernmental Panel on Climate Change assumes that the inclining atmospheric CO2 concentration over

recent years was almost exclusively determined by anthropogenic emissions, and this increase is made responsible for the rising

temperature over the Industrial Era. Due to the far reaching consequences of this assertion, in this contribution we critically

scrutinize different carbon cycle models and compare them with observations. We further contrast them with an alternative

concept, which also includes temperature dependent natural emission and absorption with an uptake rate scaling proportional

with the CO2 concentration. We show that this approach is in agreement with all observations, and under this premise not really

human activities are responsible for the observed CO2 increase and the expected temperature rise in the atmosphere, but just

opposite the temperature itself dominantly controls the CO2 increase. Therefore, not CO2 but primarily native impacts are

responsible for any observed climate changes.

Keywords: Carbon Cycle, Atmospheric CO2 Concentration, CO2 Residence Time, Anthropogenic Emissions,

Fossil Fuel Combustion, Land Use Change, Climate Change


Human CO2 Emissions Have Little Effect on Atmospheric CO2

by Edwin X Berry , June, 2019 in JAtmOceanSciences


Abstract
The United Nations Intergovernmental Panel on Climate Change (IPCC) agrees human CO2 is only 5 percent and natural CO2 is 95 percent of the CO2 inflow into the atmosphere. The ratio of human to natural CO2 in the atmosphere must equal the ratio of the inflows. Yet IPCC claims human CO2 has caused all the rise in atmospheric CO2 above 280 ppm, which is now 130 ppm or 32 percent of today’s atmospheric CO2. To cause the human 5 percent to become 32 percent in the atmosphere, the IPCC model treats human and natural CO2 differently, which is impossible because the molecules are identical. IPCC’s Bern model artificially traps human CO2 in the atmosphere while it lets natural CO2 flow freely out of the atmosphere. By contrast, a simple Physics Model treats all CO2 molecules the same, as it should, and shows how CO2 flows through the atmosphere and produces a balance level where outflow equals inflow. Thereafter, if inflow is constant, level remains constant. The Physics Model has only one hypothesis, that outflow is proportional to level. The Physics Model exactly replicates the 14C data from 1970 to 2014 with only two physical parameters: balance level and e-time. The 14C data trace how CO2 flows out of the atmosphere. The Physics Model shows the 14 CO2 e-time is a constant 16.5 years. Other data show e-time for 12CO2 is about 4 to 5 years. IPCC claims human CO2 reduces ocean buffer capacity. But that would increase e-time. The constant e-time proves IPCC’s claim is false. IPCC argues that the human-caused reduction of 14C and 13C in the atmosphere prove human CO2 causes all the increase in atmospheric CO2. However, numbers show these isotope data support the Physics Model and reject the IPCC model. The Physics Model shows how inflows of human and natural CO2 into the atmosphere set balance levels proportional to their inflows. Each balance level remains constant if its inflow remains constant. Continued constant CO2 emissions do not add more CO2 to the atmosphere. No CO2 accumulates in the atmosphere. Present human CO2 inflow produces a balance level of about 18 ppm. Present natural CO2inflow produces a balance level of about 392 ppm. Human CO2 is insignificant to the increase of CO2 in the atmosphere. Increased natural CO2 inflow has increased the level of CO2 in the atmosphere.

Volcanism Altering Bering Sea Eco-Systems, Not Climate Change

by James  E. Kamis, July 8, 2019 in ClimateChangeDispatch


Volcanism, primarily ocean floor in nature, is the most feasible and plausible cause of recent alterations to the Bering Sea physical and biological systems, not climate change.

Since 2014, multiple changes to the Bering Sea’s physical and biological systems such as a rise in seawater temperature, sea ice melting, alteration of commercial fish migration patterns and the very sudden die-off of certain sea bird species have made front-page news.

Many scientists have been quick to attribute these supposedly ‘unnatural’ events to human-induced atmospheric warming or climate change without mentioning or giving due consideration to emissions from active volcanic features that circumvent the entire Bering Sea and populate its seafloor.

This immediate jump to a climate change cause and event effect relationship is especially difficult to understand knowing that frequently during the last five years we have been informed of yet another eruption from a Bering Sea area volcano located in either Russia, Alaska, or on the Bering seafloor.

So, let’s take a moment to review Bering Sea volcanic activity and its likely effect on the area’s physical and biological systems.

La fraction anthropique de + 0,3°C depuis 1880 est “noyée” dans la variabilité naturelle

by François Gervais, 6 juillet 2019 in LaSynthèse.OnLine


Conférence de M.François GERVAIS, Lauréat du Prix Yvan Peyches de l’Académie des Sciences, (6 Juillet 2019)

La vague de chaleur ayant traversé la France lors de la dernière semaine de Juin 2019 a donné lieu à une prolifération d’âneries proférées par certains médias, ainsi que, malheureusement, par certains hommes politiques. Les mêmes qui refusaient de prendre en compte les records de froid de l’hiver 2018-2019 dans l’hémisphère Nord, le record de surface de la banquise dans l’Antarctique du 21 septembre 2014 et le record de froid près du Pôle Sud (-98°6 C en 2018), en disant « Ne mélangez pas météo et climat » se sont mis frénétiquement à brandir des records de chaleur comme des scalps, oubliant au passage le bon conseil qu’ils donnaient eux-mêmes il y a 6 mois… Cette augmentation de la variabilité des températures, qui revient régulièrement dans l’histoire du climat de la Planète Terre, est un phénomène naturel où l’Homme, monté sur ses ergots, joue un rôle bien plus faible que clamé urbi et orbi par ceux qui s’enrichissent, au sens propre, du « climat de peur » qu’ils génèrent.

Pour nourrir le débat de faits scientifiques, recensés par des études menées par des scientifiques renommés, dont les références sont citées sur chaque slide, nous avons demandé à M. François Gervais, ancien Directeur de l’UMR 6157 du CNRS, et expert reviewer du rapport AR5 du GIEC, l’autorisation de reproduire sur La Synthèse les 52 slides projetées lors d’une Conférence qui eut lieu le 13 décembre 2018 (NDLR).


  1. Pour accéder aux 52 slides, résumant les enjeux de la transition énergétique, merci de cliquer sur le premier lien en bas de page.

  2. Pour accéder à la biographie de M. François Gervais, auteur de plus de 230 publications dans des revues scientifiques à comité de lecture, cliquer sur le deuxième lien en bas de page.

  3. Pour assister à la Conférence du 13 décembre 2018, cliquer sur le lien ci-dessous (durée : 59 minutes) :

La géologie, une science plus que passionnante … et diverse