La fraction anthropique de + 0,3°C depuis 1880 est “noyée” dans la variabilité naturelle

by François Gervais, 6 juillet 2019 in LaSynthèse.OnLine


Conférence de M.François GERVAIS, Lauréat du Prix Yvan Peyches de l’Académie des Sciences, (6 Juillet 2019)

La vague de chaleur ayant traversé la France lors de la dernière semaine de Juin 2019 a donné lieu à une prolifération d’âneries proférées par certains médias, ainsi que, malheureusement, par certains hommes politiques. Les mêmes qui refusaient de prendre en compte les records de froid de l’hiver 2018-2019 dans l’hémisphère Nord, le record de surface de la banquise dans l’Antarctique du 21 septembre 2014 et le record de froid près du Pôle Sud (-98°6 C en 2018), en disant « Ne mélangez pas météo et climat » se sont mis frénétiquement à brandir des records de chaleur comme des scalps, oubliant au passage le bon conseil qu’ils donnaient eux-mêmes il y a 6 mois… Cette augmentation de la variabilité des températures, qui revient régulièrement dans l’histoire du climat de la Planète Terre, est un phénomène naturel où l’Homme, monté sur ses ergots, joue un rôle bien plus faible que clamé urbi et orbi par ceux qui s’enrichissent, au sens propre, du « climat de peur » qu’ils génèrent.

Pour nourrir le débat de faits scientifiques, recensés par des études menées par des scientifiques renommés, dont les références sont citées sur chaque slide, nous avons demandé à M. François Gervais, ancien Directeur de l’UMR 6157 du CNRS, et expert reviewer du rapport AR5 du GIEC, l’autorisation de reproduire sur La Synthèse les 52 slides projetées lors d’une Conférence qui eut lieu le 13 décembre 2018 (NDLR).


  1. Pour accéder aux 52 slides, résumant les enjeux de la transition énergétique, merci de cliquer sur le premier lien en bas de page.

  2. Pour accéder à la biographie de M. François Gervais, auteur de plus de 230 publications dans des revues scientifiques à comité de lecture, cliquer sur le deuxième lien en bas de page.

  3. Pour assister à la Conférence du 13 décembre 2018, cliquer sur le lien ci-dessous (durée : 59 minutes) :

PUTTING CLIMATE CHANGE CLAIMS TO THE TEST

by John Christy, June 18, 2019 in GWPF


This is a full transcript of a talk given by Dr John Christy to the GWPF on Wednesday 8th May.

When I grew up in the world of science, science was understood as a method of finding information. You would make a claim or a hypothesis, and then test that claim against independent data. If it failed, you rejected your claim and you went back and started over again. What I’ve found today is that if someone makes a claim about the climate, and someone like me falsifies that claim, rather than rejecting it, that person tends to just yell louder that their claim is right. They don’t look at what the contrary information might say.

OK, so what are we talking about? We’re talking about how the climate responds to the emission of additional greenhouse gases caused by our combustion of fossil fuels. In terms of scale, and this is important, we want to know what the impact is on the climate, of an extra half a unit of forcing amongst total forcings that sum to over 100 units. So we’re trying to figure out what that signal is of an extra 0.5 of a unit.

Here is the most complicated chart I have tonight, and I hope it makes sense:


MULTIPLE ALL-TIME LOW TEMPERATURE RECORDS SET ACROSS GERMANY — RARE JULY FROSTS RAVAGE SAXONY

by Cap Allon, July 5, 2019 in Electroverse


On the back of the well documented 3-days of heat last week, Germany is now setting multiple new record low temperatures as the anticipated and long-lasting Arctic front begins to take hold.

The mercury in Rotenburg, Lower Saxony plunged to 2.9C (37.2F) on Thursday morning — low enough to break the town’s all-time record cold temperature for the month of July which had stood since 1946, according to wetter.com.

The new record low temperature comes just days after Germany logged an all-time record high — serving as further evidence of the swings-between-extremes brought on by low solar activity and the associated weakening of the jet stream.

SEE ALSO: The Changing Jet Stream

Along with Rotenburg, many other regions of Germany also registered record-low temperatures on Thursday morning.

I’ve listed a few below (data again courtesy of wetter.com):

  • Quickborn: 4C (39.2F) — lowest July temperature since 1999.
  • Göttingen: 4C (39.2F) — lowest July temperature since 1996.
  • Soltau: 4.1C (39.4F) — lowest July temperature since 1986.
  • Friesoythe: 4.7C (40.5F) –lowest July temperature since 1971.
  • Lippstadt: 4.8C (40.6F) — lowest July temperature since 1990.
  • Diepholz: 5.1C (41.2F) — lowest July temperature since 1971.

In addition, the village of Deutschneudorf in Saxony reported ground frost this week — an event that’s only occurred on six previous occasions throughout all of Germany during the month of July.

Medieval Climate Anomaly Now Confirmed In Southern Hemisphere On All Four Continents

by Lüning et al., July  6, 2019 in NoTricksZone


For a long time it has been said that the Medieval Warm Period was a purely North Atlantic phenomenon. This has proved to be wrong.

On 29 June 2019, a paper by Lüning et al. 2019 on the Medieval Warm Period in Antarctica appeared in the trade journal Palaeogeography, Palaeoclimatology, Palaeoecology. Here is the abstract:

With the publication of this paper, the Medieval Climate Anomaly (MCA) has now been confirmed on all four continents of the southern hemisphere.

While the largest part of the southern hemisphere apparently experienced a warm phase during the MCA, there were also isolated areas that cooled down. To the latter regions belong, for example, coasts, where cold water from the depth rose increasingly. In other areas so-called climate seesaws or dipoles were active, as we know them from today’s climate. One end of the “seesaw” heats up, the other end cools down.

Another result of the studies is that the medieval climate history of huge areas in the southern hemisphere is simply unknown. A task force urgently needs to be set up to fill in this climatic “empty space” with information on pre-industrial temperature development. This information is urgently needed to calibrate the climate models on the basis of which far-reaching socio-political planning is currently taking place.

What follows are publications on the Medieval Period climate of the southern hemisphere as an overview:

Lüning, S., M. Gałka, F. Vahrenholt (2019): The Medieval Climate Anomaly in Antarctica. Palaeogeogr., Palaeoclimatol., Palaeoecol., doi: 10.1016/j.palaeo.2019.109251

Oscillations of the baseline of solar magnetic field and solar irradiance on a millennial timescale

by Zharkova et al., June 24, 2019 in ScientificReportsNature


Abstract

Recently discovered long-term oscillations of the solar background magnetic field associated with double dynamo waves generated in inner and outer layers of the Sun indicate that the solar activity is heading in the next three decades (2019–2055) to a Modern grand minimum similar to Maunder one. On the other hand, a reconstruction of solar total irradiance suggests that since the Maunder minimum there is an increase in the cycle-averaged total solar irradiance (TSI) by a value of about 1–1.5 Wm−2 closely correlated with an increase of the baseline (average) terrestrial temperature. In order to understand these two opposite trends, we calculated the double dynamo summary curve of magnetic field variations backward one hundred thousand years allowing us to confirm strong oscillations of solar activity in regular (11 year) and recently reported grand (350–400 year) solar cycles caused by actions of the double solar dynamo. In addition, oscillations of the baseline (zero-line) of magnetic field with a period of 1950 ± 95 years (a super-grand cycle) are discovered by applying a running averaging filter to suppress large-scale oscillations of 11 year cycles. Latest minimum of the baseline oscillations is found to coincide with the grand solar minimum (the Maunder minimum) occurred before the current super-grand cycle start. Since then the baseline magnitude became slowly increasing towards its maximum at 2600 to be followed by its decrease and minimum at ~3700. These oscillations of the baseline solar magnetic field are found associated with a long-term solar inertial motion about the barycenter of the solar system and closely linked to an increase of solar irradiance and terrestrial temperature in the past two centuries. This trend is anticipated to continue in the next six centuries that can lead to a further natural increase of the terrestrial temperature by more than 2.5 °C by 2600.

More ‘reactive’ land surfaces cooled the Earth down

by Charles the moderator , July 6, 2019 in WUWT


Higher reactivity could explain temperature drop before last ice age

GFZ GeoForschungsZentrum Potsdam, Helmholtz Centre

From time to time, there have been long periods of cooling in Earth’s history. Temperatures had already fallen for more than ten million years before the last ice age began about 2.5 million years ago. At that time the northern hemisphere was covered with massive ice masses and glaciers. A geoscientific paradigm, widespread for over twenty years, explains this cooling with the formation of the large mountain ranges such as the Andes, the Himalayas and the Alps. As a result, more rock weathering has taken place, the paradigm suggests. This in turn removed more carbon dioxide (CO2) from the atmosphere, so that the ‘greenhouse effect’ decreased and the atmosphere cooled. This and other processes eventually led to the ‘ice Age’.

In a new study, Jeremy Caves-Rugenstein from ETH Zurich, Dan Ibarra from Stanford University and Friedhelm von Blanckenburg from the GFZ German Research Centre for Geosciences in Potsdam were able to show that this paradigm cannot be upheld. According to the paper, weathering was constant over the period under consideration. Instead, increased ‘reactivity’ of the land surface has led to a decrease in CO2 in the atmosphere, thus cooling the Earth. The researchers published the results in the journal Nature.

Scientist Spots High Geothermal Heat Flux In East Greenland – ‘Dramatic Consequences For Ice Basal Melting’

by K. Richard, July 5, 2019 in NoTricksZone


Geothermal heat flux can foment upper mantle temperature anomalies of 800–1000 °C, and these extreme heat intensities have been found to stretch across 500 km of central-east Greenland. This could result in “a significant contribution of ice melt to the ice-drainage system of Greenland” (Artemieva et al., 2019).

Evidence of more than 100,000 formerly or currently active volcanic vents permeate the Earth’s sea floor (Kelley, 2017).

Active volcanoes spew 380°C sulfuric acid and “metal-laden acidic fluids” into the bottom waters of the world ocean on a daily basis. In other words, literal ocean acidification is a natural phenomenon.

The carbon dioxide concentrations present in these acidic floods reach “astounding” levels, dwarfing the potential for us to even begin to appreciate the impact this explosive geothermal activity has on the Earth’s carbon cycle (Kelley, 2017).

About Antarctica

by Thongchai Thailand, June 27, 2019


THIS POST IS A CRITICAL EXAMINATION OF VARIOUS CLAIMS MADE BY CLIMATE SCIENCE ABOUT THE IMPACT OF CLIMATE CHANGE ON ANTARCTICA AND OF THE EVIDENCE FOR AGW CLAIMED TO BE FOUND IN DATA FROM ANTARCTICA.
IT IS BASED ON THE ANTARCTICA SECTION OF A LECTURE BY JAMES EDWARD KAMIS  [LINK]
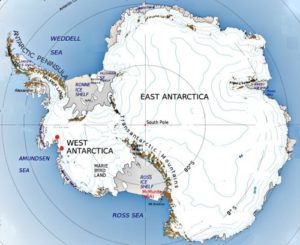
  1. Antarctica is broken into two pieces. On the west is West Antarctica that constitutes 20% of Antarctica. The upper portion of West Antarctica forms a thumb. It’s called the Antarctic Peninsula. The remaining 80% of Antarctica is called East Antarctica. The right image shows a NASA graph that reflects ice melting on the entire continent from 1995 to 2015. It is here shown as a proxy for ice melting denominated as millimeters of sea level rise due to meltwater. Note that West Antarctica, inclusive of the Antarctic Peninsula, the 20% portion of the continent, accounts for all of the continent’s ice loss. East Antarctica, the much larger 80%, is actually gaining ice. This melt graph was created in 2015 by Dr. H. Jay Zwally is Chief Cryospheric Scientist at NASA’s Goddard Space Flight Center and Project Scientist for the Ice Cloud and Land Elevation Satellite.
  2. The lopsided melt data raises this question: why is all the melt concentrated in 20% of the continent while the other 80% gains ice? The answer is found in the University of Washington 50-year average surface temperature map. It was generated in 2009 by Dr. Eric Steig – Earth and Space Sciences – University of Washington. It’s validity was hotly debated for many years. However, since that time, it has been proven correct by two more modern studies. NASA’s skin temperature map and British Antarctic Survey’s temperature map.
  3. The surface temperature map that Dr. Steig made represents the temperature of the upper few meters of ice and sediment and does not reflect the temperature of the atmosphere…

Antarctic sea ice is declining dramatically

by Claire L. Parkinson, July 5, 2019 in WUWT


PNAS first published July 1, 2019 https://doi.org/10.1073/pnas.1906556116

Contributed by Claire L. Parkinson, May 24, 2019 (sent for review April 16, 2019; reviewed by Will Hobbs and Douglas G. Martinson)

Significance

A newly completed 40-y record of satellite observations is used to quantify changes in Antarctic sea ice coverage since the late 1970s. Sea ice spreads over vast areas and has major impacts on the rest of the climate system, reflecting solar radiation and restricting ocean/atmosphere exchanges. The satellite record reveals that a gradual, decades-long overall increase in Antarctic sea ice extents reversed in 2014, with subsequent rates of decrease in 2014–2017 far exceeding the more widely publicized decay rates experienced in the Arctic. The rapid decreases reduced the Antarctic sea ice extents to their lowest values in the 40-y record, both on a yearly average basis (record low in 2017) and on a monthly basis (record low in February 2017).

Abstract

Following over 3 decades of gradual but uneven increases in sea ice coverage, the yearly average Antarctic sea ice extents reached a record high of 12.8 × 10⁶ km2 in 2014, followed by a decline so precipitous that they reached their lowest value in the 40-y 1979–2018 satellite multichannel passive-microwave record, 10.7 × 10⁶ km2, in 2017. In contrast, it took the Arctic sea ice cover a full 3 decades to register a loss that great in yearly average ice extents. Still, when considering the 40-y record as a whole, the Antarctic sea ice continues to have a positive overall trend in yearly average ice extents, although at 11,300 ± 5,300 km2⋅y−1, this trend is only 50% of the trend for 1979–2014, before the precipitous decline. Four of the 5 sectors into which the Antarctic sea ice cover is divided all also have 40-y positive trends that are well reduced from their 2014–2017 values. The one anomalous sector in this regard, the Bellingshausen/Amundsen Seas, has a 40-y negative trend, with the yearly average ice extents decreasing overall in the first 3 decades, reaching a minimum in 2007, and exhibiting an overall upward trend since 2007 (i.e., reflecting a reversal in the opposite direction from the other 4 sectors and the Antarctic sea ice cover as a whole).

Fig. 1. Identification of the 5 sectors used in the regional analyses. These are identical to the sectors used in previous studies (7, 8).

SCE INFO : 45,9°C un record en France ?

by SCE-INFO, 3 juillet 2019 in ScienceClimatEnergie


De nombreux médias l’ont annoncé, tout comme le site MétéoFrance : la barre des 45 °C aurait été franchie pour la première fois en France vendredi 28 juin 2019. On a atteint 45,9 °C à Gallargues-le-Montueux, à l’ouest du Gard, à 16 h 20. Ce serait une première en France depuis que l’on fait des mesures de températures. Température exceptionnelle? Sans remettre en cause le réchauffement global de la basse troposphère, ni l’augmentation de la fréquence des vagues de chaleur constatée par le GIEC, certaines remarques doivent être faites concernant ce record de température.

Avant de sombrer dans le catastrophisme, il est important de “garder la tête froide” et de considérer les quelques points suivants :

1. Une telle température a peut-être déjà été atteinte dans le passé proche, mais n’a tout simplement pas été mesurée. N’oubliez pas qu’il n’y avait pas autant de thermomètres il y a cent ans. Par exemple, en 1865, il n’y avait en France que deux observatoires astronomiques effectuant des observations météorologiques quotidiennes (voir ici). Aujourd’hui, les stations météorologiques professionnelles du réseau de Météo-France, appelé réseau Radome, ne sont que de 554 pour le France métropolitaine. Il faudrait évidemment plus de stations pour monitorer les 643 801 km² de territoire. Aujourd’hui, cela fait une station pour 1162 km2.

2. Pendant l’été 1930, une vague de chaleur a traversé la France, comme l’atteste le petit article de journal ci-dessous (Figure 1) retrouvé dans “The Telegraph” (Brisbane). Les températures sont données en Fahrenheit et 122 Fahrenheit correspondent à 50°C. Bien que l’article ne donne pas les détails de la mesure (il faut donc rester prudent) nous voyons que de telles vagues de chaleurs se sont déjà produites dans le passé. Voyez également ce qui s’est passé en 1900, 1911, 1921 et 1934  ici.

THE COST TO SOCIETY OF RADICAL ENVIRONMENTALISM

by Allan M.R. MacRae, B.A.Sc., M.Eng, July 4, 2019 in WUWT


9. Conclusion

Radical green extremists have cost society trillions of dollars and many millions of lives. Banning DDT and radical green opposition to golden rice blinded and killed tens of millions of children.

Green energy and CO2 abatement schemes, driven by false fears of catastrophic global warming, have severely damaged the environment and have squandered trillions of dollars of scarce global resources that should have been allocated to serve the real, immediate needs of humanity. Properly allocated, these wasted funds might have ended malaria and world hunger.

The number of shattered lives caused by radical-green activism rivals the death tolls of the great killers of the 20th Century – Stalin, Hitler and Mao – radical greens advocate similar extreme-left totalitarian policies and are indifferent to their resulting environmental damage and human suffering… … and if unchecked, radical environmentalism will cost us our freedom.

A Critique of the Fourth National Climate Assessment

by Robert W. Endlich, December 18, 2018 in CAtmSciForum


In describing the errors in the Fourth National Climate Assessment, ‘NCA4’, I’ll use the words from the Executive Summary which purport to link climate changes in the USA to global climate change.

The first claim, “The last few years have also seen record-breaking, climate-related weather extremes,“ is shown to be false, simply by examining climate records, some from the National Climate Data Center.

Tornadoes have been decreasing over the past six decades as temperatures moderate from the significant cooling of the 1940s to 1970s.  As a basic knowledge of meteorology teaches, it is the pole to equator temperature difference that drives the intensity of cold season storms and especially the spring-season storms which bring the extremely strong tornado outbreaks.

Figure 1.  Annual count of strong to violent tornadoes from 1954-2014, showing a significant decrease of tornado activity the past 60 years, based on data from NOAAs Storm Prediction Center. [Note: This graphic replaces the original graphic that showed all tornadoes EF1 and stronger. Correction made 1/25/2019].

Antarctic Sea Ice Suddenly Declined, But Scientists Warn: Don’t Blame Climate Change

by Adam Vaughan, July 3, 2019 in ClimateChangeDispatch


Decades of expanding sea ice in Antarctica have been wiped out by three years of sudden and dramatic declines, leaving scientist puzzled as to why the region has flipped so abruptly.

A new satellite analysis reveals that between 2014 and 2017 sea ice extent in the southern hemisphere suffered unprecedented annual decreases, leaving the area covered by sea ice at its lowest point in 40 years.

The declines were so big that they outstripped the losses in the fast-melting Arctic over the same period.

“It’s very surprising. We just haven’t seen decreases like that in either hemisphere,” says Claire Parkinson at NASA’s Goddard Space Flight Center, who undertook the analysis.

However, researchers cautioned against pinning the changes on climate change and said it was too early to say if the shrinking is the start of a long-term trend or a blip.

After growing for decades, Antarctic sea ice extent declined at an unprecedented rate between 2014 and 2017.

New Paper: Mammals Thrived and Diversified With ~2000-4000 ppm CO2, 20°C Warmer Oceans Than Today

by K. Richard, July 1, 2019 in NoTricksZone


Marine species evolved, thrived, and diversified in 35 to 40°C ocean temperatures and CO2 concentrations “5-10x higher than present-day values” (Voosen, 2019 and Henkes et al., 2018).

Image Source: Voosen, 2019

I. The insignificance of modern “global warming”

Today’s ocean temperatures average about 16°C. CO2 levels hover around 400 parts per million (0.04%).

The oceans have warmed at a rate of just 0.015°C per decade since 1971 in the 0-700 m layer according to the IPCC (2013). This warming rate isn’t detectable when considering overall long-term changes in this layer (Rosenthal et al., 2017) during the Holocene.

Record High Temperatures in France: 3 Facts the Media Don’t Tell You

by Roy Spencer, July 2, 2019 in GlobalWarming


News reporting of the recent heat wave in France and other European countries was accompanied with the usual blame on humans for causing the event. For example, here’s the CBS News headline: Record-breaking heat is scorching France. Experts say climate change is to blame.

While it is possible that the human component of recent warming might have made the heat wave slightly worse, there are three facts the media routinely ignore when reporting on such “record hot” events. If these facts were to be mentioned, few people with the ability to think for themselves would conclude that our greenhouse gas emissions had much of an impact.

1. Record High Temperatures Occur Even Without Global Warming

Claim: Russia will be Ruined by the Clean Energy Transition

by Eric Worall, June 29, 2019 in WUWT


According to Forbes, when renewable energy programmes like Germany’s Energiewende mature, demand for Russian fossil fuel will collapse.

World Energy Consumption. By Con-structBP Statistical Review of World Energy 2017, CC BY-SA 3.0, Link

Will Russia Survive The Coming Energy Transition?

Jun 27, 2019, 10:35am
Ariel Cohen Contributor

A new global energy reality is emerging. The era of the hydrocarbon – which propelled mankind through the second stage of the industrial revolution, beyond coal and into outer space – is drawing to a close. The stone age ended not because we ran out of stones. The same with oil and gas.

We have now entered the era of the renewable energy resource, whereby zero-emission electricity is generated via near unlimited inputs (solar radiation, wind, tides, hydrogen, and eventually, deuterium). Cutting-edge, smart electric grids, utility-scale storage, and electric self-driving vehicles – powered by everything from lithium-ion batteries to hydrogen fuel cells – are critical elements of this historic energy transition.
Each of these technological trends will displace demand for Russia’s primary source of budget revenues: fossil fuels.

Arctic Sea Ice Surprise Global Warming Experts By Remaining Stable This Decade

by P. Gosselin, June 28, 2019 in NoTricksZone


The Danish Meteorological Institute (DMI) expects sea ice extent growth in June 2019:

The DMI plot for the development of Arctic sea ice area (extent) from June 1979 to the PROGNOSE for June, 2019. Since 2010, i.e. 9 years ago, the sea ice areas of the Arctic have been growing in trend. Reports about disappearing sea ice in the Arctic are fake news. See also: No ice melting in the Arctic in this decade. Source: DMI-Plots Ice Cover

May Arctic sea ice trend now stable 15 years

Fermeture ou prolongation de la durée de vie des centrales nucléaires : quelles conséquences économiques et environnementales ?

by Prof.  Ernest Mund, 25 juin 2019 in ScienceClimatEnergie


A la façon dont vont les choses il paraît de plus en plus certain que la Belgique mettra la clé sous le paillasson de son parc de centrales nucléaires en 2025, conformément à la décision de la loi Deleuze votée en 2003. Cet abandon très néfaste est la conséquence du manque de discernement de la part des Autorités politiques au pouvoir face à l’hostilité irréductible du mouvement écologiste à l’égard du nucléaire.

Que cet abandon soit très néfaste est argumenté avec énormément de détails dans un rapport récent de l’IEA (Agence Internationale de l’Energie) dont plusieurs éléments chiffrés sont utilisés dans cette note [1]. Ce rapport analyse avec grande acuité le déclin du nucléaire en service, conçu au cours des années 70. A cette époque le système électrique était centralisé avec une intégration verticale de ses différentes composantes et le prix de l’électricité était le reflet des coûts, indépendamment de toute considération relative à une logique de marché. La taille des installations visait à la réduction des coûts par effet d’échelle. Ce nucléaire (de Génération-II et -III) est devenu totalement inadapté au système décentralisé actuel, alimenté pour une part rapidement croissante en sources d’énergie renouvelable intermittentes (EnRI, éolien et solaire) avec un prix de l’électricité relevant d’un marché, institué dans le courant des années 90.

More Failed Predictions: May Was The Second Wettest Month In US History

by Chriss Street, June 28, 2019 in ClimateChangeDispatch


National Oceanic and Atmospheric Administration reported the month of May was the second wettest and temperatures were in the bottom-third for its 125-year US history.

The 2010 publication titled, ‘A Global Overview Of Drought and Heat-Induced Tree Mortality Reveals Emerging Climate Change Risks for Forests’, was accepted by the Obama administration as scientific evidence that climate change had made the Earth:

“…increasingly vulnerable to higher background tree mortality rates and die-off in response to future warming and drought, even in environments that are not normally considered water-limited.”

But NOAA just reported that May US precipitation totaled an average of 4.41 inches, 1.50 inches above average, and ranked second wettest in the 125-year period of record for May as well as second wettest for all months since January 1895.

The only wetter month in US history was May 2015 with 4.44 inches of precipitation.

The 37.68 inches of precipitation across the contiguous U.S. from June 2018 to May 2019 shattered the previous 1982-83 12-month period by 1.48 inches.

Near-record to record precipitation was observed from the West Coast through the central Plains and into the Great Lakes and parts of the Northeast.

As a result, severe May flooding was observed along the Arkansas, Missouri, and Mississippi rivers. Vicksburg, MS, reported ongoing flooding since mid-February.

Truth(?) in testimony and convincing policy makers

by Judith Curry , June 28, 2019 in WUWT


Some reflections, stimulated by yesterday’s Congressional Hearing, on the different strategies of presenting Congressional testimony.

Yesterday’s Hearing provided an ‘interesting’ contrast in approaches to presenting testimony, when comparing my testimony with Michael Mann’s.

What are the purposes of expert testimony?

There is an interesting document entitled A Guide to Expert Testimony for Climate Scientists, funded by the US National Science Foundation.  Most of this is related to court room hearings, but some is relevant for Congressional Hearings.  Excerpts:


Experts may do one or more of the following:

  • Provide the decision-maker with factual information and background to provide the decision-maker with an adequate context for the decision.
  • Apply expert knowledge to the facts of a case and render an opinion about the facts, such as whether certain conditions actually caused an effect.
  • Explain scientific principles and theories to the decision-maker.
  • Extrapolate from the actual facts or hypothetical facts and rendering an opinion regarding the likelihood of an event or occurrence. Experts may speculate on events or occurrences because of their special knowledge or training.
  • Provide an opinion that contradicts or undermines the opinions or conclusions of an expert who testified for the opposing party.

If you are assigned to cross-examine an expert, you should prepare questions that test and challenge the witness on the following subjects :

  • Lack of thoroughness in investigating the facts or data;

  • Insufficient testing of the facts or data;

  • Lack of validity and reliability in testing of facts or data;

  • Existence of other causes or explanations for conclusions or outcomes;

  • Show differences of opinion among experts

Weaning US power sector off fossil fuels would cost between $4.7tn and $10tn

by Reuters News Service, June 27, 2019 in CyprusMail


Eliminating fossil fuels from the U.S. power sector, a key goal of the “Green New Deal” backed by many Democratic presidential candidates, would cost $4.7 trillion and pose massive economic and social challenges, according to a report released on Thursday by energy research firm Wood Mackenzie.

That would amount to $35,000 per household, or nearly $2,000 a year for a 20-year plan, according to the study, which called the price tag for such a project “staggering.”

The report is one of the first independent cost estimates for what has become a key issue in the 2020 presidential election, with most Democrats proposing multi-trillion-dollar plans to eliminate U.S. carbon emissions economy-wide.

Front-runner Joe Biden’s plan to get to zero emissions, for example, carries a $1.7 trillion price tag, while Beto O’Rourke’s proposal comes in at $5 trillion. Representative Alexandria Ocasio-Cortez, one of the authors of the “Green New Deal,” a non-binding Congressional resolution, put the cost of a comprehensive climate solution at around $10 trillion.

Such ideas aim to tap into a growing sense of urgency about global warming on both sides of the political divide, but have been panned by President Donald Trump and many Republicans as being unfeasible, costly, and a threat to the economy.

A power-generating wind turbine is seen in Saint-Laurent-Des-Eaux near Orleans, France

More than 50 newly discovered lakes beneath the Greenland Ice Sheet

by Lancaster University, June 26, 2019 in ScienceDaily


Researchers have discovered 56 previously uncharted subglacial lakes beneath the Greenland Ice Sheet bringing the total known number of lakes to 60. Although these lakes are typically smaller than similar lakes in Antarctica, their discovery demonstrates that lakes beneath the Greenland Ice Sheet are much more common than previously thought.

Dr Stephen J. Livingstone, Senior Lecturer in Physical Geography, University of Sheffield, said:

“The lakes we have identified tend to cluster in eastern Greenland where the bed is rough and can therefore readily trap and store meltwater and in northern Greenland, where we suggest the lakes indicate a patchwork of frozen and thawed bed conditions.

“These lakes could provide important targets for direct exploration to look for evidence of extreme life and to sample the sediments deposited in the lake that preserve a record of environmental change.”

How geologic forces are melting southern Greenland ice sheet

by J.E. Kamis, May 25, 2016 in ClimateChangeDispatch


The most plausible scenario for southern Greenland’s surface ice melt is related to geologically induced heat flow and not atmospheric warming for various, well-established reasons. Based on research by the National Oceanic and Atmospheric Administration (NOAA) (see here), the top surface of southern Greenland’s ice sheet is currently melting at a high rate and therefore greatly reducing surface ice volume. They attribute this geographically localized melting effect to an unusually persistent and man-made atmospheric high pressure system (a so-called Omega Block) that has remained stationary above southern Greenland during the spring of 2016.

This non-moving high-pressure system has trapped a cell of very warm air above southern Greenland resulting in higher-than-normal surface ice melting rates and volumes. NOAA and the mainstream media are portraying this above-average melting as undeniable proof man-made global warming damaging our planet.

This portrayal is vastly misleading.

That’s because southern Greenland’s surface ice melt is more likely caused by natural, geologically induced heat flow from one of Earth’s largest Deep Ocean crustal plate junctures, the 10,000 mile long Mid-Atlantic Ridge (MAR). The Mid-Atlantic Ridge is “an immensely long mountain chain extending for about 10,000 miles (16,000 km) in a curving path from the Arctic Ocean to near the southern tip of Africa. The ridge is equidistant between the continents on either side of it. The mountains forming the ridge reach a width of 1,000 miles.”

Now 20 years with no trend in ice breakup dates for Western Hudson Bay polar bears

by Polar Bear Science, June  26, 2019


Straight from the horse’s mouth: all polar bear females tagged by researchers around Churchill in Western Hudson Bay last year were still on the ice as of 25 June. With plenty of ice still remaining over the bay, spring breakup will be no earlier this year than it has been since 1999. Contrary to predictions of ever-declining ice cover, the lack of a trend in sea ice breakup dates for Western Hudson Bay is now twenty years long (a hiatus, if you will) and yet these bears are repeatedly claimed to have been seriously harmed in recent years by a loss of sea ice.


La géologie, une science plus que passionnante … et diverse