The text voted in Parliament also excludes fossil fuels and gas infrastructure from the EU’s proposed green finance taxonomy, which aims to divert investments away from polluting industries into clean technologies.
In a bid to prevent “green-washing”, the Parliament text also requires investors to disclose whether their financial products have sustainability objectives, and if they do, whether the product is consistent with the EU’s green assets classification, or taxonomy.
While activists applauded the move, they said the classification voted by the European Parliament was too narrow and applies only to a limited set of recognisable green assets, such as wind and solar power companies.
“Brown list” rejected
An amendment to publish a “brown list” to name and shame investments seen as damaging for the environment was rejected by Parliament.
A new paper published in the Journal of Weather and Climate Extremes by Dittus et al confirms what many skeptics has strongly suspected all along: There’s no trend in precipitation extremes and there isn’t much predictability either.
Depuis plusieurs années un des combats mené par les écologistes dans différents pays européens (Allemagne, France, Belgique, ..) fut et reste celui du nucléaire mené actuellement en parallèle avec celui de la réduction des gaz à effet de serre (GES). Les « verts » allemands ont obtenu la fermeture de presque toutes les centrales nucléaires et l’Allemagne a toujours une exploitation importante de centrales gaz-charbon. L’Allemagne est ainsi le plus grand émetteur de CO2 en Europe. Il en est de même des pays de l’Est et de la Russie qui exploitent essentiellement des centrales gaz-charbon. En Belgique, la fermeture définitive des centrales nucléaires est prévue pour 2025.
Are values of equilibrium climate sensitivity > 4.5 C plausible?
For background, see these previous posts on climate sensitivity [link]
Here are some possibilistic arguments related to climate sensitivity. I don’t think the ECS example is the best one to illustrate these ideas [see previous post], and I probably won’t include this example in anything I try to publish on this topic (my draft paper is getting too long anyways). But possibilistic thinking does point you in some different directions when pondering the upper bound of plausible ECS values.
5. Climate sensitivity
Equilibrium climate sensitivity (ECS) is defined as the amount of temperature change in response to a doubling of atmospheric CO2 concentrations, after the climate system has reached equilibrium. The issue with regards to ECS is not scenario discovery; rather, the challenge is to clarify the upper bounds of possible and plausible worst cases.
The IPCC assessments of ECS have focused on a ‘likely’ (> 66% probability) range, which has mostly been unchanged since Charney et al. (1979), to be between 1.5 and 4.5 oC. The IPCC AR4 (2007) did not provide any insight into a worst-case value of ECS, stating that values substantially higher than 4.5 oC cannot be excluded, with tail values in Figure 9.20 exceeding 10 oC. The IPCC AR5 (2013) more clearly defined the upper range, with a 10% probability of exceeding 6 oC.
Since the IPCC AR5, there has been considerable debate as to whether ECS is on the lower end of the likely range (e.g., < 3 oC) or the higher end of the likely range (for a summary, see Lewis and Curry, 2018). The analysis here bypasses that particular debate and focuses on the upper extreme values of ECS.
Extreme scientists and politicians warn we will suffer catastrophic climate change if the earth’s average temperature rises 2.7°F above the Little Ice Age average. They claim we are in a climate crisis because average temperature has already warmed by 1.5°F since 1850 AD. Guided by climate fear, politicians fund whacky engineering schemes to shade the earth with mirrors or aerosols to lower temperatures. But the cooler Little Ice Age endured a much more disastrous climate.
The Little Ice Age coincides with the pre-industrial period. The Little Ice Age spanned a period from 1300 AD to 1850 AD, but the exact timing varies. It was a time of great droughts, retreating tree lines, and agricultural failures leading to massive global famines and rampant epidemics. Meanwhile advancing glaciers demolished European villages and farms and extensive sea ice blocked harbors and prevented trade.
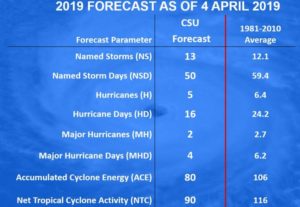
Dr. Philip Klotzbach of Colorado State University writes on Twitter:
Seasonal #hurricane forecast from @ColoradoStateU predicts slightly below-average season: 13 named storms, 5 hurricanes & 2 major (Cat 3+, >=111 mph) hurricanes. Primary reason for slightly below-avg forecast is anticipated continuation of weak #ElNino.
We anticipate that the 2019 Atlantic basin hurricane season will have slightly belownormal activity. The current weak El Niño event appears likely to persist and perhaps even strengthen this summer/fall. Sea surface temperatures averaged across the tropical Atlantic are slightly below normal, and the far North Atlantic is anomalously cool.
Our Atlantic Multi-decadal Oscillation index is below its long-term average. We anticipate a slightly below-average probability for major hurricanes making landfall along the continental United States coastline and in the Caribbean. As is the case with all hurricane seasons, coastal residents are reminded that it only takes one hurricane making landfall to make it an active season for them. They should prepare the same for every season, regardless of how much activity is predicted.
PROBABILITIES FOR AT LEAST ONE MAJOR (CATEGORY 3-4-5) HURRICANE LANDFALL ON EACH OF THE FOLLOWING COASTAL AREAS:
1) Entire continental U.S. coastline – 48% (average for last century is 52%)
2) U.S. East Coast Including Peninsula Florida – 28% (average for last century is 31%)
3) Gulf Coast from the Florida Panhandle westward to Brownsville – 28% (average for last century is 30%)
PROBABILITY FOR AT LEAST ONE MAJOR (CATEGORY 3-4-5) HURRICANE TRACKING INTO THE CARIBBEAN
(10-20°N, 88-60°W) 1) 39% (average for last century is 42%)
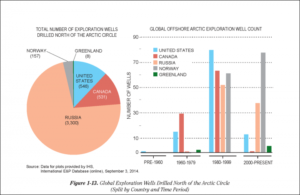
I ran across a very lucid and informative article on Real Clear Energy today. The author is Robert Dillon, “a senior adviser on energy security at the American Council for Capital Formation and the former communications director of the Senate Energy and Natural Resources Committee.” The article includes numerous links to supporting information, particularly the National Petroleum Council’s (NPC) 2015 report on U.S. Arctic oil & gas resource potential.
Arctic oil and gas resources are large and can contribute significantly to meeting future U.S. and global energy needs.
The arctic environment poses some different challenges relative to other oil and gas production areas, but is generally well understood.
The oil and gas industry has a long history of successful operations in arctic conditions enabled by continuing technology and operational advances.
Most of the U.S. Arctic offshore conventional oil and gas potential can be developed using existing field-proven technology.
The economic viability of U.S. Arctic development is challenged by operating conditions and the need for updated regulations that reflect arctic conditions.
Realizing the promise of Arctic oil and gas requires securing public confidence.
There have been substantial recent technology and regulatory advancements to reduce the potential for and consequences of a spill.
Figure 1-1. Arctic exploration wells by country and time period. (NPC)
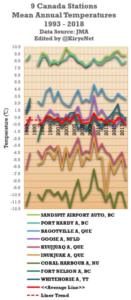
Canada’s CBC here recently cited “a leaked report” which claimed Canada is “warming at twice the global rate.”
According to the “leaked report”, Canada’s annual average temperature over land has warmed 1.7 C when looking at the data since 1948. But that claim is misleading when recent data is considered.
Over the past 25 years, since scientists began to warn that the planet was warming in earnest, there has not been any warming when one looks at the untampered data provided by the Japan meteorology Agency (JMA) that were measured by 9 different stations across Canada. These 9 stations have the data dating back to around 1983 or 1986, so I used their datasats.
Looking at the JMA database and plotting the stations with longer term recording, we have the following chart:
A number of scientists from the alarmist camp like to insist that there had never been such a hiatus. The latest paper contradicts that claim.
The new study states that many published analyses show that lightning activity is responsive to temperature on time scales ranging from the diurnal to the decadal and that the hiatus in global warming earlier this century can be seen in several global datasets.
Scientists found that the statistically flat behavior of the global lightning record from the NASA Lightning Imaging Sensor over the same decadal period is consistent with this hiatus in global warming.
What follows is the paper’s abstract:
Multiple records of global temperature contain periods of decadal length with flat or declining temperature trend, often termed a ‘hiatus’. Towards assessing the physical reality of two such periods (1940–1972 and 1998–2014), lightning data are examined. Lightning activity is of particular interest because on many different time scales it has been shown to be non-linearly dependent on temperature. During the earlier hiatus, declining trends in regional thunder days have been documented. During the more recent hiatus, lightning observations from the Lightning Imaging Sensor in space show no trend in flash rate. Surface-based, radiosonde-based and satellite-based estimates of global temperature have all been examined to support the veracity of the hiatus in global warming over the time interval of the satellite-based lightning record. Future measurements are needed to capture the total global lightning activity on a continuous basis.”
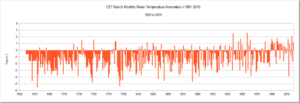
by P. Homewood, April 3, 2019 in NotaLotofPeopleKnowThat
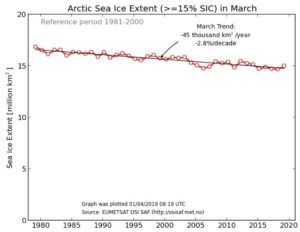
According to CET, March 2019 was the 17th warmest on record since 1659, 1.2C higher than the 1981-2010 average.
Sound impressed? No, thought not!
The month as a whole actually seemed to be pretty unremarkable. There was some mild weather at the start of the month, accompanied by very wet weather. The last few days were also pleasant and sunny.
But unusually warm?
The graph at the top gives a bit of perspective.
First of all it is obvious that last month was pretty typical of Marchs during the last 30 years or so.
The fact that it is 1.2C above the 30-year average means little, as natural variability means some years are warmer and others cooler, such as last year. That’s what an average is.
Indeed, in the last 30 years, eleven had March anomalies of 1C or more. Six of these years were warmer than this March.
By far the warmest Marchs were in 1957 and 1938, again suggesting that there was nothing unusual about last month.
The other thing which stands out is that most Marchs used to be much colder than normal until the 1980s.
That’s according to Norwegian Professor Ole Humlum whose annual review of the world’s climate is published today by the Global Warming Policy Foundation. Last week, the WMO issued its own review of the climate, which insinuated that global warming was worsening. However, Professor Humlum points out that the data tells a very different story: “Reading the WMO report, you would think that global warming was getting worse. But in fact it is carefully worded to give a false impression. The data are far more suggestive of an improvement than a deterioration.” And the lack of anything to be alarmed about is clear across a range of measures, says Professor Humlum: “After the warm year of 2016, temperatures last year continued to fall back to levels of the so-called warming “pause” of 2000-2015. There is no sign of any acceleration in global temperature, hurricanes or sea-level rise. These empirical observations show no sign of acceleration whatsoever.”
Professor Humlum’s key findings:
In 2018, the average global surface temperature continued a gradual descent towards the level characterising the years before the strong 2015–16 El Niño episode.
Since 2004, when the Argo floats came into operation, the global oceans above 1900m depth have on average warmed somewhat. The maximum warming (between the surface and 120 m depth) mainly affects oceans near the equator, where the incoming solar radiation is at a maximum. In contrast, net cooling has been pronounced for the North Atlantic since 2004.
Data from tide gauges all over the world suggest an average global sea-level rise of 1– 1.5 mm/year, while the satellite record suggests a rise of about 3.2 mm/year. The large difference between the two data sets still has no broadly accepted explanation.
The Northern Hemisphere snow cover extent has undergone important local and regional variations from year to year. The overall global tendency since 1972, however, is for overall stable snow extent.
Tropical storm and hurricane accumulated cyclone energy (ACE) values since 1970 have displayed large variations from year to year, but no overall trend towards either lower or higher activity. The same applies for the number of hurricane landfalls in the continental United States, for which the record begins in 1851.
Good news continues to accumulate regards corals’ ability to rapidly adjust to changing climates. The view of coral resilience has been dominated by the narrative of a few scientists. In the 1990s they advocated devastating consequences for coral reefs due to global warming, arguing coral cannot adapt quickly enough. Since the Little Ice Age ended, they believed rising ocean temperatures had brought coral closer to a “bleaching threshold”, a more or less fixed upper temperature limit above which corals cannot survive. Their model predicted the speed of recent global warming “spells catastrophe for tropical marine ecosystems everywhere”. Their assertions that “as much as 95% of the world’s coral may be in danger of being lost by mid-century” was guaranteed to capture headlines and instill public fear. However, a growing body of scientific research increasingly casts doubts on such alarming predictions. Unfortunately, that good news gets much less attention.
A recent peer-reviewed paper titled A Global Analysis of Coral Bleaching Over the Past Two Decades (Sully 2019) compared 20 years of ocean temperatures at which coral bleaching was initiated. From 1998 to 2006, the average sea surface temperature that initiated bleaching was 82.6 °F. But that temperature limit proves not to be “fixed” as earlier researchers incorrectly believed. From 2007 to 2017 the average temperature limit that initiated bleaching was higher, 83.7 °F. This indicates coral have been rapidly adapting to warmer regional climates much faster than once believed.
by Bloomberg, April 2, 2019 in SouthChinaMorningPost
China’s home-grown nuclear technology is gaining favour in the battle for the nation’s next generation of reactors, according to a state-owned developer, as it sought to recover from delays and cost blowouts from imported designs.
China’s reactor, known as the Hualong One, will be faster and easier to repair and maintain than competing foreign designs because it will be made at home, according to Chen Hua, chief executive officer of China National Nuclear Power company (CNNP), which builds and operates nuclear power projects.
“We prefer the Hualong One,” Chen said on Monday at a nuclear energy conference in Beijing.
The global nuclear industry has been awaiting a revival in China after cost overruns and stricter regulation after the 2011 Fukushima disaster in Japan stalled the approval and construction of more units.
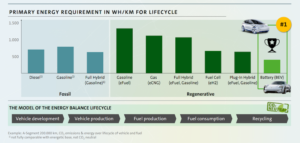
Il y a urgence à agir pour réduire les émissions de CO2. La marche et le vélo sont certes préférables à la voiture particulière. Mais parmi les différents types de voitures, quelle est la solution la plus efficace pour réduire les émissions de CO2 ?
Il existe un indicateur particulièrement intéressant pour tenter d’y répondre : la quantité d’énergie consommée pour réaliser par exemple 200.000 kilomètres. Energie non seulement pour propulser la voiture, mais aussi pour fabriquer la voiture elle-même et extraire dans les mines les matières premières nécessaires. Le bilan carbone est bien entendu corrélé au bilan énergétique. Les experts du groupe Volkswagen (VW) ont fait le calcul et ont présenté les résultats le 12 mars 2019 à l’occasion de la conférence de presse annuelle de ce mastodonte dont les décisions influencent l’industrie automobile mondiale.
Verdict : la voiture aux carburants synthétiques (eFuel et eCNG) consomme trois fois plus d’énergie primaire que la voiture électrique. Et celle à l’hydrogène, 1,7 fois plus. Ces 70 % supplémentaires représentent un impact à la fois économique et carbonique. La fabrication de la pile à combustible et du réservoir capable de résister à une pression de 700 atmosphères est énergivore. La voiture à hydrogène la plus vendue au monde (quelques milliers d’exemplaires) pèse 1.850 kg, soit 3 kilos de plus que la Tesla Model 3 Long Range (100 % batterie), qui a la même autonomie. Mais, c’est surtout le mauvais rendement de la chaîne hydrogène qui plombe le bilan global.
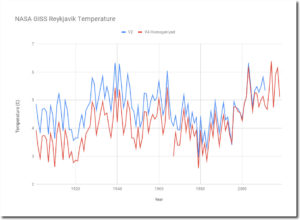
One fellow climate blogger recently wrote on how he’s been been looking at GHCN ‘unadjusted’ data and noticed that scientists at NASA appear to have been altering them: “This is a fairly disturbing development,” he wrote.
Heating up Reykjavik and Nuuk
Cited as an example is Reykyavik, Iceland. According to Tony Heller here, “The current version V4 has massively cooled the past, to make it look like Iceland is warming.”
Heller then posted a chart showing the difference between v2 unadjusted and the new v4 ‘unadjusted’ for the Reykjavik station.
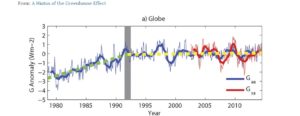
Scientists have found the greenhouse effect’s (GHE) influence on planetary temperatures went on “hiatus” during 1992-2014.
The estimated GHE radiative influence for these 22 years was a slightly negative -0.04 Wm-2 per year.
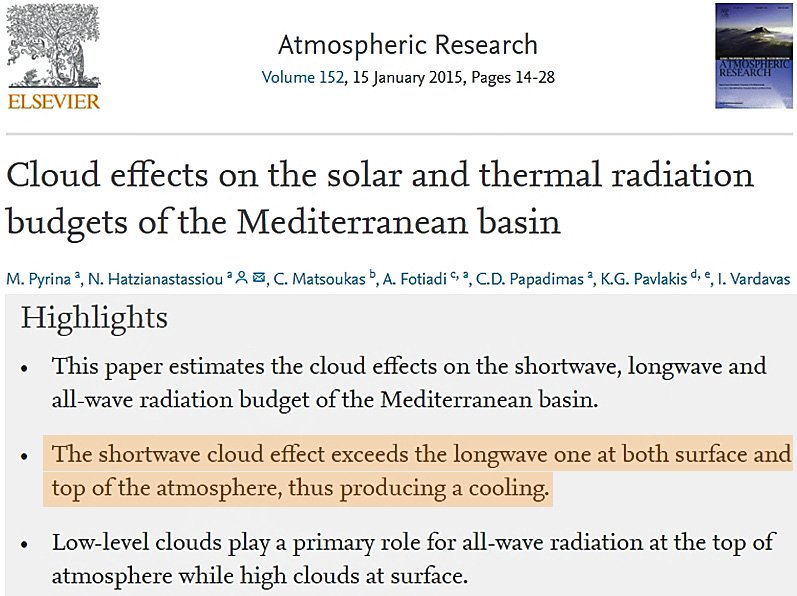
The reason why the GHE influence went on hiatus in recent decades is that (a) decadal-scale changes in cloud cover exert dominant radiative control in longwave forcing (GHE) efficacy, and (b) the shortwave effects of cloud cover changes override the radiative longwave effects, meaning that a decrease in cloud cover will allow more direct shortwave radiation to be absorbed by the Earth system, eliciting a net positive imbalance in the energy budget.
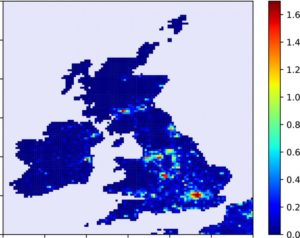
This study aims to estimate the affect of urbanisation on daily maximum and minimum temperatures in the United Kingdom. Urban fractions were calculated for 10 km × 10 km areas surrounding meteorological weather stations. Using robust regression a linear relationship between urban fraction and temperature difference between station measurements and ERA‐Interim reanalysis temperatures was estimated.
For an urban fraction of 1.0, the daily minimum 2‐m temperature was estimated to increase by 1.90 ± 0.88 K while the daily maximum temperature was not significantly affected by urbanisation. This result was then applied to the whole United Kingdom with a maximum Tmin urban heat island intensity (UHII) of about 1.7K in London and with many UK cities having Tmin UHIIs above one degree.
This paper finds through the method of observation minus reanalysis that urbanisation has significantly increased the daily minimum 2‐m temperature in the United Kingdom by up to 1.70 K.
…
Figure 5 Map showing the change in Tmin due to the urbanisation at the 10 km × 10 km scale over the United Kingdom and Ireland. The colour bar shows the magnitude of the temperature change in K
One of the central mysteries of paleontology is the so-called “three-metre problem.” In a century and a half of assiduous searching, almost no dinosaur remains have been found in the layers three metres, or about nine feet, below the KT boundary, a depth representing many thousands of years. Consequently, numerous paleontologists have argued that the dinosaurs were on the way to extinction long before the asteroid struck, owing perhaps to the volcanic eruptions and climate change. Other scientists have countered that the three-metre problem merely reflects how hard it is to find fossils. Sooner or later, they’ve contended, a scientist will discover dinosaurs much closer to the moment of destruction.
…
Locked in the KT boundary are the answers to our questions about one of the most significant events in the history of life on the planet. If one looks at the Earth as a kind of living organism, as many biologists do, you could say that it was shot by a bullet and almost died. Deciphering what happened on the day of destruction is crucial not only to solving the three-metre problem but also to explaining our own genesis as a species.
The IPCC’s AR5 estimated the global warming caused by a tonne of livestock methane would be 28 times that of a tonne of carbon dioxide. New research destroys that estimate.
The war on meat has been gathering pace amongst our Western elites. The Economist makes a detailed case for “plant-based food” in the interests of quelling climate change –
The FAO calculates that cattle generate up to two-thirds of the greenhouse gases from livestock, and are the world’s fifth largest source of methane. If cows were a country, the United Herds of Earth would be the planet’s third largest greenhouse-gas emitter.
These calculations are based on figures supplied by the IPCC’s AR5, which contends that the global warming potential (GWP) of methane over 100 years is no less than 28 times the global warming it expects to be caused by an equivalent weight of carbon dioxide. This estimate is up from the GWP of 21 put forward in the IPCC’s previous report.
All this is now challenged by a new and authoritative research paper, Allen et al (2017): “A solution tothe misrepresentations of CO2-equivalent emissions of short-lived climate pollutants, under ambitious mitigation”. This paper finds that conventional GWPs misrepresent the impact of short-lived gases (such as methane) on global temperature – and recommends the adoption of a new metric, denoted as GWP*.
by P. Homewood, March 30, 2019 in NotaLotofPeopleKnowThat
…
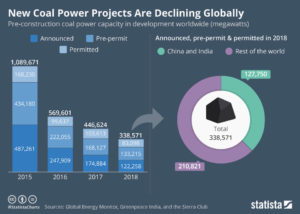
Anybody expecting that retirements will start outstripping new builds soon will be severely disappointed however.
As we know, the UK has already shut many coal plants, and the ones left are generating very little power. Other EU nations are following suit, so there will soon be little scope for further retirements.
Meanwhile Germany and several eastern European countries, such as Poland have no intention of moving away from coal for many years to come.
In the US, coal power generation has fallen by 39% in the last decade, principally due to low gas prices. It now only accounts for 13% of global coal generation.
Worldwide, there is 574 GW of coal power in the pipeline, including 281 GW outside of China and India. Whatever the US and EU do will scarcely make a dent in that lot.
Constraining the response time of the climate system to changes in North Atlantic Deep Water (NADW) formation is fundamental to improving climate and Atlantic Meridional Overturning Circulation predictability. Here we report a new synchronization of terrestrial, marine, and ice-core records, which allows the first quantitative determination of the response time of North Atlantic climate to changes in high-latitude NADW formation rate during the last deglaciation. Using a continuous record of deep water ventilation from the Nordic Seas, we identify a ∼400-year lead of changes in high-latitude NADW formation ahead of abrupt climate changes recorded in Greenland ice cores at the onset and end of the Younger Dryas stadial, which likely occurred in response to gradual changes in temperature- and wind-driven freshwater transport. We suggest that variations in Nordic Seas deep-water circulation are precursors to abrupt climate changes and that future model studies should address this phasing.
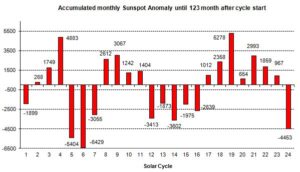
The sun was also very sub-normally active in February. Although we are in the middle of the minimum, the sunspot number of 0.8 for the 123rd month into the cycle is very low. On 26 days of the month no spots were visible, only on 2 days was there a little, symmetrically distributed over both solar hemispheres.The only exciting question currently: When will the minimum be finished and will solar cycle 25 begin? Although 6 spots of the new cycle were already visible in February with a significantly higher resolution, estimates are difficult.March again was dominated by some spots of the “old” SC24. The rule: “weaker cycles often last longer than stronger cycles” could hold.
…
Figure 2: The strength of the sunspot activity of each cycle in comparison. The numbers in the diagram are obtained by adding up the monthly deviations between the observed values and the mean value (blue in Fig.1) up to the current 123rd cycle month.
Figure 2 shows that five cycles (No. 8, 15, 16, 18, 22) did not have a month 123 at all. Instead the following cycle started. In this respect, the picture is now somewhat distorted towards the end of the cycle.
Paleontologists have found a fossil site in North Dakota that contains animals and plants killed and buried within an hour of the meteor impact that killed the dinosaurs 66 million years ago. This is the richest K-T boundary site ever found, incorporating insects, fish, mammals, dinosaurs and plants living at the end of the Cretaceous, mixed with tektites and rock created and scattered by the impact. The find shows that dinosaurs survived until the impact.
A sixth of all emissions resulting from the typical diet of an EU citizen can be directly linked to deforestation of tropical forests. Two new studies, from Chalmers University of Technology, Sweden, shed new light on this impact, by combining satellite imagery of the rainforest, global land use statistics and data of international trade patterns.
“In effect, you could say that the EU imports large amounts of deforestation every year. If the EU really wants to achieve its climate goals, it must set harder environmental demands on those who export food to the EU,” says Martin Persson from Chalmers, one of the researchers behind the studies.
The link between production of certain foods and deforestation has been known before. But what Martin Persson and Chalmers colleague Florence Pendrill have now investigated is the extent to which deforestation in the tropics is linked to food production, and then where those foods are eventually consumed. In the first study, they focused on how the expansion of cropland, pastures, and forestry plantations has taken place at the expense of the rainforest.
Emissions sources for deforestation-related carbon dioxide emissions are diverse and vary by region. Emissions embodied in production are shown for each commodity group within each region. A region’s width on the x-axis corresponds to the embodied emissions produced in that region, while the y-axis shows the share of emission attributed to each commodity group within each region, implying that the rectangles within the plot are scaled according to the emissions embodied in each region-commodity combination. The percentages within the rectangles indicate the share of the total embodied emissions; 2.6?gigatonnes of carbon dioxide due to tropical deforestation during the period 2010-2014.
Credit: Florence Pendrill, Chalmers University of Technology
…
La géologie, une science plus que passionnante … et diverse


