Developing nations latest decade of energy & emissions growth torpedoes alarmist global emissions control scam

by Larry Hamlin, July 23, 2019 in WUWT


The UN has been pursuing global emissions policy for decades that are intended to provide for the establishment of global government schemes allowing it to control world emissions.

No fewer than 24 United Nations Climate Change Conferences have been held at various global locations since 1995 under its Conference of the Parties (COP) legal framework.

COP 21 which occurred in November and December 2015 in Paris resulted in the creation of the Paris Agreement that supposedly established global agreement to reduce greenhouse gas emissions and limit future global temperatures that the UN based upon projections from climate models that grossly exaggerate the impact of greenhouse gases on world temperatures.

The UN IPCC acknowledged in its AR3 climate report in 2001 that it is not possible to develop computer models that are capable of predicting future global climate and yet the Paris Agreement based its emissions targets intended for the future using these flawed computer models.

Three additional UN climate conferences have occurred since the Paris Agreement with the last conference being in 2018 in Poland. No success has been achieved in these three conferences in devising specific commitments for emissions reductions targets for the world’s developing nations.

Additionally the U.S. under President Trump wisely withdrew from the Paris Agreement in June of 2017.

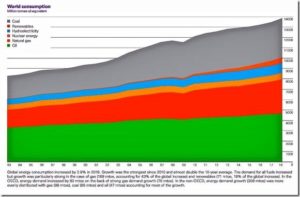
Global energy and emissions detailed information for 2018 is now available which includes data encompassing the latest decade of 2008 to 2018. The world energy consumption data from the report is summarized in the graph below.

This latest decade energy and emissions data clearly demonstrates that the developing nations completely dominate global energy and emissions. This includes both present levels as well as future growth. These results also show that the developed nations play a minority role in these measures both presently and in the future.

The results for the last decade show that global energy use grew by 18.5% during the last decade with 98.5% of that energy growth accounted for by the developing nations.

China Energy to expand ultra-low emission coal-fired power: executive

by Reuters, July 23, 2019 in WUWT


SANHE, China (Reuters) – China Energy Group, the country’s biggest power generator, will add more than 6 gigawatts (GW) of new ultra-low emission coal-fired capacity this year as it bids to meet growing electricity demand, a senior official with the firm said on Thursday.

The company also expected to build another 5 GW of low-emission capacity next year, Xiao Jianying, the head of the state-run firm’s coal-fired power department, told Reuters.

“China still has quite a big demand for electricity. The government now supports regions with poor wind and solar resources to use coal-fired power … it’s a more practical measure, as gas is still too expensive,” said Xiao.

China Energy operated coal-fired plants with a total capacity of 175 GW at the end of 2018, 77.4% of its total capacity and about 10% of the entire country’s capacity.

Xiao said the company would gradually shut down small and polluting coal-fired power units and replace them with efficient ones, noting that total capacity would continue to increase but at a slower rate of growth.

The firm is also planning to launch another carbon capture and storage (CCS) project in northwest China next year as part of its efforts to reduce the environmental impact of using coal, company officials said. It already runs a CCS plant at its coal-to-oil facility in Erdos in Inner Mongolia.

China, the world’s biggest greenhouse gas emitter, has vowed to control new coal production and new coal-fired power capacity as part of its commitments to curb pollution and tackle global warming. However, it has shown signs of relaxing restrictions in recent months amid an economic slowdown.

Thirty years of unique data reveal what’s really killing coral reefs

by P. Homewood, July 24, 201 in NotatLotofPeopleKnowThat


Coral reefs are considered one of the most threatened ecosystems on the planet and are dying at alarming rates around the world. Scientists attribute coral bleaching and ultimately massive coral death to a number of environmental stressors, in particular, warming water temperatures due to climate change.

A study published in the international journal Marine Biology, reveals what’s really killing coral reefs. With 30 years of unique data from Looe Key Reef in the lower Florida Keys, researchers from Florida Atlantic University’s Harbor Branch Oceanographic Institute and collaborators have discovered that the problem of coral bleaching is not just due to a warming planet, but also a planet that is simultaneously being enriched with reactive nitrogen from multiple sources.

Improperly treated sewage, fertilizers and top soil are elevating nitrogen levels, which are causing phosphorus starvation in the corals, reducing their temperature threshold for “bleaching.” These coral reefs were dying off long before they were impacted by rising water temperatures. This study represents the longest record of reactive nutrients and algae concentrations for coral reefs anywhere in the world.

“Our results provide compelling evidence that nitrogen loading from the Florida Keys and greater Everglades ecosystem caused by humans, rather than warming temperatures, is the primary driver of coral reef degradation at Looe Key Sanctuary Preservation Area during our long-term study,” said Brian Lapointe, Ph.D., senior author and a research professor at FAU’s Harbor Branch.


https://phys.org/news/2019-07-years-unique-reveal-coral-reefs.html


There is the usual armwaving about climate change, but no evidence is presented as to why a small increase in CO2 levels should have the slightest effect on water temperatures or coral development, when the climate has been much warmer for most of the period since the end of the ice age.

As is usually the case with environmental degradation and species decline, it is the obvious factors which are responsible.

1980s Science: Ice Cores Show CO2 Naturally Rose 200 ppm (65 ppm/100 Years) During The Early Holocene

by K. Richard, July 22, 2019 in NoTricksZone


A few decades ago it was “consensus” science that CO2 levels had reached 400 ppm (and even up to 500 ppm) during the Early Holocene, with rising amplitudes of greater than 200 ppm and rates of 65 ppm in less than a century. Then the “consensus” opinion changed.

In 1982 it was still quite acceptable for Dr. Flohn, a climate scientist, to acknowledge that changes in CO2 concentration changes are significantly determined by temperature “rather independent of” fossil fuel emissions, but also that Holocene CO2 concentrations reached 350 to 400 ppm between 8,000 to 6,000 years ago (Flohn, 1982).

Why the discrepancy between “consensus” CO2 and historically recorded CO2?

Polish physicist Dr. Zbigniew Jaworowski (1997) was a fierce critic of the means by which ice core data have been collected to assign CO2 concentration values to past epochs.

His criticisms center around the post-1985 tendencies for fellow scientists to openly employ selection bias in making pre-determined decisions about what measurements are “right” and which ones are “wrong” – effectively rendering their results meaningless.

He cites Pearlman et al. (1986), for example. These authors collected 74 Antarctic ice core CO2 samples. Of those, 32 (43%) were rejected because they had values that were too high or too low to match with the agreed-upon pre-determination.

In what other branch of science is it acceptable to discard measured data we don’t agree with?


New York Heatwaves Like This Week’s Are The Norm

by P. Homewood, July 22, 2019 in NotaLotofPeopleKnowThat


Extremely hot weather has started to hit most of the United States, with temperatures set to peak over the weekend, meteorologists say.

The heatwave could affect about 200 million people in major cities like New York, Washington and Boston in the East Coast, and the Midwest region too.

In some places, temperatures could be close to or exceed 100F (38C). Parts of Canada are also being hit.

Experts link more frequent heatwaves in recent years to climate change.

The world experienced its hottest June on record this year, with an average temperature worldwide of 61.6F (16.4C), according to new data.

Earlier this month, the US state of Alaska, part of which lies inside the Arctic Circle, registered record high temperatures.

https://www.bbc.co.uk/news/world-us-canada-49049378


As I revealed last week, the Alaska claim was fake.

But what about this latest heatwave? Is it anything unusual?

Well not in New York, that’s for sure.

The temperature in Central Park never even got near 100F, peaking at 95F yesterday.


http://climod2.nrcc.cornell.edu/

RUSSIA BREAKS MORE ALL-TIME LOW TEMPERATURE RECORDS, INCLUDING ONE FROM 1893

by Cap Allon, July 19, 2019 in Electroverse


On the back of Russia’s horde of new record low temperatures set on July 12, a bucket-load more were set over the following few days, busting records that had previously stood for well over 100 years.

The mercury across the majority of Europe has remained well-below average during the month of July as a string of Arctic blasts continue to delay the start of the continent’s summer. Large regions are seeing temperature departures of up to 20C below average, sending all-time cold records tumbling.

 …

And now Russia has 7 more daily records to add to the ever-expanding list (data courtesy of www.hmn.ru):

  • Sortavala recorded 3.8C (38.8F) — busting the previous record of 4.2C (39.6F) set in 1971.
  • Vytegra’s 0C (32F) beat the previous record of 1.5C (34.7F) from way back in 1893.
  • Vyborg observed 6.7C (44F) surpassing the 7C (44.6F) set in 1978 (solar minimum of cycle 20).
  • Roslavl’s 7C (44.6F) beat out the 7.9C (46.2F) from 1935 (solar minimum of cycle 15).
  • Cherepovets4.1C (39.4F) busted the 4.8C (40.6F) set in 1995 (solar minimum of cycle 22)
  • Rybinsk registered 7.2C (45F) smashing the previous record low of 9.9C (49.8F) from 1977 (solar minimum of cycle 20).

While Kostroma’s 5.7C (42.3F) beat 1948’s record of 6.9C (44.4F).

Global energy demand to double by 2050

by Olbrew, July 20, 2019 in Tallbloke’sTalkshop


While many richer countries play fake climate games with their so-called ‘virtue signalling’ energy policies, the not-so-well-off majority try to get more access to those same power sources which are so necessary for better living conditions, e.g. air conditioning in hotter countries, and for general prosperity and health: more schools, hospitals, roads and all the rest.

Global power consumption will more than double over the next 30 years, says The Global Warming Policy Forum (GWPF).

Global oil and gas demand will respectively surge 22% and 66% from 2020 to 2050. There’s an unimaginable urbanization boom occurring around the world that means more energy use.

We, of course, don’t see much of it here in the West, but global cities swell in population by some 80 million people every year: e.g., the rise of the “megacity” with 10 million residents.

Basically all population growth in the decades ahead will take place in urban areas, all of which will be in the still developing nations (non-OECD), where poverty and insufficient access to energy is far more rampant than our worst nightmares could ever imagine.

What’s really killing the Coral Reefs?

by Carly Cassella, July 20, 2019 in WUWT


Coral reefs are one of the most threatened ecosystems on our planet, and in the past two decades alone, half of the coral in Florida has died off completely. Global warming is known to be a deadly factor, but rising ocean temperatures are only part of the story.

Thirty years of research in the Looe Key Sanctuary Preservation Area (LKSPA) on the southern tip of the Florida Keys has now revealed the cost of a devastating threat to coral that rivals even climate change: direct human pollution.

For years, agricultural run-off and improperly treated sewage have flowed into Florida’s ocean waters from the northern Everglades, elevating the sanctuary’s nitrogen levels and lowering the reef’s temperature threshold for bleaching, researchers say.

As a result of this deadly combination, coral cover in the region has declined from nearly 33 percent in 1984 to less than 6 percent in 2008.

In their analysis, the authors found that three mass bleaching events that occurred during these years only happened after heavy rainfall and increased land-based runoffs. In other words, if we can reduce the amount of local pollution that makes its way into our oceans, we might be able to reduce the worst of the damage.

Klein & Orlando, Bulletin of Marine Science, 1994

Geoscientists discover mechanisms controlling Greenland ice sheet collapse

by University of South Florida (USF Innovation), July 19, 2019 in ScienceDaily/Nature


Greenland’s more than 860,000 square miles are largely covered with ice and glaciers, and its melting fuels as much as one-third of the sea level rise in Florida. That’s why a team of University of South Florida geoscientists’ new discovery of one of the mechanisms that allows Greenland’s glaciers to collapse into the sea has special significance for the Sunshine State.

New radar technology allowed geoscientists to look at Greenland’s dynamic ice-ocean interface that drives sea level rise.

Earlier this spring, NASA scientists reported Jakobshavn Glacier, which has been Greenland’s fastest -thinning glacier for the last 20 years, was slowing in its movement toward the ocean in what appears to be a cyclical pattern of warming and cooling. But because Jakobshavn is still giving up more ice than it accumulates each year, its sheer size makes it an important factor in sea level rise, the NASA scientists maintain.

“Our study helps understand the calving process,” Dixon said. “We are the first to discover that mélange isn’t just some random pile of icebergs in front of the glacier. A mélange wedge can occasionally ‘hold the door’ and keep the glacier from calving.”

Journal Reference:

  1. Surui Xie, Timothy H. Dixon, David M. Holland, Denis Voytenko, Irena Vaňkov�. Rapid iceberg calving following removal of tightly packed pro-glacial mélange. Nature Communications, 2019; 10 (1) DOI: 10.1038/s41467-019-10908-4

LE PEER-REVIEW, IRREPROCHABLE ?

by Jo Moreau, 17 juillet 2019 in Belgotopia


Quel est le principe de fonctionnement du « peer review », ou révision par les pairs 

Nous avons déjà pu apprécier à quel point la publication d’un article dans une revue scientifique pratiquant le « peer review » constitue pour certains le sommet, et même la condition sine qua non pour se voir accorder l’autorisation d’émettre un avis sur un sujet donné (dans notre cas : le réchauffement, pardon, les changements climatiques).

L’exemple le plus récent est illustré par la position d’un réseau social bien connu qui émet un avis à la limite calomnieux à l’égard d’un physicien par ailleurs professeur d’université, qui a fait l’objet de mon article précédent : https://belgotopia.com/2019/07/15/menaces-ouvertes-sur-les-ecrits-giecosceptiques/

Comment cela fonctionne-t-il ? Le scientifique (ou le groupe de scientifiques) soumet son étude à l’éditeur de la revue qu‘il aura choisie (ou à plusieurs d‘entre eux). Il s’agit souvent du premier filtre, l’éditeur jugeant si l’étude est ou non conforme à la ligne éditoriale de la revue. Le physicien Edwin BERRY vient encore d’en faire l’expérience. Son étude « Le CO2 d’origine humaine a peu d’effet sur le CO2 présent dans l’atmosphère » a été refusée par l’American Journal of Climate Change sous le seul et unique motif que « La conclusion de cet article est complètement opposée au consensus de la communauté universitaire ». Evidemment, le fait que Ed BERRY soit un GIECosceptique affirmé n’aura pas favorisé sa démarche …

2019 Climate “Ship Of Fools” Runs Into 3-Meter Thick Ice… Baffin Inlets Mid Summer Ice Extent No Trend in 50 Years

by P. Gosselin, July 19, 2019 in NoTricksZone


Our German skeptic friend Snowfan here keeps us up to date on the latest ODEN “Ship of Fools” attempt to travel across an Arctic that is supposed to be ice-free by now.

The incentive to cross the Arctic passages in the summer is huge. Doing so would mean at least a week of fame with the media blaring out your name along with grossly hyped headlines of an Arctic ice meltdown due to global warming. One of these years, a ship might get lucky and manage to get through the Northwest Passage.

Also defying the models is the extent of ice cover for July 9 at the Baffin inlets Regent – Boothia. Over the last 50 years, there’s been little trend change:


Source: Canadian Ice Service

EU energy portfolio attracts member states’ attention

by Euractiv Network, July 19, 2019


The Capitals brings you the latest news from across Europe, through on-the-ground reporting by EURACTIV’s media network. You can subscribe to the newsletter here.

///

The Polish government has said ensuring a “good post” in the next European Commission was a precondition to support Ursula von der Leyen to become the EU executive’s chief, according to deputy Prime MinisterJacek Sasin and government spokesman Piotr Müller.

EURACTIV Poland has been reporting for several weeks that Warsaw may be interested in a post related to energy issues, and Sasin confirmed the government’s aspirations for the energy post in an interview with TVN24.

Read also:

At the beginning of June, WysokieNapiecie.pl, a website which covers energy issues, revealed that Competition Commissioner Margrethe Vestager and liberal spitzenkandidat offered the Polish government the post of commissioner for energy in return for support in her fight for the top EU job. The only condition was to find a woman.

The name of Poland’s minister for technology and entrepreneurship Jadwiga Emilewicz, who is sceptical towards coal, has repeatedly popped up.

Vestager is now out of the race but things have not changed much: Polish government officials are touting Emilewicz and demanding the energy portfolio, and Vestager will remain in the Commission as a vice-president, which may give her power to influence the composition of the new executive.

In an interview with EURACTIV.com earlier this week, Foreign Minister Jacek Czaputowicz said Poland was looking for an “economic” post. “We know how to do it, we are developing quickly, and we have one of the highest paces of economic development.

Strong storms also play big role in Antarctic ice shelf collapse

by Oregon State University, July 18, 2019 in ScienceDaily


Warming temperatures and changes in ocean circulation and salinity are driving the breakup of ice sheets in Antarctica, but a new study suggests that intense storms may help push the system over the edge.

A research team led by U.S. and Korean scientists deployed three moorings with hydrophones attached seaward of the Nansen Ice Shelf in Antarctica’s Ross Sea in December of 2015, and were able to record hundreds of short-duration, broadband signals indicating the fracturing of the ice shelf.

The “icequakes” primarily took place between January and March of 2016, with the front of the ice sheet calving into two giant icebergs on April 7. The day the icebergs drifted away from the shelf coincided with the largest low-pressure storm system the region had recorded in the previous seven months, the researchers say.

Results of the study are being published this week in Frontiers in Earth Science.

Journal Reference:

  1. R. P. Dziak, W. S. Lee, J. H. Haxel, H. Matsumoto, G. Tepp, T.-K. Lau, L. Roche, S. Yun, C.-K. Lee, J. Lee, S.-T. Yoon. Hydroacoustic, Meteorologic and Seismic Observations of the 2016 Nansen Ice Shelf Calving Event and Iceberg Formation. Frontiers in Earth Science, 2019; 7 DOI: 10.3389/feart.2019.00183

La croissance du CO2 dans l’atmosphère est-elle exclusivement anthropique? (3/3)

by J.C. Maurin, 19 juillet 2019 in ScienceClimatEnergie


Effet Bombe et Modèles du GIEC

Les prévisions du climat sont générées par des modèles informatiques. Leurs concepteurs pensent pouvoir décrire l’état moyen de l’atmosphère en 2100, en prenant comme principale donnée d’entrée, le taux futur de CO2 qui constituerait donc le ‘bouton de commande’ du climat.

Il y a deux étages de modélisation : on commence par prévoir le taux de CO2 en 2100 avec des modèles sélectionnés par le GIEC (ces modèles « IRF » du GIEC sont l’objet de l’article).
Cette prévision constitue ensuite l’entrée du second étage, à savoir les modèles types « échanges radiatifs » ou « effet de serre » qui ne sont pas traités ici (mais on peut consulter ceci).
Le présent article ( qui est la suite de deux autres ici et ici) compare la réponse impulsionnelle théorique de ces modèles « IRF » avec la réponse impulsionnelle observée du 14CO2(effet Bombe).

Study: Pacific Islands Will Survive Climate Change

by Eric Worrall, July 17, 2019 in WUWT


Who could have imagined that islands which survived rapid sea level rise at the end of the last ice age have no problem coping with changes in sea level?

Media Release
From: University of Auckland

Pacific atolls can adapt to rising seas and extreme storms – new study

Low-lying Pacific islands in atoll archipelagos such as Tuvalu, Tokelau and Kiribati are likely to adapt to the effects of climate change rather than simply sink beneath the waves, a new study shows.

Tuvalu, Tokelau and Kiribati are widely considered under threat from rising seas and severe storms due to climate change with their residents becoming ‘climate refugees’.

Researchers from the University of Auckland’s School of Environment recreated a scale model of tiny Fatato Island on the southeast rim of Funafuti Atoll in Tuvalu to test the ability of the real island to withstand predicted climate affects.

The study simulated higher sea levels and storm-generated waves up to 4m in a 20m-long water chute or ‘flume’ to replicate real-world sea levels of 0.5m and 1m in a purpose built laboratory at the University of Plymouth in the United Kingdom.

A beach at Funafuti atoll, Tuvalu, on a sunny day. Author Stefan Lins, source Wikimedia

The Response of Grape Plantlets to CO2 Enrichment

by Zhao et al., 2019 in BMCPlantBiology/CO2Science


Recognizing that increasing atmospheric CO2 concentrations promotes plant development and growth, Zhao et al. set out to investigate the effect of elevated CO2 on a key wine grape variety, Pinot Noir.

Their experiment was conducted in controlled climate chambers at the Fruit Tree Physiology and Biotechnology Laboratory, College of Horticulture, Gansu Agricultural University, China. Grape plantlets (Vitis vinifera, cv. Pinot Noir) were propagated and then cultured in a 2% sucrose solution at either ambient (380 ppm) or elevated (1,000 ppm) CO2 concentrations for a period of 25 days. At the end of the experiment the authors examined the impact of CO2 on various growth-related parameters, while also conducting transcriptomic and proteomic analyses.

Results indicated that elevated CO2 stimulated total plant dry weight, leaf area and plant height by 125%, 96% and 31%, respectively (see Figure 1). Photosynthetic parameters also revealed a CO2-induced stimulation and the various physiological changes were found to be related to differentially expressed genes and proteins among the plants growing in the two environments. Such findings suggest Pinot Noir may well be a “winner” (in terms of growth and development) among plants in the future if the air’s CO2 content continues to rise.

Figure 1. Visual display of the growth differences between grapes grown under ambient (380 ppm) or elevated (1,000 ppm) CO2 concentrations for 25 days. The average dry weight of the grapes growing under elevated CO2 was 125% greater than those growing under ambient CO2. Source: Zhao et al. (2019).

New Study Reveals True Cause Of Coral Bleaching (And It’s Not Global Warming)

by Brook Hays, July 16, 2019 in ClimateChangeDispatch


Corals are disappearing across the world’s oceans, and most scientists have pointed to warming water temperatures — the result of climate change — as the primary driver.

But new research suggests nitrogen pollution is the main cause of coral bleaching in Florida.

The study, published this week in the journal Marine Biology, was compiled using the three-decades worth of observational data collected at the Looe Key Reef in the lower Florida Keys.

“Our results provide compelling evidence that nitrogen loading from the Florida Keys and greater Everglades ecosystem caused by humans, rather than warming temperatures, is the primary driver of coral reef degradation at Looe Key Sanctuary Preservation Area,” lead study author Brian Lapointe, research professor at Florida Atlantic University’s Harbor Branch Oceanographic Institute, said in a news release.

Data collected at the test site showed nutrient runoff has boosted the nitrogen-phosphorus ratio in reef algae.

As more and more treated sewage and fertilizers from commercial farms rinse into local waterways and flood the oceans with nutrients, including reactive nitrogen, corals are unable to absorb sufficient levels of phosphorous.

“Our results provide compelling evidence that nitrogen loading from the Florida Keys and greater Everglades ecosystem caused by humans, rather than warming temperatures, is the primary driver of coral reef degradation at Looe Key Sanctuary Preservation Area,” lead study author Brian Lapointe, research professor at Florida Atlantic University’s Harbor Branch Oceanographic Institute, said in a news release.

10 fallacies about Arctic sea ice & polar bear survival: teachers & parents take note

by S. Crockford, July 15, 2019, in WUWT/PolarBearScience


Summer sea ice loss is finally ramping up: first year is disappearing, as it has done every year since ice came to the Arctic millions of years ago. But critical misconceptions, fallacies, and disinformation abound regarding Arctic sea ice and polar bear survival. Ahead of Arctic Sea Ice Day (15 July), here are 10 fallacies that teachers and parents especially need to know about.

As always, please contact me if you would like to examine any of the references included in this post. These references are what make my efforts different from the activist organization Polar Bears International. PBI virtually never provide references within the content it provides, including material it presents as ‘educational’. Links to previous posts of mine that provide expanded explanations, images, and additional references are provided.

The cartoon above was done by Josh: you can drop off the price of a beer (or more) for his efforts here.


NO EXPERIMENTAL EVIDENCE FOR THE SIGNIFICANT ANTHROPOGENIC CLIMATE CHANGE

by J. Kauppinen and P. Malmi, July 13, 2019 in Physics.gen-ph


Abstract. In this paper we wil lprove that GCM-models used inI IPCC report AR5 fail to calculate the influences of the low cloud cover changes on the global temperature. That is why those models give a very small natural temperature change leaving a very large change for the contribution of the green house gases in the observed temperature. This is the reason why IPCC has to use a very large sensitivity to compensate a too small natural component. Further they have to leave out the strong negative feedback due to the clouds in order to magnify the sensitivity. In addition, this paper proves that the changes in the low cloud cover fraction practically control the global temperature.

1. Introduction

The climate sensitivity has an extremely large uncertainty in the scientific lit- erature. The smallest values estimated are very close to zero while the highest ones are even 9 degrees Celsius for a doubling of CO2. The majority of the papers are using theoretical general circulation models (GCM) for the estimation. These models give very big sensitivities with a very large uncertainty range. Typically sensitivity values are between 2–5 degrees. IPCC uses these papers to estimate the global temperature anomalies and the climate sensitivity. However, there are a lot of papers, where sensitivities lower than one degree are estimated without using GCM. The basic problem is still a missing experimental evidence of the cli- mate sensitivity. One of the authors (JK) worked as an expert reviewer of IPCC AR5 report. One of his comments concerned the missing experimental evidence for the very large sensitivity presented in the report [1]. As a response to the com- ment IPCC claims that an observational evidence exists for example in Technical Summary of the report. In this paper we will study the case carefully.

2. Low cloud cover controls practically the global temperature

Antarctica was warmer one thousand years ago — and life was OK

JoNova, July 11, 2019


Remember when polar amplification was the rage? So much for that theory

Antarctica is twice the size of the US or Australia. Buried 2 km deep under domes of snow, it holds 58 meters of global sea level to ransom. The IPCC have been predicting its demise-by-climate-change for a decade or two.

A new paper looks at 60 sites across Antarctica, considering everything from ice, lake and marine cores to peat and seal skins. They were particularly interested in the Medieval Warm Period, and researched back to 600AD.  During medieval times (1000-1200 AD) they estimate Antarctica as a whole was hotter than it is today.  Antarctica was even warmer still  — during the dark ages circa 700AD.

Credit to the paper authors: Sebastian Lüning, Mariusz Gałka, and Fritz Vahrenholt

Feast your eyes on the decidedly not unprecedented modern tiny spike:

The little jaggy down after 2000 AD is real. While there was rapid warming across Antarctica from 1950-2000, in the last twenty years, that warming has stalled. Just another 14 million square kilometers that the models didn’t predict.

We already knew the Medieval Warm Period was a global phenomenon, thanks to hundreds of proxies, and 6,000 boreholes. But this new paper is a great addition.

With an awesome dedication to detail, the team put all the big oceanic and other factors into one big graph. It is nice to see them side by side so we can see the connections between them.

Energy Dominance: US Crude Oil Production Tops 12 Million Barrels per Day in April!

by David Middleton, July 15, 2019 in WUWT


JULY 8, 2019
U.S. crude oil production surpassed 12 million barrels per day in April

U.S. crude oil production and lease condensate reached another milestone in April 2019, totaling 12.2 million barrels per day (b/d), according to EIA’s latest Petroleum Supply Monthly. April 2019 marks the first time that monthly U.S. crude oil production levels surpassed 12 million b/d, and this milestone comes less than a year after U.S. crude oil production surpassed 11 million b/d in August 2018.

Texas and the Federal Offshore Gulf of Mexico (GOM), the two largest crude oil production areas in the United States, both reached record levels of production in April at 4.97 million b/d and 1.98 million b/d, respectively. Oklahoma also reached a record production level of 617,000 b/d.

The U.S. onshore crude oil production increase is driven mainly by developing low permeability (tight) formations using horizontal drilling and hydraulic fracturing. EIA estimates that crude oil production from tight formations in April 2019 reached 7.4 million b/d, or 61% of the U.S. total.

Study: Clouds, Solar Cycles Play Major Role In Climate Change

by  G. Lloyd, July 15, 2010 in ClimateChangeDispatch


Sand deposits near the Gobi Desert in China may seem a strange place to look for evidence that cosmic rays can control how clouds are formed and the impact they have on Earth’s climate.

But Japanese scientists have measured the size of sand grains and the distance they traveled 780,000 years ago to add a new level of understanding to one of the questions that continue to baffle climate science: clouds.

The findings, published in Nature, point to big trends in natural variation of past and future climate that operate apart from greenhouse gas levels.

The study adds weight to a contentious theory by Danish researcher Henrik Svensmark, of the Danish National Space Institute in Copenhagen, which uses cosmic rays and clouds to question the sensitivity of climate to carbon dioxide in the atmosphere.

Red Sea Temperature Record Shows It Follows The AMO, Not CO2 … “Natural Climate Oscillations”

by P. Gosselin, July 7, 2019 in NoTricksZone


AMO cycle on the downward side: Red Sea to cool in the coming decades

By Die kalte Sonne
(German text translated by P Gosselin)

Seven years ago, in our book “The Forgotten Sun”, we proposed using ocean cycles for medium-term forecasts. At the time, the climate establishment was strictly opposed to this. Today fortunately times have changed.

On March 15, 2019, a team led by George Krokos analyzed the temperature development of the Red Sea in Geophysical Research Letters, which has become noticeably warmer in recent decades. The researchers put this into a long-term context and found a strong correlation with the 70-year ocean cycle of the AMO (Atlantic Multidecade Oscillation).

Now that AMO has reached its peak, Krokos and colleagues expect the Red Sea to cool in the next three decades.

Abstract:

Natural Climate Oscillations may Counteract Red Sea Warming Over the Coming Decades
Recent reports of warming trends in the Red Sea raise concerns about the response of the basin’s fragile ecosystem under an increasingly warming climate. Using a variety of available Sea Surface Temperature (SST) data sets, we investigate the evolution of Red Sea SST in relation to natural climate variability. Analysis of long‐term SST data sets reveals a sequence of alternating positive and negative trends, with similar amplitudes and a periodicity of nearly 70 years associated with the Atlantic Multidecadal Oscillation. High warming rates reported recently appear to be a combined effect of global warming and a positive phase of natural SST oscillations. Over the next decades, the SST trend in the Red Sea purely related to global warming is expected to be counteracted by the cooling Atlantic Multidecadal Oscillation phase. Regardless of the current positive trends, projections incorporating long‐term natural oscillations suggest a possible decreasing effect on SST in the near future.

La géologie, une science plus que passionnante … et diverse