While Brazil has elected a climate sceptical president, Germany’s ‘climate chancellor’ Angela Merkel has announced that she is gradually stepping down from her political roles. Green news outlets are voicing concern that these and other developments in the Western world are putting the Paris agreement and the entire climate agenda at risk of falling apart.
by P. Homewood, October 31, 2018 in NotaLotofPeopleKnowThat
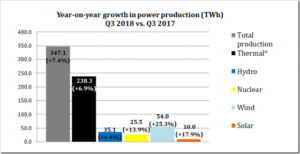
China’s power statistics have now been published for Q3, and continue to show thermal generation rising quickly. (Thermal includes coal, gas and biomass).
The rise in thermal generation since last year is more than from all other sources put together.
Biomass is virtually irrelevant in the overall view of things, having only accounted for 1.2% of generation last year.
Once again, we see that China’s unstoppable demand for energy cannot be supplied from wind and solar alone. Indeed. these two sources have only contributed 18% of the extra year-on-year demand.
In overall terms, wind and solar have only supplied 4.6% and 1.3% respectively of China’s generation so far this year.
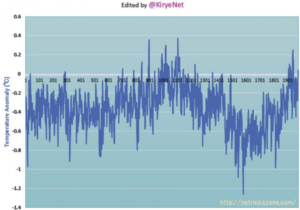
This post is a coarse screening assessment of HadCRUT4 global temperature anomalies to determine the impact, if any, of data quality and data coverage. There has been much discussion on WUWT about the quality of the Hadley temperature anomaly dataset since McLean’s Audit of the HadCRUT4Global Temperature publication which is paywalled. I purchased a copy to see what all the hub-bub was about, and it is well worth the $8 in my view. Anthony Watts’ review of McLean’s findings and executive summary can be found here.
A key chart for critical study is McLean’s Figure 4.11 in his report. McLean suggests that HadCRUT4 data prior to 1950 is unreliable due to inadequate global coverage and high month-to-month temperature variability. For this post, I subdivided McLean’s findings into three groups shown with added shading: Good data which covers the years post-1950. During this period global data coverage is excellent at greater than 75% and month-to-month temperature variation is low. Questionable data occurs from 1880 to 1950. During this period global data coverage ranged from 40% to 70% with higher monthly temperature variations. Poor data is pre-1880 when global coverage ranged from 14 to 25% with extreme monthly temperature variations.
Only sixteen countries out of the 197 that have signed the Paris Agreement have defined national climate action plan ambitious enough to meet their pledges, according to a policy brief released on Monday (29 October), ahead of the crucial UN climate conference COP24 in Katowice (Poland) in December.
The 16 countries are: Algeria, Canada, Costa Rica, Ethiopia, Guatemala, Indonesia, Japan, FYR Macedonia, Malaysia, Montenegro, Norway, Papua New Guinea, Peru, Samoa, Singapore and Tonga.
by J. Delingpole, October 30, 2018 in ClimateChangeDispatch
Another global warming scare story bites the dust: fragile islands and atolls in the Pacific are not sinking beneath the waves because of global warming. In fact, they are doing just fine.
The bad news (only bad for alarmists, of course) comes in a study by Virginie Duvat of the University of La Rochelle-CNRS, France, titled ‘A global assessment of atoll island planform changes over the past decades’.
It surveyed 30 Pacific and Indian Ocean atolls, including 709 islands, and found that 90 percent have either remained stable or have grown in the last few decades.
The Cretaceous Period was “3-10°C hotter than preindustrial levels” for TENS OF MILLIONS OF YEARS! Even if the models were right, 3 °C of warming over 100 years is not comparable to tens of millions of years of 3-10 °C hotter average global surface temperatures.
The Cretaceous Period was much warmer than the Miocene Epoch.
The IPCC appears to have secretly changed the definition of what constitutes ‘climate’ by mixing existing and non-existing data
The definition of ‘climate’ adopted by the World Meteorological Organisation is the average of a particular weather parameter over 30 years. It was introduced at the 1934 Wiesbaden conference of the International Meteorological Organisation (WMO’s precursor) because data sets were only held to be reliable after 1900, so 1901 – 1930 was used as an initial basis for assessing climate. It has a certain arbitrariness, it could have been 25 years.
For its recent 1.5°C report the IPCC has changed the definition of climate to what has been loosely called “the climate we are in.” It still uses 30 years for its estimate of global warming and hence climate – but now it is the 30 years centred on the present.
Le physicien Jacques Duran, fondateur du célèbre site Pensée Unique et pionnier du climato-réalisme en France, est décédé ce vendredi 26 octobre 2018.
Son site internet est toujours online. Si vous ne le connaissez pas, allez vite le voir. Copiez le et diffusez le. Il est vraiment Unique! Il est abondamment documenté et illustré, et représente une véritable mine de connaissances sur le climat. Son site, créé en 2006 sous le pseudonyme de Jean Martin, est dédié à tous ceux qui ont conservé un esprit critique et qui se refusent à absorber sans réfléchir une grande partie des nouvelles de toutes sortes qui nous parviennent chaque jour.
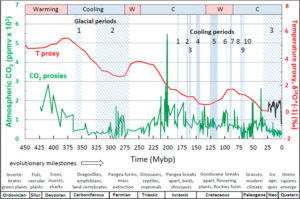
Davis, W.J. 2017. The relationship between atmospheric carbon dioxide concentration and global temperature for the last 425 million years. Climate5: 76; doi: 10.3390/cli5040076.
Writing by way of introduction to his work, Davis (2017) notes that “a central question for contemporary climate policy is how much of the observed global warming is attributable to the accumulation of atmospheric CO2 and other trace greenhouse gases emitted by human activities.” If you talk to a climate alarmist, the answer you receive from such an inquiry will likely be “almost all.” A climate skeptic, on the other hand, will likely respond that the answer is “likely none.”
Hoping to provide some crucial information on this topic, Davis analyzed the relationship between historic temperature and atmospheric CO2 using the most comprehensive assemblage of empirical databases of these two variables available for the Phanerozoic period (522 to 0 million years before present; Mybp). In all, 6680 proxy temperature and 831 proxy CO2 measurements were utilized, enabling what Davis described as “the most accurate quantitative empirical evaluation to date of the relationship between atmospheric CO2concentration and temperature.” Multiple statistical procedures and analyses were applied to the proxy records and the resultant relationship is depicted in the figure below.
by Tony Heller, October 26, 2018 in ClimateChangeDispatch
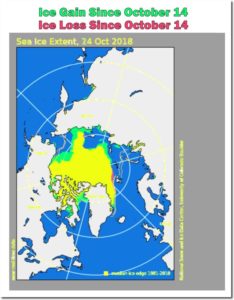
Arctic sea ice is growing very rapidly. At current rates of ice growth, the entire planet will be covered with ice right around the time Ruth Bader Ginsburg retires.
By Dr. Sebastian Lüning and Prof. Fritz Vahrenholt
(Text translated by P Gosselin)
The hockey stick controversy over a temperature reconstruction of the past 2000 years represents an important stage in the climate debate. At around the turn of the millennium, the authors of the “hockey stick chart” suggested that the pre-industrial climate was monotonous and uneventful. The Medieval Warm Period and Little Ice Age described in many parts of the world climatically must have been very similar. But that’s hard to understand if you look at the wide variety of case studies.
Cover-up absurdity, then forced to correct
Later, the authors improved and presented a corrected version, which again showed stronger climatic fluctuations. Quite a science story. You can read about it here.
In addition to this scientific rush job, the debate about the hockey stick also showed that climate data really must be made publicly available. This is all the more important if the science is used for far-reaching policies. Data and results obtained thereof must be verifiable. At the time no one wanted the data to be released. Today in retrospect that was quite an absurdity — similar to smoking in a large open office.
by Robert P. Murphy, October 22, 2018 in The IndependantInstitute/FEE
…
Conclusion
…
First, Nordhaus shows that aggressive mitigation policies can be a cure worse than the disease, and he specifically includes the United Nation’s latest goal in his examples of such misguided goals. Second, Nordhaus’s estimate of the optimal carbon tax (for the year 2025, for example) has almost tripled in less than a decade. Third, far from being tied to specific analyses of particular threats, Nordhaus’s global damage estimate was largely driven by a simple survey of experts, and this figure was furthermore manipulated arbitrarily by Nordhaus in light of new developments. The public would be very surprised to learn just how crude the “settled science” underlying various proposals to limit climate change really is.
Ten years ago, polar bears were classified as an endangered species due to model-based assumptions that said the recession of Arctic sea ice would hamper the bears’ seal-hunting capabilities and ultimately lead to starvation and extinction.
The Inuit, who have observed these bears catch seals in open water for generations, disagree. At least this is what scientists have found upon investigation.
“There is no evidence that the fast reduction of sea-ice habitat in the area has yet led to a reduction in population size.” (Aars et al., 2017 )
Inuit observations: “… back in early 80s, and mid 90s, there were hardly any bears … there’s too many polar bears now. Bears can catch seals even—even if the—if the ice is really thin … they’re great hunters those bears … they’re really smart … they know how to survive.” (Wong et al., 2017)
Here, for the first time in public, is Javier’s entire collection of massive, “consensus” climate science prediction failures. This collection is carefully selected from only academics or high-ranking officials, as reported in the press or scientific journals. Rather than being exhaustive, this is a list of fully referenced arguments that shows that consensus climate science usually gets things wrong, and thus their predictions cannot be trusted.
To qualify for this list, the prediction must have failed. Alternatively, it is also considered a failure when so much of the allowed time has passed that a drastic and improbable change in the rate of change is required for it to be true. Also, we include a prediction when observations are going in the opposite way. Finally, it also qualifies when one thing and the opposite are both predicted.
A novelty is that I also add a part B that includes obvious predictions that consensus climate science did not make. In science you are also wrong if you fail to predict the obvious.
The PAGES (2017) North American network consists entirely of tree rings. Climate Audit readers will recall the unique role of North American stripbark bristlecone chronologies in Mann et al 1998 and Mann et al 2008 (and in the majority of IPCC multiproxy reconstructions). In today’s post, I’ll parse the PAGES2K North American tree ring networks in both PAGES (2013) and PAGES (2017) from two aspects:
…
Conclusions
ex post screening based on recent proxy trends necessarily biases the resulting data towards a Hockey Stick shape – a criticism made over and over here and at other “ske;ptic” blogs, but not understood by Michael (“I am not a statistician”) Mann and the IPCC paleoclimate “community”;
the PAGES 2017 North American tree ring network has been severely screened ex post from a much larger candidate population: over the years, approximately 983 different North American tree ring chronologies have been used in MBH98, Mann et al 2008, PAGES 2013 or PAGES 2017. I.e. only ~15% of the underlying population was selected ex post – a procedure which, even with random data, would impart Hockey Stick-ness to any resulting composite
despite this severe ex post screening (in both PAGES 2013 and PAGES 2017), the composite of all data other than stripbark bristlecones had no noticeable Hockey Stick-ness and does not resemble a temperature proxy.
Nuclear technology is a major base-load power-generating source and accounted for 10.5% of global power generation in 2017 as per GlobalData, a leading data and analytics company.
The nuclear power sector is growing in many countries as demand for electricity increases. The company’s latest report ‘Nuclear Power – Thematic Report’ reveals that some 31 countries are currently operating nuclear reactors for their electricity generation. Countries with significant nuclear power capacity are the US, France, Japan, China, Russia, South Korea, Canada, and Ukraine, with more than ten gigawatts (GW) installed capacity each. Germany, the UK, Sweden, India, Spain, Belgium, and Taiwan have five to ten GW installed nuclear power capacity each.
The global cumulative installed nuclear power capacity in 2010 was 376GW, of which more than 100GW was in the US alone.
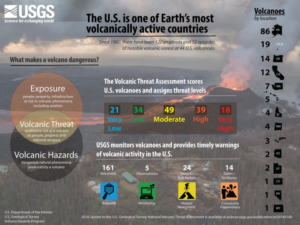
The United States has 161 young, active volcanoes within its borders. Since 1980, there have been 120 eruptions and 52 episodes of notable volcanic unrest at 44 U.S. volcanoes.
The U.S. Geological Survey systematically assesses U.S. volcanoes considered to be active or potentially active, and publishes a volcanic threat assessment that ranks the volcanoes based on 24 hazard and exposure factors. Last published in 2005, this 2018 update considers (1) field and laboratory research that adds or removes volcanoes from the list of potentially active volcanoes, and (2) updates the hazard and exposure factors used to produce a relative threat ranking of volcanoes.
Dr. Fukai also points out that global vegetation coverage increased by 11% in 29 years, from 1982 to 2010, as increasing CO2 has helped the greening of the Sahel and Sahara Desert. He contradicts the often heard media claims that drought is spreading globally, writing: “The media spread the word that desertification is progressing globally, but practically the desert is greening through CO2.” […] “Everyone should be aware that increasing CO2 concentrations in atmosphere is not in itself harmful, but it’s a good thing.”
The retired Japanese professor writes that at around 1000 A.D. — the Medieval Warm Period — there were no signs showing CO2 concentration was higher. A temperature graph using data from Moberg et al. (2005) shows the Medieval Warm Period appears clearly and that CO2 was in fact around 280 ppm at that time.
Operation IceBridge, NASA’s longest-running aerial survey of polar ice, carried a flight over the northern Antarctic Peninsula on Oct. 16, 2018. During the flight, IceBridge senior support scientist Jeremy Harbeck spotted two rectangular icebergs floating among sea ice just off of the Larsen C ice shelf.
This paper (.pdf 17 pages) reports the results of a detailed analysis carried out using published UK Met Office data up to 2017. These show:
UK temperatures rose during the 1990s and early 2000s. This rise is associated with a similar increase in near-coastal sea surface temperatures. There has been no rise in the last decade.
Seasonal temperatures have followed a similar pattern: a rise during the 1990s, but a levelling off since.
This sudden rise in UK land temperature is not unprecedented, with the Central Eng- land Temperature series (CET) showing a similar occurrence in the early 18th century.
Analysis of CET shows that despite the rise in average summer temperatures, there has been no increase in the highest daily temperatures, or the frequency of extreme high temperatures, in recent years. In fact the opposite is true. Heatwaves were far more intense in 1975 and 1976, when there were thirteen days over 30◦C. By contrast, between 2007 and 2017 there have only been two such days. (Note that there was also only been one day over 30◦C in the summer of 2018). The highest daily temperature on CET was 33.2◦C, set in 1976 and equalled in 1990.
Much of my rebuttal was put together from prior WUWT posts on this subject, there’s at least one new addition to the vast evidence of scientific division (Stenhouse et al., 2017).
Stenhouse et al., 2014 told us that atmospheric scientists are very divided on climate change over the past 150 years.
…
89% × 59% = 52%… A far cry from the oft claimed 97% consensus.
In a world riddled with climate-change doomsday predictions, a small but growing number of scientists are saying the highly touted climate models predicting steadily increasing global temperature due to humans’ carbon-dioxide emissions are wrong and that Earth could soon face something even direr: global cooling.
One such climate scientist is Valentina Zharkova, an astrophysicist at Northumbria University in the United Kingdom.
Zharkova and her team of researchers say that based on mathematical models of the Sun’s magnetic activity, it’s likely Earth will experience decreasing magnetic waves over a 33-year period beginning in 2021.
Abstract. Light absorbing aerosols in the atmosphere and cryosphere play an important role in the climate system. Their presence in ambient air and snow changes the radiative properties of these systems, thus contributing to increased atmospheric warming and snowmelt. High spatio-temporal variability of aerosol concentrations and a shortage of long-term observations contribute to large uncertainties in properly assigning the climate effects of aerosols through time.
Starting around AD1860, many glaciers in the European Alps began to retreat from their maximum mid-19th century terminus positions, thereby visualizing the end of the Little Ice Age in Europe. Radiative forcing by increasing deposition of industrial black carbon to snow has been suggested as the main driver of the abrupt glacier retreats in the Alps. The basis for this hypothesis was model simulations using elemental carbon concentrations at low temporal resolution from two ice cores in the Alps.
A team led by scientists at Caltech and the Jet Propulsion Laboratory (JPL), which Caltech manages for NASA, has calculated that if liquid water exists on Mars, it could — under specific conditions — contain more oxygen than previously thought possible. According to the model, the levels could even theoretically exceed the threshold needed to support simple aerobic life.
That finding runs contrary to the current, accepted view of Mars and its potential for hosting habitable environments. The existence of liquid water on Mars is not a given. Even if it is there, researchers have long dismissed the idea that it might be oxygenated, given that Mars’s atmosphere is about 160 times thinner than that of Earth and is mostly carbon dioxide.
by A. Bright-Paul, October 22, 2018 in ClimateChageDispatch
As the Earth rotates on its own axis, one-half of the Earth is cooling while the other half is warming up.
So the Earth is warming and cooling daily and the temperature is changing 3,600 times every hour in every location all over the world, as there are 3,600 seconds in every hour.
As the Earth is traveling around the Sun in an ellipse at 66,000 miles per hour and is tilted and wobbling as it spins, so the Earth has seasons, as the angle to the Sun varies.
So the temperatures in the spring and summer are usually warmer than in the autumn and winter when temperatures decline.
So there is a massive number of different temperatures over the whole Earth, constantly changing and always in flux.
…
La géologie, une science plus que passionnante … et diverse