by K. Richard, March 28, 2019 in NoTricksZone
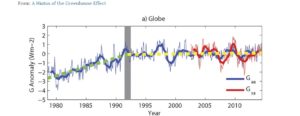
An unheralded but significant 2016 scientific paper – “A Hiatus of the Greenhouse Effect” – is now publicly available.
Scientists have found the greenhouse effect’s (GHE) influence on planetary temperatures went on “hiatus” during 1992-2014.
The estimated GHE radiative influence for these 22 years was a slightly negative -0.04 Wm-2 per year.
The reason why the GHE influence went on hiatus in recent decades is that (a) decadal-scale changes in cloud cover exert dominant radiative control in longwave forcing (GHE) efficacy, and (b) the shortwave effects of cloud cover changes override the radiative longwave effects, meaning that a decrease in cloud cover will allow more direct shortwave radiation to be absorbed by the Earth system, eliciting a net positive imbalance in the energy budget.
…
by Ian L.M. Goddard & S. Bett, Marcy 21, 2019 in WUWT
Abstract
This study aims to estimate the affect of urbanisation on daily maximum and minimum temperatures in the United Kingdom. Urban fractions were calculated for 10 km × 10 km areas surrounding meteorological weather stations. Using robust regression a linear relationship between urban fraction and temperature difference between station measurements and ERA‐Interim reanalysis temperatures was estimated.
For an urban fraction of 1.0, the daily minimum 2‐m temperature was estimated to increase by 1.90 ± 0.88 K while the daily maximum temperature was not significantly affected by urbanisation. This result was then applied to the whole United Kingdom with a maximum T min urban heat island intensity (UHII) of about 1.7K in London and with many UK cities having T min UHIIs above one degree.
This paper finds through the method of observation minus reanalysis that urbanisation has significantly increased the daily minimum 2‐m temperature in the United Kingdom by up to 1.70 K.
…
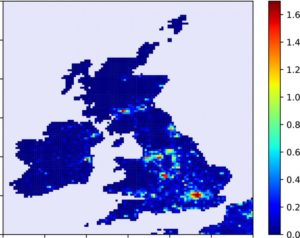
Figure 5 Map showing the change in T min due to the urbanisation at the 10 km × 10 km scale over the United Kingdom and Ireland. The colour bar shows the magnitude of the temperature change in K
La géologie, une science plus que passionnante … et diverse
