by Prof. Ole Humlum, April 2 , 2019 in GWPF
That’s according to Norwegian Professor Ole Humlum whose annual review of the world’s climate is published today by the Global Warming Policy Foundation.
Last week, the WMO issued its own review of the climate, which insinuated that global warming was worsening. However, Professor Humlum points out that the data tells a very different story:
“Reading the WMO report, you would think that global warming was getting worse. But in fact it is carefully worded to give a false impression. The data are far more suggestive of an improvement than a deterioration.”
And the lack of anything to be alarmed about is clear across a range of measures, says Professor Humlum:
“After the warm year of 2016, temperatures last year continued to fall back to levels of the so-called warming “pause” of 2000-2015. There is no sign of any acceleration in global temperature, hurricanes or sea-level rise. These empirical observations show no sign of acceleration whatsoever.”
Professor Humlum’s key findings:
- In 2018, the average global surface temperature continued a gradual descent towards the level characterising the years before the strong 2015–16 El Niño episode.
- Since 2004, when the Argo floats came into operation, the global oceans above 1900m depth have on average warmed somewhat. The maximum warming (between the surface and 120 m depth) mainly affects oceans near the equator, where the incoming solar radiation is at a maximum. In contrast, net cooling has been pronounced for the North Atlantic since 2004.
- Data from tide gauges all over the world suggest an average global sea-level rise of 1– 1.5 mm/year, while the satellite record suggests a rise of about 3.2 mm/year. The large difference between the two data sets still has no broadly accepted explanation.
- The Northern Hemisphere snow cover extent has undergone important local and regional variations from year to year. The overall global tendency since 1972, however, is for overall stable snow extent.
- Tropical storm and hurricane accumulated cyclone energy (ACE) values since 1970 have displayed large variations from year to year, but no overall trend towards either lower or higher activity. The same applies for the number of hurricane landfalls in the continental United States, for which the record begins in 1851.
…
see also here

by Jim Steele, April 2, 2019 in WUWT
Good news continues to accumulate regards corals’ ability to rapidly adjust to changing climates. The view of coral resilience has been dominated by the narrative of a few scientists. In the 1990s they advocated devastating consequences for coral reefs due to global warming, arguing coral cannot adapt quickly enough. Since the Little Ice Age ended, they believed rising ocean temperatures had brought coral closer to a “bleaching threshold”, a more or less fixed upper temperature limit above which corals cannot survive. Their model predicted the speed of recent global warming “spells catastrophe for tropical marine ecosystems everywhere”. Their assertions that “as much as 95% of the world’s coral may be in danger of being lost by mid-century” was guaranteed to capture headlines and instill public fear. However, a growing body of scientific research increasingly casts doubts on such alarming predictions. Unfortunately, that good news gets much less attention.
A recent peer-reviewed paper titled A Global Analysis of Coral Bleaching Over the Past Two Decades (Sully 2019) compared 20 years of ocean temperatures at which coral bleaching was initiated. From 1998 to 2006, the average sea surface temperature that initiated bleaching was 82.6 °F. But that temperature limit proves not to be “fixed” as earlier researchers incorrectly believed. From 2007 to 2017 the average temperature limit that initiated bleaching was higher, 83.7 °F. This indicates coral have been rapidly adapting to warmer regional climates much faster than once believed.
…
by Bloomberg, April 2, 2019 in SouthChinaMorningPost
China’s home-grown nuclear technology is gaining favour in the battle for the nation’s next generation of reactors, according to a state-owned developer, as it sought to recover from delays and cost blowouts from imported designs.
China’s reactor, known as the Hualong One, will be faster and easier to repair and maintain than competing foreign designs because it will be made at home, according to Chen Hua, chief executive officer of China National Nuclear Power company (CNNP), which builds and operates nuclear power projects.
“We prefer the Hualong One,” Chen said on Monday at a nuclear energy conference in Beijing.
The global nuclear industry has been awaiting a revival in China after cost overruns and stricter regulation after the 2011 Fukushima disaster in Japan stalled the approval and construction of more units.
…

…
by Olivier Daniélo, 2 avril 2019 in Reporterre
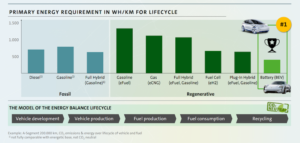
Il y a urgence à agir pour réduire les émissions de CO2. La marche et le vélo sont certes préférables à la voiture particulière. Mais parmi les différents types de voitures, quelle est la solution la plus efficace pour réduire les émissions de CO2 ?
Il existe un indicateur particulièrement intéressant pour tenter d’y répondre : la quantité d’énergie consommée pour réaliser par exemple 200.000 kilomètres. Energie non seulement pour propulser la voiture, mais aussi pour fabriquer la voiture elle-même et extraire dans les mines les matières premières nécessaires. Le bilan carbone est bien entendu corrélé au bilan énergétique. Les experts du groupe Volkswagen (VW) ont fait le calcul et ont présenté les résultats le 12 mars 2019 à l’occasion de la conférence de presse annuelle de ce mastodonte dont les décisions influencent l’industrie automobile mondiale.

Verdict : la voiture aux carburants synthétiques (eFuel et eCNG) consomme trois fois plus d’énergie primaire que la voiture électrique. Et celle à l’hydrogène, 1,7 fois plus. Ces 70 % supplémentaires représentent un impact à la fois économique et carbonique. La fabrication de la pile à combustible et du réservoir capable de résister à une pression de 700 atmosphères est énergivore. La voiture à hydrogène la plus vendue au monde (quelques milliers d’exemplaires) pèse 1.850 kg, soit 3 kilos de plus que la Tesla Model 3 Long Range (100 % batterie), qui a la même autonomie. Mais, c’est surtout le mauvais rendement de la chaîne hydrogène qui plombe le bilan global.
…
La géologie, une science plus que passionnante … et diverse


