China is warming fastest where the cities are, not where the models predicted – classic UHI

by JoNova, July 24, 2019


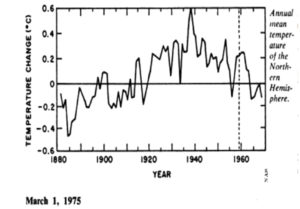
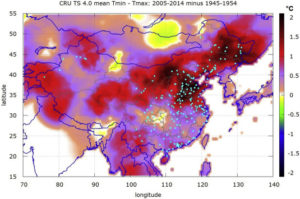
The biggest changes in temperature (“divergence” in dark red brown Fig 6) occurred where the most people lived (blue dots). In the 60 years to 2010 China was reported to have warmed by 0.79 ± 0.10 °C. However Scafetta et al calculate at most, China could have experienced a real warming of only 0.46 ± 0.13 °C.

Somehow the combined might and supercomputers at NOAA, NASA, Hadley and the Bureau of Met experts all missed this.

It’s another third of a degree gone from the Glorious CO2 Narrative. Just like that.


Is there a  more perfect nation to study the Urban Heat Island effect than China?

The worlds most populous nation has made a blistering transformation in two decades. As recently as 1995 the population was 75% rural. Now it’s approaching 60% urban. Shenzhen, which is near Hong Kong, grew from 3000 people in 1950 to more than 10 million in 2010. Around Beijing, thousands of towns have been built in a networked carpet, each a mere 2km apart (zoom in on Google satellite view). The stations in these areas are effectively not rural anymore.

See also here

China Still Expanding Coal Power Capacity

by P. Homewood, July 23, 2019 in NotaLotofPeoppleKnowThat


SANHE, China (Reuters) – China Energy Group, the country’s biggest power generator, will add more than 6 gigawatts (GW) of new ultra-low emission coal-fired capacity this year as it bids to meet growing electricity demand, a senior official with the firm said on Thursday.

The company also expected to build another 5 GW of low-emission capacity next year, Xiao Jianying, the head of the state-run firm’s coal-fired power department, told Reuters.

“China still has quite a big demand for electricity. The government now supports regions with poor wind and solar resources to use coal-fired power … it’s a more practical measure, as gas is still too expensive,” said Xiao.

China Energy operated coal-fired plants with a total capacity of 175 GW at the end of 2018, 77.4% of its total capacity and about 10% of the entire country’s capacity.

1970s: Earth Warmed 0.6°C From 1880-1940 And Cooled -0.3°C From 1940-1970. Now It’s 0.1°C And -0.05°C.

by K. Richard, July 25, 2019 in NoTricksZone


About 45 years ago, the “consensus” in climate science (as summarized by Williamson, 1975) was quite different than today’s version.

1. The Medieval Warm Period was about 1°C warmer than present overall while the “largely ice-free” Arctic was 4°C warmer, allowing the Vikings to navigate through open waters because there was “no or very little ice” at that time.
2. The island of Spitsbergen, 1237 km from the North Pole and home to over 2000 people, “benefited” because it warmed by 8°C between 1900 and 1940, resulting in 7 months of sea-ice free regional waters. This was up from just 3 months in the 1800s.
3. Central England temperatures dropped -0.5°C between the 1930s to the 1950s.
4. Pack-ice off northern and eastern iceland returned to its 1880s extent between 1958 and 1975.
5. In the 1960s, polar bears were able to walk across the sea (ice) from Greenland to Iceland for the first time since the early 1900s. (They had somehow survived the 7 months per year of sea-ice-free waters during the 1920s-1940s).


Image Source: National Academy of Sciences,  Understanding Climatic Change