Claim: Russia will be Ruined by the Clean Energy Transition

by Eric Worall, June 29, 2019 in WUWT


According to Forbes, when renewable energy programmes like Germany’s Energiewende mature, demand for Russian fossil fuel will collapse.

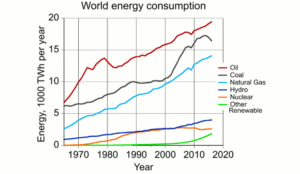
World Energy Consumption. By Con-structBP Statistical Review of World Energy 2017, CC BY-SA 3.0, Link

Will Russia Survive The Coming Energy Transition?

Jun 27, 2019, 10:35am
Ariel Cohen Contributor

A new global energy reality is emerging. The era of the hydrocarbon – which propelled mankind through the second stage of the industrial revolution, beyond coal and into outer space – is drawing to a close. The stone age ended not because we ran out of stones. The same with oil and gas.

We have now entered the era of the renewable energy resource, whereby zero-emission electricity is generated via near unlimited inputs (solar radiation, wind, tides, hydrogen, and eventually, deuterium). Cutting-edge, smart electric grids, utility-scale storage, and electric self-driving vehicles – powered by everything from lithium-ion batteries to hydrogen fuel cells – are critical elements of this historic energy transition.
Each of these technological trends will displace demand for Russia’s primary source of budget revenues: fossil fuels.

Arctic Sea Ice Surprise Global Warming Experts By Remaining Stable This Decade

by P. Gosselin, June 28, 2019 in NoTricksZone


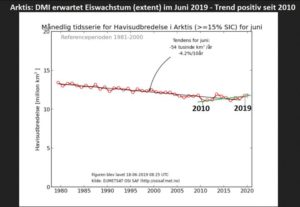
The Danish Meteorological Institute (DMI) expects sea ice extent growth in June 2019:

The DMI plot for the development of Arctic sea ice area (extent) from June 1979 to the PROGNOSE for June, 2019. Since 2010, i.e. 9 years ago, the sea ice areas of the Arctic have been growing in trend. Reports about disappearing sea ice in the Arctic are fake news. See also: No ice melting in the Arctic in this decade. Source: DMI-Plots Ice Cover

May Arctic sea ice trend now stable 15 years

Fermeture ou prolongation de la durée de vie des centrales nucléaires : quelles conséquences économiques et environnementales ?

by Prof.  Ernest Mund, 25 juin 2019 in ScienceClimatEnergie


A la façon dont vont les choses il paraît de plus en plus certain que la Belgique mettra la clé sous le paillasson de son parc de centrales nucléaires en 2025, conformément à la décision de la loi Deleuze votée en 2003. Cet abandon très néfaste est la conséquence du manque de discernement de la part des Autorités politiques au pouvoir face à l’hostilité irréductible du mouvement écologiste à l’égard du nucléaire.

Que cet abandon soit très néfaste est argumenté avec énormément de détails dans un rapport récent de l’IEA (Agence Internationale de l’Energie) dont plusieurs éléments chiffrés sont utilisés dans cette note [1]. Ce rapport analyse avec grande acuité le déclin du nucléaire en service, conçu au cours des années 70. A cette époque le système électrique était centralisé avec une intégration verticale de ses différentes composantes et le prix de l’électricité était le reflet des coûts, indépendamment de toute considération relative à une logique de marché. La taille des installations visait à la réduction des coûts par effet d’échelle. Ce nucléaire (de Génération-II et -III) est devenu totalement inadapté au système décentralisé actuel, alimenté pour une part rapidement croissante en sources d’énergie renouvelable intermittentes (EnRI, éolien et solaire) avec un prix de l’électricité relevant d’un marché, institué dans le courant des années 90.

More Failed Predictions: May Was The Second Wettest Month In US History

by Chriss Street, June 28, 2019 in ClimateChangeDispatch


National Oceanic and Atmospheric Administration reported the month of May was the second wettest and temperatures were in the bottom-third for its 125-year US history.

The 2010 publication titled, ‘A Global Overview Of Drought and Heat-Induced Tree Mortality Reveals Emerging Climate Change Risks for Forests’, was accepted by the Obama administration as scientific evidence that climate change had made the Earth:

“…increasingly vulnerable to higher background tree mortality rates and die-off in response to future warming and drought, even in environments that are not normally considered water-limited.”

But NOAA just reported that May US precipitation totaled an average of 4.41 inches, 1.50 inches above average, and ranked second wettest in the 125-year period of record for May as well as second wettest for all months since January 1895.

The only wetter month in US history was May 2015 with 4.44 inches of precipitation.

The 37.68 inches of precipitation across the contiguous U.S. from June 2018 to May 2019 shattered the previous 1982-83 12-month period by 1.48 inches.

Near-record to record precipitation was observed from the West Coast through the central Plains and into the Great Lakes and parts of the Northeast.

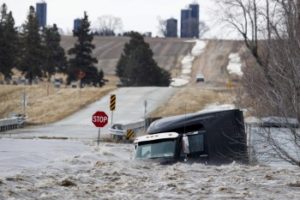
As a result, severe May flooding was observed along the Arkansas, Missouri, and Mississippi rivers. Vicksburg, MS, reported ongoing flooding since mid-February.

Truth(?) in testimony and convincing policy makers

by Judith Curry , June 28, 2019 in WUWT


Some reflections, stimulated by yesterday’s Congressional Hearing, on the different strategies of presenting Congressional testimony.

Yesterday’s Hearing provided an ‘interesting’ contrast in approaches to presenting testimony, when comparing my testimony with Michael Mann’s.

What are the purposes of expert testimony?

There is an interesting document entitled A Guide to Expert Testimony for Climate Scientists, funded by the US National Science Foundation.  Most of this is related to court room hearings, but some is relevant for Congressional Hearings.  Excerpts:


Experts may do one or more of the following:

  • Provide the decision-maker with factual information and background to provide the decision-maker with an adequate context for the decision.
  • Apply expert knowledge to the facts of a case and render an opinion about the facts, such as whether certain conditions actually caused an effect.
  • Explain scientific principles and theories to the decision-maker.
  • Extrapolate from the actual facts or hypothetical facts and rendering an opinion regarding the likelihood of an event or occurrence. Experts may speculate on events or occurrences because of their special knowledge or training.
  • Provide an opinion that contradicts or undermines the opinions or conclusions of an expert who testified for the opposing party.

If you are assigned to cross-examine an expert, you should prepare questions that test and challenge the witness on the following subjects :

  • Lack of thoroughness in investigating the facts or data;

  • Insufficient testing of the facts or data;

  • Lack of validity and reliability in testing of facts or data;

  • Existence of other causes or explanations for conclusions or outcomes;

  • Show differences of opinion among experts

Weaning US power sector off fossil fuels would cost between $4.7tn and $10tn

by Reuters News Service, June 27, 2019 in CyprusMail


Eliminating fossil fuels from the U.S. power sector, a key goal of the “Green New Deal” backed by many Democratic presidential candidates, would cost $4.7 trillion and pose massive economic and social challenges, according to a report released on Thursday by energy research firm Wood Mackenzie.

That would amount to $35,000 per household, or nearly $2,000 a year for a 20-year plan, according to the study, which called the price tag for such a project “staggering.”

The report is one of the first independent cost estimates for what has become a key issue in the 2020 presidential election, with most Democrats proposing multi-trillion-dollar plans to eliminate U.S. carbon emissions economy-wide.

Front-runner Joe Biden’s plan to get to zero emissions, for example, carries a $1.7 trillion price tag, while Beto O’Rourke’s proposal comes in at $5 trillion. Representative Alexandria Ocasio-Cortez, one of the authors of the “Green New Deal,” a non-binding Congressional resolution, put the cost of a comprehensive climate solution at around $10 trillion.

Such ideas aim to tap into a growing sense of urgency about global warming on both sides of the political divide, but have been panned by President Donald Trump and many Republicans as being unfeasible, costly, and a threat to the economy.

A power-generating wind turbine is seen in Saint-Laurent-Des-Eaux near Orleans, France

More than 50 newly discovered lakes beneath the Greenland Ice Sheet

by Lancaster University, June 26, 2019 in ScienceDaily


Researchers have discovered 56 previously uncharted subglacial lakes beneath the Greenland Ice Sheet bringing the total known number of lakes to 60. Although these lakes are typically smaller than similar lakes in Antarctica, their discovery demonstrates that lakes beneath the Greenland Ice Sheet are much more common than previously thought.

Dr Stephen J. Livingstone, Senior Lecturer in Physical Geography, University of Sheffield, said:

“The lakes we have identified tend to cluster in eastern Greenland where the bed is rough and can therefore readily trap and store meltwater and in northern Greenland, where we suggest the lakes indicate a patchwork of frozen and thawed bed conditions.

“These lakes could provide important targets for direct exploration to look for evidence of extreme life and to sample the sediments deposited in the lake that preserve a record of environmental change.”

How geologic forces are melting southern Greenland ice sheet

by J.E. Kamis, May 25, 2016 in ClimateChangeDispatch


The most plausible scenario for southern Greenland’s surface ice melt is related to geologically induced heat flow and not atmospheric warming for various, well-established reasons. Based on research by the National Oceanic and Atmospheric Administration (NOAA) (see here), the top surface of southern Greenland’s ice sheet is currently melting at a high rate and therefore greatly reducing surface ice volume. They attribute this geographically localized melting effect to an unusually persistent and man-made atmospheric high pressure system (a so-called Omega Block) that has remained stationary above southern Greenland during the spring of 2016.

This non-moving high-pressure system has trapped a cell of very warm air above southern Greenland resulting in higher-than-normal surface ice melting rates and volumes. NOAA and the mainstream media are portraying this above-average melting as undeniable proof man-made global warming damaging our planet.

This portrayal is vastly misleading.

That’s because southern Greenland’s surface ice melt is more likely caused by natural, geologically induced heat flow from one of Earth’s largest Deep Ocean crustal plate junctures, the 10,000 mile long Mid-Atlantic Ridge (MAR). The Mid-Atlantic Ridge is “an immensely long mountain chain extending for about 10,000 miles (16,000 km) in a curving path from the Arctic Ocean to near the southern tip of Africa. The ridge is equidistant between the continents on either side of it. The mountains forming the ridge reach a width of 1,000 miles.”

Now 20 years with no trend in ice breakup dates for Western Hudson Bay polar bears

by Polar Bear Science, June  26, 2019


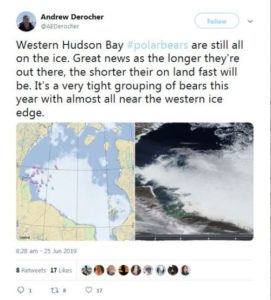
Straight from the horse’s mouth: all polar bear females tagged by researchers around Churchill in Western Hudson Bay last year were still on the ice as of 25 June. With plenty of ice still remaining over the bay, spring breakup will be no earlier this year than it has been since 1999. Contrary to predictions of ever-declining ice cover, the lack of a trend in sea ice breakup dates for Western Hudson Bay is now twenty years long (a hiatus, if you will) and yet these bears are repeatedly claimed to have been seriously harmed in recent years by a loss of sea ice.


Adjusted “Unadjusted” Data: NASA Uses The “Magic Wand Of Fudging”, Produces Warming Where There Never Was

by P. Gosselin, June 25, 2019 in NoTricksZone


By Kirye
and Pierre Gosselin

It’s been long known that NASA GISS has been going through its historical temperature data archives and erasing old temperature measurements and replacing them with new, made up figures without any real legitimate reason.

This practice has led to the formation of new datasets called “adjusted” data, with the old datasets being called “V3 unadjusted”. The problem for global warming activists, however, was that when anyone looks at the old “V3 unadjusted” – i.e. untampered data – they often found a downward linear temperature trend. Such negative trends of course are an embarrassment for global warming alarmists, who have been claiming the planet is warming up rapidly.

The adjusted “unadjusted” data

So what to do? Well, it seems that NASA has decided to adjust its “V3 unadjusted datasets” and rename them as “V4 unadjusted”. That’s right, the adjusted data has become the new V4 “unadjusted” data.

And what kind of trend does the new “V4 unadjusted” data show?

You guessed it. The new V4 unadjusted data are now yielding warmed up trends, even at places where a cooling trend once existed.

This is how NASA uses its magic wand of fudging to turn past cooling into (fake) warming.

6 examples of scandalous mischief by NASA

What follows are 6 examples, scattered across the globe and going back decades, which demonstrate this scandalous mischief taking place at NASA.

No. 1

Punta Arenas, Chile. Here we see how a clear cooling trend has been warmed up by NASA to produce a slight cooling trend:
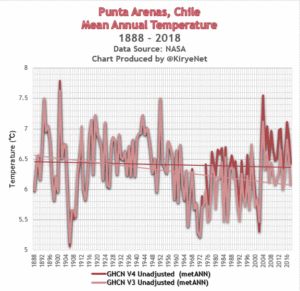
 

giss.nasa.gov/cgi-bin/gistemp/stdata_show_v3

giss.nasa.gov/cgi-bin/gistemp/stdata_show_v4

Greenland ice loss projections are clouded by clouds

by Brooks Hays, June 24, 2019 in UPI


June 24 (UPI) — Predicting where, how and how quickly Greenland’s ice will melt is difficult. Projections by the best models are cloudy, and new research suggests clouds are doing the clouding.

Currently, models of Greenland’s melting ice sheet put the greatest emphasis on the impacts of greenhouse gas emissions. But new research, published this week in the journal Nature Climate Change, suggests the microphysics of clouds are equally important.


Under high emission scenarios, the uncertainties of Greenland ice sheet models are caused almost entirely by the uncertainties of cloud dynamics.

Cloud cover dictates the ice sheet’s longwave radiation exposure. When clouds over Greenland are thicker, they operate like an insulating blanket, encouraging longwave radiation and surface-level melting.

Sky Abandon Facts In Favour Of Climate Propaganda

by P. Homewood, June 25, 2019 in NotaLotofPeopleKnowThat


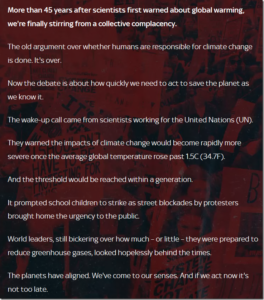
As far as climate change is concerned, Sky News have now abandoned all pretensions to factual accuracy, in favour of blatant propaganda.

They have a new 12-minute special report, to set off a week of special reports, but if this trailer is anything to go by it’s going to be the same old garbage the BBC have served up for years:

The use of the word “storms” in the link title, along with the phrase “climate crisis” gives a good idea of the junk that is to follow.

Let’s go through the trailer’s claims and statements:

Tensions autour du détroit d’Ormuz : allons-nous tous devoir rouler en vélo ?

by Samuele Furfari, 24 juin 2019 in ConnaissancedesEnergies


Les tensions dans le détroit d’Ormuz ne devraient pas nous surprendre. En 2000, François Lamoureux, Directeur général à l’énergie de la Commission européenne, disait avec son sens de la formule : « Si le détroit d’Ormuz est bloqué, le lendemain le monde entier ira en vélo ». Même si c’était exagéré, cela avait un sens à l’époque. Aujourd’hui, c’est faux. À la suite des événements des dernières semaines, le prix du pétrole brut a un peu augmenté mais le monde n’a pas « été » en vélo.

Pour répliquer aux pressions imposées par le président des États-Unis, l’Iran aux abois a-t-il placé les bombes sur deux pétroliers qui naviguaient dans le golfe Persique ? Washington accuse, Téhéran dément. Depuis son retrait de l’accord nucléaire iranien du 14 juillet 2015, Donald Trump a exercé une pression de plus en plus forte sur l’Iran.

Téhéran est en difficulté, malgré sa menace du 8 mai 2019 d’accorder un délai de 60 jours aux autres signataires de l’accord pour maintenir leurs engagements (principalement permettre à l’Iran de pouvoir vendre son pétrole dans le monde). Cette initiative du président iranien Hassan Rohani a poussé l’UE dans les cordes, elle qui a pourtant bien tenté de contourner les sanctions de Washington en créant Instex, une entité censée servir au paiement des transactions entre les entreprises européennes et l’Iran, afin de se passer de l’incontournable dollar américain dans les transactions internationales.

Climate science’s ‘masking bias’ problem

by Judith Curry, June 22, 2019 in WUWT


How valid conclusions often lay hidden within research reports, masked by plausible but unjustified conclusions reached in those reports.  And how the IPCC institutionalizes such masking errors in climate science.

In the previous post, we discussed the motivated biases of individual climate researchers, stimulated by the paper by Lee Jussim, Joe Duarte and others entitled Interpretations and methods: Towards a more self-correcting social psychology

The Jussim et al. paper provides additional insights that are relevant to the motivated biases in climate change, which become particularly serious and problematic once these biases are institutionalized. Here are additional excerpts from Jussim et al. for the topic I would like to discuss in this post:

<begin quotes>

“In this paper, we consider how valid conclusions often lay hidden within research reports, masked by plausible but unjustified conclusions reached in those reports. These conclusions do not necessarily involve the use of questionable research practices. Invalid conclusions may be reached based, not on failing to report dropped conditions, failed studies, or nonsignificant analyses, but on selective interpretations of data that highlight researchers’ preferred conclusions while masking more valid ones.”

JC comment: This is basically the problem that I have with the IPCC assessment reports. Deep in the chapters, there is much good information that is reliable, although the reports relatively ignore some topics. The problem is with the conclusions that are reached (particularly in the Summary for Policy Makers), and inflated levels of confidence that are ascribed to these conclusions.

Parts Of Canada Will Actually To See Up To 10 CM Of Snowfall By The First Day Of Summer

by Nicole Hul, June 20, 2019 in Narcity


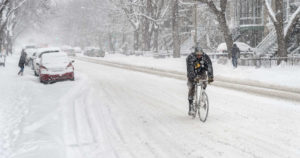
Summer officially kicks off tomorrow – but that doesn’t mean that the nice, hot weather typically associated with summer is coming, at least not to some parts of Canada. Even though winter technically ended several months ago, wintery, snowy weather hasn’t stopped reigning down in a number of regions in the country. The Alberta weather forecast shows snowfall of up to 10 cm by the first day of summer. Is summer cancelled?

It’s already been snowing in several provinces in June. While spring snow was already unusual, summer snow is even more bizarre.

Yesterday on Wednesday, Environment Canada issued a snowfall warning for Jasper National Park in Alberta, forecasting up to 10 cm of snow. Now, they are extending their warning, and even adding a new region.

Marc Bruxelle, Dreamstime.com

Current Solar Cycle Will Be First To Finish Below Normal In 80 Years, Weakest In Close To 200 Years

by F. Bosse & F. Vahrenbolt, June 22, 2019 in NoTricksZone


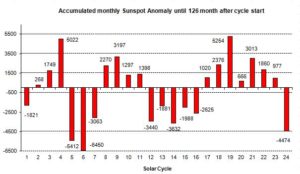
In May 2019 our sun was below-normal active again. The solar sunspot number (SSN) was 10.1, which is only 52% of the mean value in the evaluated cycle month no. 126 since the start of Cycle No. 24 began in December 2008.

It should be noted that the number of cycles that lasted this long is decreasing. In the previous month we reported on cycles 21, 18, 16, 15, 8 dropping out because they were shorter in total, and now SC 17 is getting added. Next month month SC 7 is will fall as well. The mean value thus becomes less meaningful as the end of the cycle approaches. But out of habit, we want to keep it nevertheless as comparison.

The activity in the past month was shifted very asymmetrically to the solar northern hemisphere, the southern hemisphere was spotless throughout the whole month. The solar north saw spots only on 15 days.


Fig. 2: Sunspot activity of the individual cycles since the beginning of cycle 1 in the year 1755. The numbers are computed by adding up the monthly differences of the observed cycles to the mean value, up to the current cycle month no. 126.


Sun spotless for 33 days straight – airline travelers getting dosed with up to 70 times more radiation

by A. Watts, June 21, 2019 in WUWT


Are we in a solar grand minimum? We’ve seen this before, but now predictions are for an extremely weak solar cycle ahead.

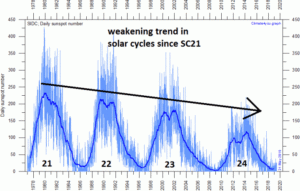
Today is the summer solstice in the northern hemisphere. The sun has been without a single observable sunspot now for over a month – 33 days according to NOAA and SIDC data.


Daily observations of the number of sunspots since 1 January 1977 according to Solar Influences Data Analysis Center (SIDC). The thin blue line indicates the daily sunspot number, while the dark blue line indicates the running annual average. The recent low sunspot activity is clearly reflected in the recent low values for the total solar irradiance. Compare also with the geomagnetic Ap-index. Data source: WDC-SILSO, Royal Observatory of Belgium, Brussels. Last day shown: 31 May 2019. Last diagram update: 1 June 2019 . [Courtesy climate4you.com]

..

CARTE BLANCHE : Faut-il céder à l’hystérie climatique?

by Yves Lahaye, 21 juin 2019 in ScienceClimatEnergie


En pleine effervescence sur la question climatique, je reste dubitatif en considérant quelques faits avérés qui ne me paraissent pas aller dans le sens proclamé par la doctrine officielle. Je m’interroge également sur des affirmations qui me paraissent relever davantage de l’idéologie que de la science.

Bien sûr, je ne suis pas scientifique. Pour beaucoup, c’est déjà suffisant pour m’interdire d’exprimer un avis sur le sujet ou, mieux, pour m’interdire de poser des questions. Car bien évidemment, tous les scientifiques, bien plus malins que moi, ne décrètent-ils que la fin du monde est proche ? Je n’aurais donc pas d’autre droit que celui de me conformer à la bonne parole sous peine d’être mis au ban de la société.

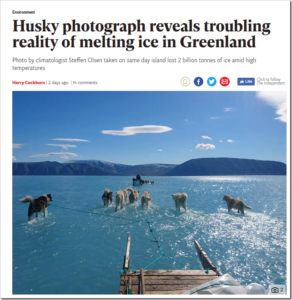
Ice Melting In Greenland? That’s What It Does In Summer

by P. Homewood, June 20, 2019 in NotaLotofPeopleKnowThat


The first thing to point out is that this is nothing to do with Greenland’s ice sheet, despite the misleading inference to that effect in the first paragraph. It is in fact fjord ice, which freezes every winter and melts every summer.

This year it is beginning to melt slightly earlier than usual, because of warm air moving up from the south. This is called “weather”, and has nothing to do with “global warming”.

As is noted, such weather is not unprecedented. Indeed, the temperature peak of 17.3C is not even unusual for Qaanaaq, where the record is set at 20C.


See also here

Antarctic marine life recovery following the dinosaurs’ extinction

by British Antarctic Survey, June 19, 2019 in ScienceDaily


The K-Pg extinction wiped out around 60% of the marine species around Antarctica, and 75% of species around the world. Victims of the extinction included the dinosaurs and the ammonites. It was caused by the impact of a 10 km asteroid on the Yucatán Peninsula, Mexico, and occurred during a time period when the Earth was experiencing environmental instability from a major volcanic episode. Rapid climate change, global darkness, and the collapse of food chains affected life all over the globe.

The K-Pg extinction fundamentally changed the evolutionary history of life on Earth. Most groups of animals that dominate modern ecosystems today, such as mammals, can trace the roots of their current success back to the aftermath of this extinction event.

A team of scientists from British Antarctic Survey, the University of New Mexico and the Geological Survey of Denmark & Greenland show that in Antarctica, for over 320,000 years after the extinction, only burrowing clams and snails dominated the Antarctic sea floor environment. It then took up to one million years for the number of species to recover to pre-extinction levels.

Plate tectonics may have driven ‘Cambrian Explosion’

by University of Exeter, June 19, 2019 in ScienceDaily/from Nature


A team of scientists have given a fresh insight into what may have driven the “Cambrian Explosion” — a period of rapid expansion of different forms of animal life that occurred over 500 million years ago.

While a number of theories have been put forward to explain this landmark period, the most credible is that it was fuelled by a significant rise in oxygen levels which allowed a wide variety of animals to thrive.

The new study suggests that such a rise in oxygen levels was the result of extraordinary changes in global plate tectonics.

During the formation of the supercontinent ‘Gondwana’, there was a major increase in continental arc volcanism — chains of volcanoes often thousands of miles long formed where continental and oceanic tectonic plates collided. This in turn led to increased ‘degassing’ of CO2 from ancient, subducted sedimentary rocks.

This, the team calculated, led to an increase in atmospheric CO2and warming of the planet, which in turn amplified the weathering of continental rocks, which supplied the nutrient phosphorus to the ocean to drive photosynthesis and oxygen production.

If “Greenland is catastrophically melting”, how do alarmists explain NASA’s growing Greenland glacier?

by A. Watts, June19, 2019 in WUWT


It turned out to be a weather event, unrelated to “climate change”. The next year, there was no “insta-melt“.

In fact. we’d not even know about the melting in Greenland before satellites came on the scene. So how many times in the history of the Earth has Greenland has a quick melt spike? I’m guessing hundreds of thousands of times.

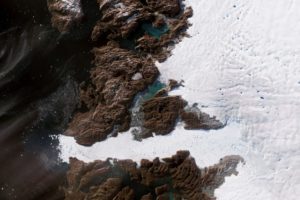
Jakobshavn Glacier in western Greenland is notorious for being the world’s fastest-moving glacier. It is also one of the most active, discharging a tremendous amount of ice from the Greenland Ice Sheet into Ilulissat Icefjord and adjacent Disko Bay—with implications for sea level rise. The image above, acquired on June 6, 2019, by the Operational Land Imager (OLI) on Landsat 8, shows a natural-color view of the glacier.

Jakobshavn has spent decades in retreat—that is, until scientists observed an unexpected advance between 2016 and 2017. In addition to growing toward the ocean, the glacier was found to be slowing and thickening. New data collected in March 2019 confirm that the glacier has grown for the third year in a row, and scientists attribute the change to cool ocean waters.

June 6th, 2019 Jakobshavn Glacier in western Greenland . Image acquired on June 6, 2019, by the Operational Land Imager (OLI) on Landsat 8, shows a natural-color view of the glacier.

Consensus? 200+ New 2019 Papers Support A Skeptical Position On Climate Alarmism

by K. Richard, June17, 2019 in NoTricksZone


In the first 5½ months of 2019, over 200 scientific papers have been published that cast doubt on the position that anthropogenic CO2 emissions function as the climate’s fundamental control knob…or that otherwise serve to question the efficacy of climate models or the related “consensus” positions commonly endorsed by policymakers and ²²²²mainstream media sources.


These 200+ new papers affirm the position that there are significant limitations and uncertainties inherent in our understanding of climate and climate changes, emphasizing that climate science is not settled.

More specifically, the papers in this compilation support these four main skeptical positions — categorized here as N(1) – N(4) — which question climate alarm.

Dry Hot North German Summers Were More Common 1000 Years Ago, Scientists Report

by P. Gosselin, June 19, 2019 in NoTricksZone


Dry Summers Like 2018 Were Common in the Middle Ages