by Eric Worrall, November 30, 2019 in WUWT
For a long time Geothermal energy has been an expensive joke, even for people who claim solar and wind power is viable. History is littered with Geothermal projects which failed to live up to their early promise, such as the Tim Flannery inspired Cooper Basin project, which obliterated at least $90 million in government grant money before the project was abandoned.
But there are some hints that COP25 might include an attempt to breath new government money into this failed renewable energy technology.
From Chile, posted in April this year
…

by Kip Hansen, November 30, 2019 in WUWT
…
…
Now an annotated version of the second graph:
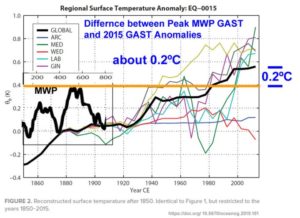
Here we have the second graph 1850-2015, with the global Average Surface Temperature anomaly (again — baseline 15 CE) but I have dropped in a smaller window, on the left, bringing forward the Roman Warm Period and the Medieval Warm Period (MWP) — the years 100-800 CE (same scale) — to illustrate the difference between the peak Global Average Surface Temperature (GAST) of the Medieval Warm Period to the most current GAST on the graph (2015).
This exposes the ubiquitous trick of the Climate Debate, in which Global Temperatures are [almost] always shown only from the depths of the Little Ice Age (clearly marked on the first graph by Gebbie), resulting in images similar to Gebbie’s Figure 2 — despite the fact that most 2 millennia reconstructions clearly show the Roman and Medieval Warm Periods as generally in the same range as the Modern Warm Period. Given the acknowledged range of error in any temperature reconstruction and in modern estimates of global surface temperatures (today, in absolute temperatrures, around +/- 0.5ºC or a range of 1ºC) — there may be little, if any, significant-to-the-global-environment difference between the two periods.
The Medieval Warm period did not result in a “Climate Catastrophe” and the [iffy] little additional 0.2°C seen today is very unlikely to spark a modern Climate Catastrophe either.
by Cap Allon, November 30, 2019 in Electroverse
The mercury in San Francisco reached a high of just 8.8C (48F) on Thursday, November 28, tying the 1896 (solar minimum of cycle 12) record for the city’s lowest-max temp ever recorded in November.
And San Francisco wasn’t alone in dealing with below-average temperatures late last week. According to the National Weather Service, much of the interior North Bay suffered sub-zero readings overnight Thursday:
Novato Airport recorded a nipple-hardening -5C (23F).
Santa Rosa and Napa County Airport dipped to -3.3C (26F).
Sonoma Airport bottomed out at -2.8C (27F).
While temps touched freezing point at Livermore Airport.
2.8C (37F) at Oakland Airport and San Jose.
And 5C (41F) in San Francisco.
(Readings all highly unusual for the time of year).
…
by K. Richard, November 29, 2019 in NoTricksZone
In a new paper (Mörner, 2019, expanding upon Mörner, 2017), photo evidence confirms sea levels in 5 studied equatorial regions have fallen by about 60 cm since the 17th century…and remained stable since the 1970s.
…
…
Another new study (Haryono et al., 2019) of sea level change in equatorial Indonesia also supplies photos of marine terrace biomarker evidence affirming sea levels were about 5 meters higher than they are today between 5000 to 3000 years before present, suggesting “it means it was warmer than the present day” back then.
…
La géologie, une science plus que passionnante … et diverse
