Barrels of ancient Antarctic air aim to track history of rare gas

by University of Washington, December 13, 2019 in ScienceDaily


An Antarctic field campaign last winter led by the US and Australia has successfully extracted some of the largest samples of air dating from the 1870s until today. Researchers will use the samples to look for changes in the molecules that scrub the atmosphere of methane and other gases.

“It’s probably the most extreme atmospheric chemistry you can do from ice core samples, and the logistics were also extreme,” said Peter Neff, a postdoctoral researcher with dual appointments at the UW and at the University of Rochester.

But the months the team spent camped on the ice at the snowy Law Dome site paid off.

“This is, to my knowledge, the largest air sample from the 1870s that anyone’s ever gotten,” Neff said. His 10 weeks camped on the ice included minus-20 degrees Fahrenheit temperatures and several snowstorms, some of which he shared from Antarctica via Twitter.

Air from deeper ice cores drilled in Antarctica and Greenland has provided a record of carbon dioxide and methane, two greenhouse gases, going back thousands of years. While carbon dioxide has a lifetime of decades to centuries, an even more potent gas, methane, has a lifetime of just nine or 10 years.

CMIP5 Model Atmospheric Warming 1979-2018: Some Comparisons to Observations

by Roy Spencer, December 12, 2019 in WUWT


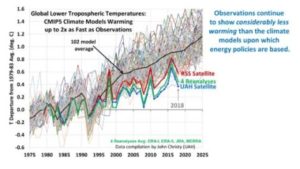
I keep getting asked about our charts comparing the CMIP5 models to observations, old versions of which are still circulating, so it could be I have not been proactive enough at providing updates to those. Since I presented some charts at the Heartland conference in D.C. in July summarizing the latest results we had as of that time, I thought I would reproduce those here.

The following comparisons are for the lower tropospheric (LT) temperature product, with separate results for global and tropical (20N-20S). I also provide trend ranking “bar plots” so you can get a better idea of how the warming trends all quantitatively compare to one another (and since it is the trends that, arguably, matter the most when discussing “global warming”).

From what I understand, the new CMIP6 models are exhibiting even more warming than the CMIP5 models, so it sounds like when we have sufficient model comparisons to produce CMIP6 plots, the discrepancies seen below will be increasing.

Global Comparisons

First is the plot of global LT anomaly time series, where I have averaged 4 reanalysis datasets together, but kept the RSS and UAH versions of the satellite-only datasets separate. (Click on images to get full-resolution versions).

Big volcanic bump unlike anything seen before found on the moon

by R.G. Andrews, December 13, 2019 in NationalGeography


Scientists scouring the lunar surface for clues to past impact rates found a bonus feature that has geologists “thoroughly confused.”

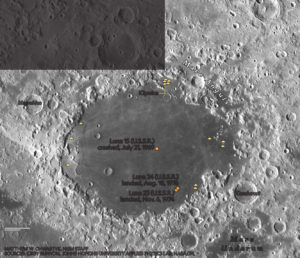
Sometime after the solar system formed 4.6 billion years ago, a projectile slammed into Earth’s youthful moon and formed the 620-mile-wide basin known as the Crisium basin. No one knows exactly when this impact happened, but for decades scientists have been trying to solve the puzzle as part of a larger debate over whether the moon and, by proxy, Earth endured a period of frenzied meteor bombardment in their early histories.

Now, scientists scouring the region say they’ve spotted a crater within the basin that appears to contain pristine impact melt, a type of volcanic rock that can act like a definitive geologic clock. If future astronauts or a robot could obtain a sample and tease out its age, that may help reveal what was happening on Earth during the primordial period when life first emerged on our planet.

And, as an added bonus, the discovery comes with an intriguing mystery: The basin also holds a geologic blister the size of Washington, D.C., that’s unlike anything else seen in the solar system. As the team reports in an upcoming paper in the Journal of Geophysical Research: Planets, this volcanic lump appears to have been inflated and cracked by peculiar underground magmatic activity that the researchers can’t currently explain.

“I’m thoroughly confused by it,” says Clive Neal, an expert in lunar geology at the University of Notre Dame who was not involved with the new research.


GLOBAL TEMPERATURES HOLDING STEADY FOR TWO DECADES

by Climate Science, December 13,  2019


Global temperatures have been holding nearly steady for almost two decades according to satellites from the Remote Sensing Systems (RSS) and University of Alabama at Huntsville (UAH).6You will never see that in the mass media.

2018 is the 3rd year in a row of cooling global temperatures – So far 2018 was the third year in a row that the globe has cooled off from its El Nino peak set in 2015.

Norwegian Professor Ole Humlum explained in his 2018 “State of the Climate Report”: “After the warm year of 2016, temperatures last year (in 2018) continued to fall back to levels of the so-called warming ‘pause’ of 2000-2015. There is no sign of any acceleration in global temperature, hurricanes or sea-level rise. These empirical observations show no sign of acceleration whatsoever.”

While 2005, 2010, 2015, and 2016 were declared the “hottest years” or “near -hottest,”  based on heavily altered surface data by global warming proponents, a closer examination revealed the claims were “based on year-to-year temperature data that differs by only a few HUNDREDTHS of a degree to tenths of a degree Fahrenheit – differences that were within the margin of error in the data.” 7

MIT climate scientist Dr. Richard Lindzen ridiculed “hottest year” claims. “The uncertainty here is tenths of a degree. It’s just nonsense. This is a very tiny change period,” Lindzen said. “If you can adjust temperatures to 2/10ths of a degree, it means it wasn’t certain to 2/10ths of a degree.”

In 2015, the Associated Press was forced to issue a “clarification” on “hottest year” claims, stating in part: “The story also reported that 2014 was the hottest year on record, according to the National Oceanic and Atmospheric Administration and NASA, but did not include the caveat that other recent years had average temperatures that were almost as high  – and they all fall within a margin of error that lessens the certainty that any one of the years was the hottest.”

Climatologist Pat Michaels explained that, in any case, the world’s temperature “should be near the top of the record given the record only begins in the late 19th century when the surface temperature was still reverberating from the Little Ice Age.”

“Hottest year” claims are purely political statements designed to persuade the public that the government needs to take action on man-made climate change. In addition, the claims of “hottest year” are based on surface data only dating back to the late 19th century, and also ignore the temperature revisions made by NASA and NOAA that have enhanced the warming trend by retroactively cooling the past. 8

6 The Pause Lives on: Global Satellites: 2016 not Statistically Warmer than 1998 – Climatologist Dr. Roy Spencer – January 4, 2017
7 Dr. David Whitehouse noted the ‘temperature pause never went away’ – January 19, 2017
8 Climate analyst Tony Heller – Real Climate Science – February 14, 2017