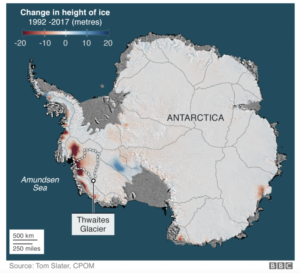
Scientists have known for years that subglacial volcanoes and other geothermal “hotspots” are contributing to the melting of the Thwaites Glacier. Why did the BBC fail to mention these facts in its recent report?
The International Thwaites Glacier Collaboration is performing some magnificent science, conducting the most ambitious fieldwork ever undertaken at the tip of what is one of the most significant glaciers on Earth. Its melting already contributes 4% of global sea level rise and there are fears that it could become unstable and contribute many metres to global sea level.
The reason for its vulnerability lies in its geology. While most of the glacier is on ground and making its way into the West Antarctic seas, Thwaites lip floats on water allowing warm water to weaken and melt it from beneath. Being one of the most difficult places in the world to reach the scientific collaboration planned for years to transport many tonnes of equipment to the glaciers front. Two weeks ago they announced they had carried out the first warm water borehole through the ice at the point where it lifts off the land and starts to be suspended by the ocean. Image courtesy British Antarctic Survey.
But fungi don’t just release carbon. They can also store it. For example, environmental stress can cause fungi to strengthen their cell walls. They do so by using organic compounds that contain carbon. These carbon compounds can stay in soils for years to decades or even longer.
…
“We found that where drought stress increased, the amount of fungi that invested more in strengthening cell walls and less in decomposition tended to increase,” says Treseder. In contrast, in more moderate conditions, the reverse occurred. Fungi that decomposed more efficiently became more common.
These findings suggest that fungi might store more carbon as global climate becomes more extreme. On the other hand, they might release more carbon dioxide in moderate climates. “These opposing feedbacks would not have been apparent without examining trade-offs among fungal traits,” says Treseder.
The IPCC’s First Assessment Report (FAR) made forecasts or projections of future concentrations of carbon dioxide that turned out to be too high.
From 1990 to 2018, the increase in atmospheric CO2 concentrations was about 25% higher in FAR’s Business-as-usual forecast than in reality. More generally, FAR’s Business-as-usual scenario expected much more forcing from greenhouse gases than has actually occurred, because its forecast for the concentration of said gases was too high; this was a problem not only for CO2, but also for methane and for gases regulated by the Montreal Protocol. This was a key reason FAR’s projections of atmospheric warming and sea level rise likewise have been above observations.
Some researchers and commentators have argued that this means FAR’s mistaken projections of atmospheric warming and sea level rise do not stem from errors in physical science and climate modelling. After all, emissions are for climate models an input, not an output. Emissions depend largely on economic growth, and can also be affected by population growth, intentional emission reductions (such as those implemented by the aforementioned Montreal Protocol), and other factors that lie outside the field of physical science. Under this line of reasoning, it makes no sense to blame the IPCC for failing to predict the right amount of atmospheric warming and sea level rise, because that would be the same as blaming it for failing to predict emissions.
…
…
Readers who have made it to this part of the article probably want a summary, so here it goes:
Hausfather estimates that FAR’s Business-as-usual scenario over-projected forcings for the 1990-2017 period by 55%. This would mean a difference of 0.59 w/m2 between FAR and reality.
Lower-than-expected concentrations of Montreal Protocol gases explain about 0.19 w/m2 of the difference. With the big caveat that Montreal Protocol accounting is a mess of CFCs, HCFCs, HFCs, stratospheric ozone, and perhaps other things I’m not even aware of.
FAR didn’t account for tropospheric ozone, and this ‘unexplains’ about 0.07 w/m2. So there’s still 0.45-0.5 w/m2 of forcing overshoot coming from something else, if Hausfather’s numbers are correct.
N2O is irrelevant in these numbers
CO2 concentration was significantly over-forecasted by the IPCC, and that of methane grossly so. It’s safe to assume that methane and CO2 account for most or all of the remaining difference between FAR’s projections and reality.
Again, this is a rough calculation. As mentioned before, an exact calculation has to take into account for many issues I didn’t consider here. I really hope Hausfather’s paper is the beginning of a trend in properly evaluating climate models of the past, and that means properly accounting for (and documenting) how expected forcings and actual forcings differed.
The British tabloid “The Guardian” has a new scare story about what is wrongly called “ocean acidification”. It opens as follows:
Pacific Ocean’s rising acidity causes Dungeness crabs’ shells to dissolve
Acidity is making shells of crab larvae more vulnerable to predators and limiting effectiveness in supporting muscle growth
The Pacific Ocean is becoming so acidic it is starting to dissolve the shells of a key species of crab, according to a new US study.
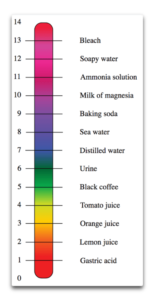
Sounds like the end of times, right? So let me start with a simple fact. The ocean is NOT acidic. Nor will it ever become acidic, except in a few isolated locations. It is alkaline, also called “basic”. The level of acidity/alkalinity is expressed on the “pH” scale, where neutral is 7.0, alkaline is from 7 to 14, and acidic is from 0 to 7.
Figure 1. The pH scale, running from the most acid at the bottom, through neutral in the middle, and up to the most alkaline at the top.
From the chart, the ocean has a pH of around 8 (although as we’ll see, that conceals great variation).
…
La géologie, une science plus que passionnante … et diverse