Polar bear habitat at mid-winter as extensive as 2013 & better than 2006

by S. Crockford, February 14, 2020 in PolarbearScience


Arctic sea ice at the middle of winter (January-March) is a measure of what’s to come because winter ice is the set-up for early spring, the time when polar bears do most of their feeding on young seals.

[Mid-winter photos of polar bears are hard to come by, partly because the Arctic is still dark for most hours of the day, it’s still bitterly cold, and scientists don’t venture out to do work on polar bears until the end of March at the earliest]

At 12 February this year, the ice was similar in overall extent to 2013 but higher than 2006.

Bjorn Lomborg Fighting Australia’s Fire Myths

by P. Homewood, January 29, 2020 in NotaLotofPeopleKnowThat


https://www.facebook.com/bjornlomborg/photos/a.221758208967/10158703983303968/?type=3&theater

As he points out in the article:

Australia is the world’s most fire-prone continent. In 1900, 11 per cent of its surface burned annually. These days, 5 per cent of the country burns every year. By the end of the century, if we do not stop climate change, higher temperatures and an increase in aridity will likely mean a 0.7 percentage point increase in burnt area, an increase from 5.3 per cent of Australia to 6 per cent.

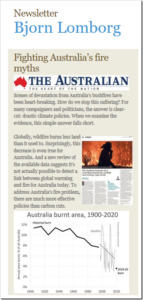
Unfortunately, many reports on Australia’s fires have exploited the carnage to push a specific agenda, resting on three ideas: that bushfires are worse than ever, that this is caused by global warming, and that the only solution is for political leaders to make even bigger carbon-cut promises.

Globally, bushfires burn less land than it used to. Since 1900, global burnt area has reduced by more than one-third because of agriculture, fire suppression and forest management. In the satellite era, NASA and other groups document significant decreases.

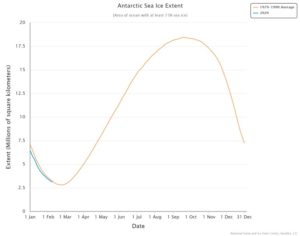
Surprisingly, this decrease is even true for Australia. Satellites show that from 1997 to 2018 the burnt area declined by one-third. Australia’s current fire season has seen less area burned than in previous years. Up to January 26, bushfires burned 19.4 million hectares in Australia — about half the average burn over the similar timeframe of 37 million hectares in the satellite record. (Actually the satellites show 46 million hectares burnt, but 9 million hectares are likely from prescribed burns.)

When the media suggests Australia’s fires are “unprecedented in scale”, it is wrong. Australia’s burnt area declined by more than a third from 1900 to 2000, and has declined across the satellite period. This fire season, at the time of writing, 2.5 per cent of Australia’s area has burned compared with the past 10 years’ 4.8 per cent average by this point.

What is different this year is that fires have been mostly in NSW and Victoria. These are important states with a little more than half the country’s population — and many of its media outlets.

But suggesting fires are caused by global warming rests on cherrypicking these two regions with more fire and ignoring the remaining 87 per cent of Australia’s landmass, where burned area has declined.

I certainly would take issue with the claim aridity will increase, as we know that rainfall has generally been greater since the 1970s than before.

Lomborg goes on to make the points I have made regularly, that there are many practical ways to reduce the risk of severe fires, and that even if Australia went totally net zero, it would have no effect whatsoever on their climate.

Well worth a read though.

The Rise and Fall of Central England Temperatures; Part 3 2000-2019

by Tony Brown, February 15, 2020 in WUWT


This is the third examination of Central England Temperatures (CET) in a series that commenced in 2015 and which has charted the recent decline in temperatures from their highest values. The two previous articles in this series are referenced here;

The Rise and Fall of Central England Temperatures; Part 1 covering 2000 to 2015

https://judithcurry.com/2015/11/25/the-rise-and-fall-of-central-england-temperature/

The Rise and Fall of Central England Temperatures; Part 2 covering 2000 to 2017

https://wattsupwiththat.com/2018/03/04/the-rise-and-fall-of-central-england-temperatures-help-needed-to-find-missing-data/

When referencing any ‘decline’ we need to put that into context against CET’s overall substantial rise in recent decades. The official CET dataset used in this article, which is compiled by the UK Met office is linked here and shown in Figure A);

https://www.metoffice.gov.uk/hadobs/hadcet/

It should be noted that the values between 1538 and 1658 are my own reconstruction and are not used at all in this current paper.

Note: Weather comprises the day to day events that we all experience. Climate is officially the trend of the weather (often temperature and rainfall) taken over a continuous thirty year period. The two terms have sometimes been used in an interchangeable manner here, when a period of more than a year is being examined.

Figure A

According to the Met office; ‘Since 1974 the data have been adjusted to allow for urban warming: currently a correction of -0.2 °C is applied to mean temperatures.’

Greta’s, The Guardian’s Latest Panic Attack Over Antarctica Record Ignores Cooling Trends Of Recent Decades

by P. Gosselin, February 15, 2020 in NoTricksZone


In her latest panic attack, teenage Swedish climate activist Greta Thunberg – citing the Guardian –  once again appeared to be proclaiming the end of the world was a step closer when she tweeted Antarctica has set a new record high temperature:


Two new warm records

According to the Guardian, “The 20.75C logged by Brazilian scientists at Seymour Island on 9 February was almost a full degree higher than the previous record of 19.8C, taken on Signy Island in January 1982.”

That reading, the Guardian reports, follows the February 6 record of 18.3C recorded at the Argentinian research station, Esperanza measured.

As is the case with most alarmists, every warm single datapoint anomaly gets uncritically accepted with open arms as solid evidence of man-made global warming while cold trends get dismissed or downgraded as “natural variability”.

Seymour Island has been cooling for over a quarter century

So we have two recent warm records set at and near the Antarctic peninsula over the past week or so and that means the region there is heating up, alarmists like Greta and the Guardian want us to believe. But what are the real TRENDS there? Do the 2 recent warm records mean the region is heating up.

Looking at official data from NASA, it turns out that warming isn’t true. And because climate is always changing, the temperature in the region in question has also not remained completely steady. The only possibility left? COOLING.

Also here

Physics Professor: CO2’s 0.5°C Impact After Rising To 700 ppm Is So Negligible It’s ‘Effectively Unmeasurable’

by P. Stallinga, February 13, 2020 in NoTricksZone


Dr. Peter Stallinga has published a comprehensive analysis of the Earth’s greenhouse effect. He finds an inconsequential role for CO2.

Doubling CO2 from 350 to 700 ppm yields a warming of less than 0.5°C (500 mK).

Feedbacks to warming are likely negative, as adding CO2 may only serve to speed up natural return-to-equilibrium processes.

As for absorption-reemission perturbation from CO2, “there is nothing CO2 would add to the current heat balance in the atmosphere.”

A portion of Dr. Stallinga’s paper worth highlighting – which he mentions only in passing – refers to the early history of the Earth’s greenhouse effect paradigm.

K. Ångström receives little attention as a pioneer of the conceptualization that warming and cooling resul from radiative imbalances within a planetary greenhouse effect.

About 120 years ago, Ångström (1900) contradicted the oft-cited Arrhenius (1896) – the atmospheric physicist referred to by proponents of anthropogenic global warming.

Ångström suggested Earth’s greenhouse effect is already saturated in its current (1900) state, and therefore increasing CO2 will have “no effect whatsoever” on climate (Stallinga, 2020).

Ångström’s conclusions were largely ignored.

..

Bad news for climate alarmists: global carbon dioxide emissions flatlined in 2019

by A. Watts, February 13, 2020 in WUWT


From the inconvenient data department and the IEA comes this press release.


Despite widespread expectations of another increase, global energy-related carbon dioxide emissions stopped growing in 2019, according to IEA data released today.

After two years of growth, global emissions were unchanged at 33 gigatonnes in 2019 even as the world economy expanded by 2.9%. This was primarily due to declining emissions from electricity generation in advanced economies, thanks to the expanding role of renewable sources (mainly wind and solar), fuel switching from coal to natural gas, and higher nuclear power generation. Other factors included milder weather in several countries, and slower economic growth in some emerging markets.

Continuer la lecture de Bad news for climate alarmists: global carbon dioxide emissions flatlined in 2019

Climate Crisis Update–England As Warm As 1736 Last Month!

by P. Homewood, February 13, 2020 in NotaLotofPeopleKnowThat


https://www.metoffice.gov.uk/hadobs/hadcet/cet_info_mean.html

It’s been a mild start to the year here in England. In fact, according to the CET, it’s been the 14th warmest January since the start of records in 1659.

No doubt fingers will be pointed at global warming, but as the above chart shows, we have simply had mild weather of the commonly seen before. The difference is that it lasted virtually all month.

Moreover we have had warmer Januaries way back in the past. The warmest was in 1916, followed by 1921, 1796 and 1834.

https://www.metoffice.gov.uk/hadobs/hadcet/mly_cet_mean_sort.txt

Continuer la lecture de Climate Crisis Update–England As Warm As 1736 Last Month!

Mille milliards pour atteindre la neutralité carbone ?

by Samuel Furfari, 11 février 2020 in L’Echo


On perçoit que cette résolution est la prémisse qui va permettre d’amplifier les politiques keynésiennes en vue de relancer une économie européenne poussive par les dépenses publiques, c’est-à-dire in fine par la levée de nouvelles taxes, qu’elles soient appelées ” carbone ” ou autrement.

La majorité du parlement européen (les partis social-chrétien, socialiste et écologiste) a adopté le 15 janvier 2020 le pacte vert pour l’Europe, une résolution en 120 points qui vise la neutralité carbone d’ici 2050. Ils auraient d’ailleurs pu appeler cette résolution “transition juste” puisque cette expression s’y retrouve 15 fois. Qui peut s’opposer à quelque chose de juste? On peut observer que d’après cette majorité parlementaire, il n’y aura pas de justice sans financement.

Ces députés européens sont en faveur d’un plan d’investissement durable ambitieux pour parvenir à la “transition juste”. On retrouve d’ailleurs 49 fois les mots ” financement ” et ses dérivés. Or les critères de Maastricht ne permettent pas aux États membres de dépenser de manière inconsidérée l’argent qu’ils n’ont pas. On perçoit que cette résolution est la prémisse qui va permettre d’amplifier les politiques keynésiennes en vue de relancer une économie européenne poussive par les dépenses publiques, c’est-à-dire in fine par la levée de nouvelles taxes, qu’elles soient appelées “carbone” ou autrement. Pour preuve, cette résolution “se félicite de la proposition prévue d’une révision de la directive sur la taxation de l’énergie”.

La Commission européenne propose un plan sur dix ans visant à accélérer la transition climatique de l’Europe, plan financé à hauteur de mille milliards, tout en reconnaissant que c’est insuffisant. “Mille milliards de mille sabords”, aurait sans doute juré le capitaine Haddock. Mille milliards c’est ce qu’on appelle un “trillion” : c’est 1 000.000.000.000 euros. Oui, un trillion c’est énormément d’argent.

Climate Change is not a problem: Unless we make it one.

by Martin Capages Jr., February 11, 2020 in WUWT


INTRODUCTION

As long as humans have been on Earth, they have been adapting to changes in regional climates. A regional climate is the average of the weather for a relatively long period of time, usually 30+ years, at a particular location on the planet. The natural periodicity of prolonged regional weather variations has been documented in various ways by humans for eons. For a comparison of human civilization in the northern hemisphere to Greenland ice core temperatures for the last 18,000 years see here. Some of the means of documenting changes in long term weather patterns, i.e. climate change, include crude prehistoric cave drawings of the animals and plants, paintings of frozen rivers (see Figure 1 of ice skating on the River Thames in 1684), and archaeological digs. There are also written records of climatic conditions as early as 5,000 years ago, perhaps even earlier. Ice, subsea, peat and lake bed cores are also used, for a more detailed discussion of the methods used see here and the links therein.

Figure 1. Ice skating on the River Thames in London in January 1684, during the Little Ice Age. Museum of London, link.


Continuer la lecture de Climate Change is not a problem: Unless we make it one.

Storm Of The Century? Don’t Be Silly, Met Office

by P. Homewood, February 10, 2020 in NotaLotofPeopleKnowThat


Britain is facing further mayhem over the next 48 hours in the wake of Storm Ciara which battered Britain with winds of up to 100mph causing widespread flooding and travel chaos.

Hundreds of flights were grounded, motorways and main roads shut and trains cancelled and delayed in the wake of a storm that threatens further disruption.

The Met Office warned that ‘exceptional’ gusts of up to 70mph would strike again on Monday and issued snow and ice warnings for large swathes of northern England and almost all of Scotland. The south of England will also be hit for a second day by heavy winds.

Gusts of 97mph were recorded at the Needles off the Isle of Wight while Manchester Airport was buffeted by winds of up to 86mph.

Continuer la lecture de Storm Of The Century? Don’t Be Silly, Met Office

OFFICIAL DATA REVEALS JANUARY 2020’S ANTARCTIC SEA ICE EXTENT TRACKED 1979-1990 AVERAGE

by Cap Allon, February 10, 2020 in Electroverse


According to official government data from the National Snow & Ice Data Center (NSIDC), Antarctic Sea Ice Extent is currently tracking the 1979-1990 average:

In addition, Jan 2020’s extent exceeded that of 2019, 2018, 2017, 2016, 2011, 2007, 2006, 2005, 2000, 1997, 1993, 1992, 1988, 1985, 1984, 1981, and 1980.


NO CORRELATION BETWEEN CO2 AND SEA ICE EXTENT

Since 1979 — the year sea ice satellite measurements began — CO2 readings taken at the Mauna Loa Observatory in Hawaii have been on an unnaturally linear rise. While, during the same period, Antarctic Sea Ice Extent has been “extremely variable” with “the yearly minimum hitting both record highs and lows” — NOAA (climate.gov)

Media’s Horribly Dishonest Antarctica Propaganda

by Jim Steele, February 9, 2020 in WUWT


The current context for the Antarctica Peninsula is that for over a decade it has experienced cooling temperatures driven by natural variability. In fact, glaciers in Esperanza’s region have also expanded. Esperanza’s record temperature simply happened due to foehn winds despite a cooling trend. Unfortunately, the media would rather scare the public to promote a climate crisis, than honestly educate them about the causes of natural climate variability.

Bloomberg It’s T-Shirt Weather in Antarctica as Temperature Breaks Record

by L.M. Lombrana, February 8, 2020
in NotaLotofPeopleKnowThat/Bloomberg


When one day’s weather is climate!
Paul Homewood

(Bloomberg) — The temperature at one research base in Antarctica reached a record-breaking 18.3 degrees Celsius (65 Fahrenheit) on Thursday, almost a full degree above the previous high set five years ago.

Argentine scientists on the Esperanza base who confirmed the reading said that wasn’t the only record broken this week. The nation’s Marambio site registered the highest temperature for the month of February since 1971. Thermometers there hit 14.1 Celsius, above the previous February 2013 reading of 13.8 Celsius.

The reports are shocking, but not surprising, said Frida Bengtsson, who is leading a expedition to the Antarctic for the environmental group Greenpeace.

Climatologie actuelle, un (petit) pas vers plus de réalisme ?

by SCE-INFO, 7 février 2020 in ScienceClimatEnergie


Nature, l’une des plus célèbres revues scientifiques à l’échelle mondiale, vient de publier un article assez inattendu. Celui-ci se permet une analyse critique des scénarios climatiques proposés dans les rapports du GIEC (scénarios RCP, i.e. “Representative Concentration Pathways”). Comme on peut le constater chaque jour en consultant les médias, ce sont toujours les scénarios les plus catastrophiques qui sont relayés. Continuer la lecture de Climatologie actuelle, un (petit) pas vers plus de réalisme ?

Economic impact of energy consumption change caused by global warming

by P. Lange & K. Gregory, February 8, 2020 in ClimateEtc.


A new paper ‘Economic impact of energy consumption change caused by global warming’ finds global warming may be beneficial.

In this blog post we reproduce the Abstract, Policy Implications and Conclusions and parts of the Introduction, Results and Discussion. We encourage you to read the entire paper.

Abstract: This paper tests the validity of the FUND model’s energy impact functions, and the hypothesis that global warming of 2 °C or more above pre-industrial times would negatively impact the global economy. Empirical data of energy expenditure and average temperatures of the US states and census divisions are compared with projections using the energy impact functions with non-temperature drivers held constant at their 2010 values. The empirical data indicates that energy expenditure decreases as temperatures increase, suggesting that global warming, by itself, may reduce US energy expenditure and thereby have a positive impact on US economic growth. These findings are then compared with FUND energy impact projections for the world at 3 °C of global warming from 2000. The comparisons suggest that warming, by itself, may reduce global energy consumption. If these findings are correct, and if FUND projections for the non-energy impact sectors are valid, 3 °C of global warming from 2000 would increase global economic growth. In this case, the hypothesis is false and policies to reduce global warming are detrimental to the global economy. We recommend the FUND energy impact functions be modified and recalibrated against best available empirical data. Our analysis and conclusions warrant further investigation.

“CODE RED” BLIZZARDS BURY PARTS OF EASTERN EUROPE, WITH ENTIRE CITIES “UNDER SIEGE”

by Cap Allon, February 8, 2020 in Electroverse


Ukraine and Romania were two of the hardest hit Eastern European nations during last week’s extreme winter weather.

In Romania’s capital Bucharest, the severe blizzard has reportedly felled more than 100 trees — many falling onto roads and vehicles — while billboards, traffic lights, and “construction elements” were also toppled, according to the Bucharest-Ilfov Emergency Inspectorate.

450+ schools were closed across the country on Feb. 6 and 7 due to the heavy snowfall, and public transport was cancelled following an incident with a bus colliding with a tram in icy conditions.

New Study: Greenland Was ‘4–5 °C Warmer Than Today’ ~9000 Years Ago…When The Arctic Was Nearly Sea-Ice Free

by Syring et al., February 6, 2020 in NoTricksZone


Scientists (Syring et al., 2020) find almost sea ice-free conditions pervaded a much warmer northern Greenland region during the Early Holocene.  Arctic sea ice extent has “continuously” grown for ~4800 years, with modern conditions a bit lower than the peak of the last few centuries.


In a new paper (Syring et al., 2020), scientists rely on biomarker evidence – (a) the presence of warmth-demanding species Armeria scabra and Mytilus edulis, and (b) IP25, a proxy for the presence or absence of sea ice – to suggest not only were there much warmer (4 to 5°C) northern Greenland temperatures 10,000 to 8500 years ago, but effectively sea ice-free conditions pervaded the region during this time.

The sea ice in the region has been growing “continuously” for the last 4800 years, reaching its peak during the last millennium.

The authors also find decadal- and centennial-scale periodicities in solar activity have coincided with variability in Arctic sea ice (IP25) throughout the Holocene.

GREENLAND’S SMB GAINED 7 GIGATONS YESTERDAY

by Cap Allon, February 7, 2020 in Electroverse


Despite decades of doom-and-gloom prophecies, Greenland’s Ice Sheet is currently GAINING monster amounts of “mass”— 7 gigatons yesterday alone (Feb. 06, 2020).

Crucial to the survival of a glacier is its surface mass balance (SMB)–the difference between accumulation and ablation (sublimation and melting). Changes in mass balance control a glacier’s long-term behavior, and are its most sensitive climate indicators (wikipedia.org).

On the back of substantial SMB gains over the past few years, the Greenland ice sheet looks set to continue that trend in 2019-20. On February 06, 2020, the world’s largest island added a monster 7 gigatons to its ice sheet. According to climate alarmists, this simply shouldn’t be happening in a warming world. In fact, it might as well not be happening–developments like this NEVER receive MSM attention, meaning alarmists are NEVER privy to the full and unalarming picture…

http://polarportal.dk/en/greenland/

Global Fossil Fuel Emissions Up 0.6% In 2019

by P. Homewood, February 6, 2020 in NotaLotofPeopleKnowThat


Emissions from fossil fuel and industry (FF&I) are expected to reach 36.81bn tonnes of CO2 (GtCO2) in 2019, up by only 0.24GtCO2 (0.6%) from 2018 levels, according to the latest estimates from the Global Carbon Project (GCP).

The data is being published in Earth System Science Data Discussions, Environmental Research Letters and Nature Climate Change to coincide with the UN’s COP25 climate summit in Madrid, Spain.

The growth of global emissions in 2019 was almost entirely due to China, which increased its CO2 output by 0.26GtCO2. The rest of the world actually reduced its emissions by -0.02GtCO2, thanks to falling coal use in the US and Europe, as well as much more modest increases in India and the rest of the world, compared to previous years.

The GCP researchers say that “a further rise in emissions in 2020 is likely” as global consumption of natural gas is “surging”, oil use continues to increase and, overall, energy demand rises.

Despite the rapid rise and falling costs of renewables in many parts of the world, the majority of increases in energy demand continue to be met by fossil fuels. For example, gas met around two-fifths of the increase in demand in 2018, against just a quarter coming from renewables.

Overall, human-caused CO2 emissions, including those from FF&I and land use, are projected to increase by 1.3% in 2019. This is driven by a 0.29GtCO2 (5%) increase in land-use emissions – including deforestation –  which is the fastest rate in five years. While land use only represents around 14% of total 2019 emissions, it will contribute more than half the increase in emissions in 2019.

While more modest than in recent years, the increase in emissions in 2019 puts the world even further away from meeting its climate change goals under the Paris Agreement.

Nature Has Been Removing Excess CO2 4X Faster than IPCC Models

by Dr. Roy Spencer, February 5, 2020 in WUWT


Note: What I present below is scarcely believable to me. I have looked for an error in my analysis, but cannot find one. Nevertheless, extraordinary claims require extraordinary evidence, so let the following be an introduction to a potential issue with current carbon cycle models that might well be easily resolved by others with more experience and insight than I possess.

Summary

Sixty years of Mauna Loa CO2 data compared to yearly estimates of anthropogenic CO2 emissions shows that Mother Nature has been removing 2.3%/year of the “anthropogenic excess” of atmospheric CO2 above a baseline of 295 ppm. When similar calculations are done for the RCP (Representative Concentration Pathway) projections of anthropogenic emissons and CO2 concentrations it is found that the carbon cycle models those projections are based upon remove excess CO2 at only 1/4th the observed rate. If these results are anywhere near accurate, the future RCP projections of CO2, as well as the resulting climate model projection of resulting warming, are probably biased high.


Introduction

My previous post from a few days ago showed the performance of a simple CO2 budget model that, when forced with estimates of yearly anthropogenic emissions, very closely matches the yearly average Mauna Loa CO2 observations during 1959-2019. I assume that a comparable level of agreement is a necessary condition of any model that is relied upon to predict future levels of atmospheric CO2 if it is have any hope of making useful predictions of climate change.

In that post I forced the model with EIA projections of future emissions (0.6%/yr growth until 2050) and compared it to the RCP (Representative Concentration Pathway) scenarios used for forcing the IPCC climate models. I concluded that we might never reach a doubling of atmospheric CO2 (2XCO2).

But what I did not address was the relative influence on those results of (1) assumed future anthropogenic CO2 emissions versus (2) how fast nature removes excess CO2 from the atmosphere. Most critiques of the RCP scenarios address the former, but not the latter. Both are needed to produce an RCP scenario.

I implied that the RCP scenarios from models did not remove CO2 fast enough, but I did not actually demonstrate it. That is the subject of this short article.

What Should the Atmospheric CO2 Removal Rate be Compared To?

Continuer la lecture de Nature Has Been Removing Excess CO2 4X Faster than IPCC Models

The Insignificance of Greenland’s Ice Mass Loss in Five Easy Charts…

by David Middleton, February 5, 2020 in WUWT


This is a sort of a spin-off of Rutgers University Global Snow Lab and “the Snows of Yesteryear” and A Geological Perspective of the Greenland Ice Sheet. And, yes, there are a lot more than five charts in this post… And, none of them were all that easy.

Introduction

There is a general scientific consensus that the Greenland Ice Sheet (GrIS) has been losing ice mass since the Little Ice Age (LIA). This should come as no surprise, since the LIA was quite likely the coldest climatic episode of the Holocene Epoch. Although it does appear that the GrIS may have gained ice mass during the mid-20th century global cooling crisis.

According to Mouginot et al, 2019, the GrIS was gaining an average of +47 ± 21 Gt/y from 1972–1980, then began to lose ice mass after 1980:

  • -51 ± 17 Gt/y from 1980–1990

  • -41 ± 17 Gt/y from 1990–2000

  • -187 ± 17 Gt/y from 2000–2010

  • -286 ± 20 Gt/y from 2010–2018


Figure 4. Central Greenland temperature reconstruction (Alley, 2000).

Japan Races to Build New Coal-Burning Power Plants, Despite the Climate Risks

by Hiroko Tabuchi, February 5, 2020 in TheNewYorkTimes


It is one unintended consequence of the Fukushima nuclear disaster almost a decade ago, which forced Japan to all but close its nuclear power program. Japan now plans to build as many as 22 new coal-burning power plants — one of the dirtiest sources of electricity — at 17 different sites in the next five years, just at a time when the world needs to slash carbon dioxide emissions to fight global warming.

Earth about to enter 30-YEAR ‘Mini Ice Age’ with -50C temperatures in coldest regions, scientists warn

by Harry Pettit, February 2, 2020 in TheSun


Earth is bracing for a solar minimum: a quiet period in which the Sun fires less energy – or, heat – at our planet than usual.

According to Nasa, the Sun will reach its lowest activity in over 200 years in 2020.

This could cause average temperatures to drop as much as 1C in a cold spell lasting 12 months, according to Northumbria University expert Valentina Zharkova.

That might not sound like much, but a whole degree is very significant for global average temperatures.

However, Professor Zharkova warned icy spells and wet summers could persist until solar activity picks up again in 2053.

She listed recent unusual chills in Canada and Iceland as evidence of the Grand Solar Minimum (GSM) already taking hold.

“The reduction in temperature will results in cold weathers on Earth, wet and cold summers, cold and wet winters,” she told The Sun.

“We will possibly get big frosts as is happening now in Canada where they see [temperatures] of -50C.

Longest-Ever S. Hemisphere Tree-Ring Reconstruction Finds The 1700s-1800s Were Warmer Than Today

by  K. Richard, February 3, 2020  in NoTricksZone


A new 5680-year tree-ring temperature reconstruction for southern South America (Lara et al., 2020) reveals (a) no clear warming trend in recent decades, and (b) the 18th and 19th centuries (and many centennial-scale periods from the last 5680 years) had much warmer temperatures than today.

In addition to finding modern temperature changes in southern South America fall well within the range of natural variability in the context of the last 5680 years, Lara et al. (2020) assess solar forcing to have contributed to climate variations for this region of the Southern Hemisphere.

Will Humanity Ever Reach 2XCO2? Possibly Not

by Dr. Roy Spencer, February 2, 2020 in WUWT


Summary

The Energy Information Agency (EIA) projects a growth in energy-based CO2 emissions of +0.6%/yr through 2050. But translating future emissions into atmospheric CO2 concentration requires a global carbon budget model, and we frequently accept the United Nations reliance on such models to tell us how much CO2 will be in the atmosphere for any given CO2 emissions scenario. Using a simple time-dependent CO2 budget model forced with yearly estimates of anthropogenic CO2 emissions and optimized to match Mauna Loa observations, I show that the EIA emissions projections translate into surprisingly low CO2 concentrations by 2050. In fact, assuming constant CO2 emissions after 2050, the atmospheric CO2 content eventually stabilizes at just under 2XCO2.

Introduction

I have always assumed that we are on track for a doubling of atmospheric CO2 (“2XCO2”), if not 3XCO2 or 4XCO2. After all, humanity’s CO2 emissions continue to increase, and even if they stop increasing, won’t atmospheric CO2 continue to rise?

It turns out, the answer is probably “no”.

The rate at which nature removes CO2 from the atmosphere, and what controls that rate, makes all the difference.

Even if we knew exactly what humanity’s future CO2 emissions were going to be, how much Mother Nature takes out of the atmosphere is seldom discussed or questioned. This is the domain of global carbon cycle models which we seldom hear about. We hear about the improbability of the RCP8.5 concentration scenario (which has gone from “business-as-usual”, to “worst case”, to “impossible”), but not much about how those CO2 concentrations were arrived at from CO2 emissions data.

So, I wanted to address the question, What is the best estimate of atmospheric CO2 concentrations through the end of this century, based upon the latest estimates of future CO2 emissions, and taking into account how much nature has been removing from the atmosphere?

As we produce more and more CO2, the amount of CO2 removed by various biological and geophysical processes also goes up. The history of best estimates of yearly anthropogenic CO2 emissions, combined with the observed rise of atmospheric CO2 at Mauna Loa, Hawaii, tells us a lot about how fast nature adjusts to more CO2.