Observations historiques d’inondations jusqu’à la fin du 19ème siècle (première partie)

by IRM, 2020


Nos observations historiques d’inondations font l’objet de trois articles. Voici le premier qui traite des inondations jusqu’à la fin du 19ème siècle.

En août 2019, nous avons introduit la possibilité d’envoyer vos propres observations via notre application météo. Cette nouvelle fonctionnalité semble avoir plu aux utilisateurs de notre app, puisque nous avons reçu près de 600.000 observations jusqu’à présent ! Etant donné ce succès, nous avons décidé en avril 2020 d’y ajouter deux nouveaux types d’observations à rapporter : les inondations et les phénomènes optiques. Ces phénomènes ont été observés de tous temps, c’est pourquoi nous avons décidé de nous plonger dans plus d’un millénaire d’anciennes observations de halos et d’arcs-en-ciel. Dans ce nouvel article, vous trouverez quelques observations d’inondations telles qu’elles ont été perçues et décrites dans d’anciens manuscrits, livres et journaux publiés en Europe de l’Ouest jusqu’au 19ème siècle.

Caricature représentant l’actuelle place Saint-Géry, lors de l’inondation de janvier 1820, Collection iconographique (ref. K-573), Archives de la Ville de Bruxelles.


See also Observations historiques d’inondations (deuxième partie)

and Observations historiques d’inondations (troisième partie)

Podcast: Why the Oceans Really Aren’t “Acidifying” but the Term Is Being Abused by Science and Media

by A. Watts, June 11, 2020 in WUWT


Science and media outlets claim ocean acidification is happening due to increased carbon dioxide in the atmosphere. But objective data show the ocean is far from acidic according to Dr. Caleb Rossiter, executive director of the CO2 Coalition and a statistician who has studied climate change closely.

Host Anthony Watts and Rossiter talk about how a pH of 7 is considered neutral, with anything below 7 considered acidic. Ocean pH averages 8.1, which is alkaline rather than acidic. Although climate models suggest the ocean’s surface pH may have dropped from pH 8.2 to 8.1 since 1750, that change was never actually measured.

The pH drop from 1850 is merely a modeled conjecture. The concept of pH was first introduced by in 1909, and agriculturalists first developed field instruments to measure pH in the 1930s.

ASTONISHING, RECORD-BREAKING GAINS CONTINUE ACROSS THE GREENLAND ICE SHEET — MSM SILENT

by Cap Allon, June 11, 2020 in Electroverse


The month of June is breaking records across the Greenland ice sheet, and not records for warmth and melt –as the mainstream media have trained you to expect– but new benchmarks for COLD and GAINS.

The SMB gains occurring right now across Greenland are truly astonishing.

Data-driven FACTS reveal vast regions to the south have been GAINING RECORD/NEAR-RECORD LEVELS of snow & ice all month.

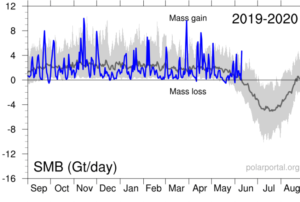
Never before in June has the Greenland ice sheet grown by more than 4 Gigatons in a single day (since 1981 when DMI records began), but now the past week has gone and delivered two such days — June 3, and now yesterday, June 10.

In fact, yesterday’s gains actually neared 5 Gts — you can see from the chart below how anomalous that gain is for the time of year:


Blue line (Gt/day): total daily contribution to the SMB from the entire ice sheet. Grey line: mean value from 1981-2010 (DMI).

DWD Reverses: Admits Data From Germany’s Infamous Ultra-Hot Lingen Weather Station Need To Be Rechecked

by P. Gosselin, June10, 2020 in NoTricksZone


Recently I wrote here how Germany’s now infamous record-setting weather station in Lingen was producing readings that were 2-3°C hotter than surrounding stations, yet the German DWD weather service refused to acknowledge the station was likely producing bad data. Today they admit the station has problems and that they will be moving it to a better location.

Last year’s all-time record high is now in question.

Lingen’s heated readings

Last summer the Lingen station, located in northwest Germany near the Dutch border, smashed the country’s all-time record high when the ‘mercury’ rose to a scorching 42.6°C during a late July heat wave. The previous all-time high for Germany was a comparatively cool 40.3°C.


Lingen’s readings of late July 2019 compared to other stations in the surrounding region (July 23 – July 27).