by M. Rectenwald, Oct 12, 2022 in ClimateChangeDispatch
It does this by pathologizing said subjects and their views.
For example, the field has been mobilized to discredit so-called conspiracy theorists by attempting to identify the mistaken mental processes that conspiracy theorists exhibit. [bold, links added]
The methods and results of such studies have proven to be less than stellar, to say the least.
Now, the field is also being wielded to discredit “climate change deniers.”1 By pathologizing the thinking processes of these stubbornly mistaken subjects, the views of said subjects can be safely dismissed.
After all, the theory of anthropogenic climate change (ACC) is obviously true, or so says the Intergovernmental Panel on Climate Change (IPCC), the planetary authority on the matter.
Likewise, those who doubt or deny ACC must be crazy. The point of psychological studies is to discover just what is wrong with these people and how, if possible, to change their minds.
Believing in a causal connection between a questionable climate change theory and these phenomena must be perfectly rational, according to this kind of research.
Such is the thrust of a recent study of Australian climate change skeptics conducted by a lecturer in psychology and a professor of geology at the University of the Sunshine Coast.
Entitled “Associations of Locus of Control, Information Processing Style and Anti-reflexivity with Climate Change Scepticism in an Australian Sample,” the study examines climate change skeptics in terms of thinking styles rather than “values” and “sociodemographic” factors.
Since past research has found values and sociodemographic factors to be intractable, the researchers in this study seek to identify factors that presumably can be changed and that should likewise prove useful for the study.
by P. Driessen, Oct 10, 2022 in ClimateChangeDispatch
Hurricane Ian is in the history books, having unleashed its Category 4 fury on southwestern Florida.
Even as the area slowly digs out and rebuilds, the devastation and tragedies will linger in reality and memories.
Ian was the latest of 123 hurricanes to hit the Sunshine State since official recordkeeping began in 1851. But unsurprisingly, some wasted no time trying to link Ian to the most dominant issue of our time. [bold, links added]
Ian should have “finally ended” the debate about “whether there’s climate change,” President Biden stated, as he assessed damage along Florida’s Gulf Coast with Governor and First Lady DeSantis.
The newest fearmongering is slightly more sophisticated. Now hurricanes are gaining strength more rapidly because of fossil fuels. The phenomenon even has a fancy name: “rapid intensification.”
This clever claim cannot be proven or disproven, because we didn’t have technologies to measure how rapidly certain storms intensified even a few decades ago.
A major survey into the accuracy of climate models has found that almost all the past temperature forecasts between 1980-2021 were excessive compared with accurate satellite measurements. The findings were recently published by Professor Nicola Scafetta, a physicist from the University of Naples. He attributes the inaccuracies to a limited understanding of Equilibrium Climate Sensitivity (ECS), the number of degrees centigrade the Earth’s temperature will rise with a doubling of carbon dioxide.
Scientists have spent decades trying to find an accurate ECS number, to no avail. Current estimates range from 0.5°C to around 6-7°C. Without knowing this vital figure, the so-called ‘settled’ science narrative around human-caused climate change remains a largely political invention, not a credible scientific proposition. Professor Scafetta has conducted extensive work into climate models and is a long-time critic of their results and forecasts. In a previous work, he said many of the climate models should be “dismissed and not used by policymakers”. Along with around 250 professors, he is a signatory to the World Climate Declaration which states there is no climate emergency and also notes climate models are “not remotely plausible as global tools”.
Scafetta’s latest work grouped 38 major climate models into low, medium and high ECS values, ranging between 1.8°C and 5.7°C. He found that models in the medium and high category “ran hot” in over 95% and 97% of cases respectively. The lower models were said to have done better when compared to global warming calculated for the period by the major surface datasets of 0.52-0.58°C. But the UAH satellite data showed warming up to 30% less during this period, suggesting even the low warming models produced “excessive warming” from 1980-2021.
According to Scafetta, these results are showed that the ECS figure could be as low as 1.2-2°C. Particular concern is expressed about surface temperature records that “appear to be severely affected by non-climatic warming biases”. Scafetta concludes that surface-based temperature records are likely to be affected by warming biases, such as the urban heat island effect due to expanding urban development, and subject to natural oscillations that are not reproduced by climate models. He concludes: “The global warming expected for the next few decades may be even more moderate than predicted by the low ECS-GCMs [Global Circulation Models], and could easily fall within a safe temperature range where climate adaptation policies will suffice.”
The United Nations revealed that they “own the science” of climate change and they have manipulated Google search results to suppress any climate view that deviates from UN claims. Melissa Fleming, the Under-Secretary for Global Communications at the United Nations made the remarks at a World Economic Forum ‘Tackling Disinformation’ event on September 29, 2022 titled “Sustainable Development Impact Meetings 2022.”
Melissa Fleming: (Full Video) “We partnered with Google. For example, if you Google ‘climate change,’ you will, at the top of your search, you will get all kinds of UN resources. We started this partnership when we were shocked to see that when we Googled ‘climate change,’ we were getting incredibly distorted information right at the top. So we’re becoming much more proactive. We own the science, and we think that the world should know it, and the platforms themselves also do. But again, it’s a huge, huge challenge that I think all sectors of society need to be very active in.” (Full transcript here)
As I wrote in my book, The Great Reset, “the public health bureaucracy and the ‘climate community’ have become political lobbying organizations, and they are using ‘The Science’ to support their preferred policies—policies that dovetail with the Great Reset and advance the power of the administrative state.”
by P. Homewood, Oct 8, 2022 in NotaLotofPeopleKnowThat
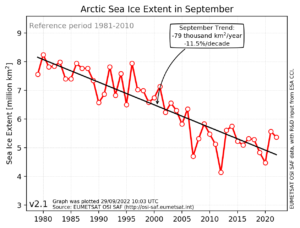
We looked at the Arctic sea ice minimum for this year a couple of weeks ago. But the average for September as a whole is much more relevant.
In fact it shows very similar results this year, with average September extent slightly below last year, but otherwise the highest since 2014, and also much greater than in 2007:
Note the grossly misleading trend line, loved by all Arctic alarmists! Their trend cannot conceal the fact that the ice extent stopped declining in 2007.
The ice could remain stable for the next century, but DMI’s overall trend line would still show a long term decline decline.
The New Pause, having paused a month ago, has now lengthened again: this time to exactly eight years. As always, the Pause is calculated as the longest period for which the least-squares linear-regression trend up to the most recent month for which the UAH global mean surface temperature anomaly is available is zero.
…
…
The trend on the entire dataset during the 526 months from December 1978 to September 2022 is 0.95 C°, equivalent to only 1.34 C°/century. So slow a rate of warming is well within the natural variability of the climate, and is proving net-beneficial.
…
The New Pause has grown to fully eight years in length at a most embarrassing point for true-believers: for the cost to the West of the economically suicidal policies that they have long advocated is now becoming all too painfully apparent, just as it is also ever more evident that the warming since 1990 is well below half the midrange prediction made by IPCC that year.
SEPTEMBER 30, 2022 Advances in technology led to record new well productivity in the Permian Basin in 2021
The Permian Basin in western Texas and eastern New Mexico is one of the world’s most prolific unconventional oil- and natural gas-producing regions. The Permian Basin has become more productive because of the technological advancements in drilling and completion techniques, which allow operators to economically extract hydrocarbons from the low permeability reservoirs.
The stacked reservoirs of the Permian Basin, and the Delaware and Midland subbasins within it, vary in thickness and depth. Improved geological understanding, known as subsurface delineation, helps operators place wells to optimize well spacing in the most productive areas.
The Permian Basin has produced oil and associated natural gas from vertical wells for decades. Since 2010, advances in hydraulic fracturing and horizontal drilling led to rapid production growth. The number of new horizontal wells increased to 4,524 in 2021, compared with 350 in 2010. In June 2022, the Permian Basin accounted for about 43% of U.S. crude oil production and 17% of U.S. natural gas production (measured as gross withdrawals).
The length of a well’s horizontal section, or lateral, is a key factor in well productivity. In the Permian Basin, average well horizontal length has increased to more than 10,000 feet in the first nine months of 2022, compared with less than 4,000 feet in 2010.
Over the last several weeks, many mainstream news media outlets have claimed that hurricanes are becoming more expensive, more frequent, and more intense because of climate change. [bold, links added]
• The Financial Timesreported that “hurricane frequency is on the rise.”
• The New York Timesclaimed, “strong storms are becoming more common in the Atlantic Ocean.”
• The Washington Postsaid, “climate change is rapidly fueling super hurricanes.”
• ABC Newsdeclared, “Here’s how climate change intensifies hurricanes.”
The increasing cost of hurricane damage can be explained entirely by more people and more property in harm’s way. Consider how much more developed Miami Beach is today compared to a century ago. Once you adjust for rising wealth, there is no trend of increasing damage.
“After adjusting for a likely undercount of hurricanes in the pre-satellite era,” writes NOAA, “there is essentially no long-term trend in hurricane counts. The evidence for an upward trend is even weaker if we look at U.S. landfalling hurricanes, which even show a slight negative trend beginning from 1900 or from the late 1800s.”
What’s more, NOAA expects a 25% decline in hurricane frequency in the future.
by P. Homewood, Oct 4, 2022 in NotaLotofPeopleKnowThat
…
…
Because the data is compiled from the same EM-DAT database, the annual number of deaths shows an uptick from the 1990s to the 2000s. It is clear though that disaster-related deaths from extreme weather have been falling since the 1920s and are now approaching zero. This is due as much to improved planning, more robust structures and early warning systems, as it is to diminishing numbers of natural disasters. And, as can be seen from the figure, it is earthquakes – entirely natural events – that have been the deadliest disasters over the last two decades.
Ignoring all the evidence, however, the press release accompanying the latest WMO report proclaims that “Climate science is clear: we are heading in the wrong direction,” the UN Secretary-General adding, with characteristic hype, that the report “shows climate impacts heading into uncharted territory of destruction.”
A more detailed discussion of the erroneous claims of both CRED and the WMO can be found in my two most recent reports on weather extremes (here and here).
There are four main reasons why Antarctica’s Larsen C Ice Shelf may be melting. None of them involve human forcing or CO2 concentration changes.
Scientists have recently completed an exhaustive 20-year study of the “most significant causes of melting” of the Larsen C Ice Shelf in the Antarctic Peninsula. They have concluded the 4 main surface melt drivers are:
1. Shortwave solar radiation.
2. Foehn wind variations.
3. Cloud cover changes.
4. Natural circulation variations (SAM, ENSO).
Neither anthropogenic forcing nor CO2 emissions are listed as causal factors in Antarctic ice melt processes.
…
In other words, there is nothing even remotely unusual about any Antarctic ice melt or climate trends that cannot be explained by or attributed to natural, non-anthropogenic processes.
I won’t reprint the whole list, but it’s worth a read.
The list certainly is not all-inclusive. There are many more which could have been added, such as the 150 mph Indianola hurricane in 1886, and Carla in 1961, the 8th and 9th most intense hurricanes on record.
But the list gives a good impression of how catastrophic US hurricanes have always been.
The timeline I have prepared below just covers the period 1900 to 1969 and summarises just how frequent these disastrous hurricanes actually are.
Greenland’s climate changes are remarkably uncorrelated with climate model expectations and changes in atmospheric CO2.
When CO2 levels were in the mid-200s parts per million (11.7 to 4.5 thousand years ago) the Arctic and northern Greenland were 2-4°C warmer than now, ice margins were 80 km behind today’s, ice-free open water conditions prevailed, and Greenland warmed 10°C in just 60 years (Elnegaard Hansen et al., 2022).
…
Past interglacial CO2 levels of only 280 ppm were associated with a “nearly ice free” Greenland and the presence of flora and fauna in subarctic terrestrial environments 1000 km northwards of where they can survive today, implying “at least 5°C higher temperatures” (Bennike and Böcher, 2021). Summer sea water temperatures were as much as “7-8°C higher than at present”.
With Hurricane Ian (now a tropical storm) exiting the east coast of Florida, there is no shortage of news reports tying this storm to climate change. Even if those claims actually include data to support their case, those data are usually for cherry-picked regions and time periods. If global warming is causing a change in tropical cyclone activity, it should show up in global statistics.
The latest peer-reviewed study (March 2022, here) of the accumulated wind energy in tropical cyclones since 1990 (when we started have sufficient global data) showed a decrease in hurricane activity. There was an increase in Atlantic activity, but this was matched by an even larger decrease in Pacific activity, due to a shift from El Nino to La Nina conditions during that time.
So, yes, there is climate change involved in the uptick in Atlantic activity in recent decades. But it’s natural.
Looking at just the numbers of global hurricanes since 1980, we see no obvious trends.
The so-called hiatus in global annual average temperature between 2002 – 2014, once controversial to some but now well-established in the peer-reviewed literature, ended in 2014 with the start of a series of record-breaking El Nino events that spiked global temperature with a subsequent fall-back. Now a new study into the effect of man-made aerosol pollution adds to likely reasons for the end of the hiatus, and may point to lower estimates for future global warming.
An international research team writing in the journal Atmospheric Chemistry and Physics, uses satellite data to show that concentrations of aerosol particles have decreased significantly since 2000. This is good news as cleaner air benefits health, but it also reduces particles’ which have a cooling effect on the terrestrial climate.
According to the Intergovernmental Panel on Climate Change (IPCC), by 2019 the global temperature had risen by 1.1 degrees Celsius compared to pre-industrial levels due to increasing greenhouse gasses from burning fossil fuels. At the same time the combustion of fossil fuels emit aerosols which cool our climate by reflecting sunlight and increasing the reflectivity of clouds.
Professor Johannes Quaas, a meteorologist at Leipzig University, and colleagues from Europe, China, and the US have published robust observational evidence of significant reduction of aerosol pollution and improved global air quality.
…
La géologie, une science plus que passionnante … et diverse