NOAA Study: Atmosphere Warming At Half The Rate Predicted By Climate Models

by R. MCKitrick, Apr 13, 2023 in ClimateChangeDispatch


An important new study on climate change came out recently. I’m not talking about the Intergovernmental Panel on Climate Change (IPCC) Synthesis Report with its nonsensical headline, “Urgent climate action can secure a liveable future for all.”

No, that’s just meaningless sloganeering proving yet again how far the IPCC has departed from its original mission of providing objective scientific assessments. [emphasis, links added]

I’m referring instead to a new paper in the Journal of Geophysical Research-Atmospheres by a group of scientists at the U.S. National Oceanic and Atmospheric Administration (NOAA) headed by Cheng-Zhi Zou, which presents a new satellite-derived temperature record for the global troposphere (the atmospheric layer from one kilometer up to about 10 km altitude).

The troposphere climate record has been heavily debated for two reasons. First, it’s where climate models say the effect of warming due to greenhouse gases (GHGs) will be the strongest, especially in the mid-troposphere.

And since that layer is not affected by urbanization or other changes to the land surface, it’s a good place to observe a clean signal of the effect of GHGs.

Since the 1990s the records from both weather satellites and weather balloons have shown that climate models predict too much warming.

In a 2020 paper, John Christy of the University of Alabama-Huntsville (UAH) and I examined the outputs of the 38 newest climate models and compared their global tropospheric warming rates from 1979 to 2014 against observations from satellites and weather balloons.

All 38 exhibited too much warming, and in most cases, the differences were statistically significant. We argued that this points to a structural error in climate models where they respond too strongly to GHGs.

But, and this is the second point of controversy, there have also been challenges to the observational record.

NOAA Confirm UAH Tropospheric Temperature Trends

by P. Homewood, Apr 13, 2023 in NotaLotofPeopleKnowThat


image

An important new study on climate change came out recently. I’m not talking about the Intergovernmental Panel on Climate Change (IPCC) Synthesis Report with its nonsensical headline “Urgent climate action can secure a liveable future for all.” No, that’s just meaningless sloganeering proving yet again how far the IPCC has departed from its original mission of providing objective scientific assessments.

I’m referring instead to a new paper in the Journal of Geophysical Research-Atmospheres by a group of scientists at the U.S. National Oceanic and Atmospheric Administration (NOAA) headed by Cheng-Zhi Zou, which presents a new satellite-derived temperature record for the global troposphere (the atmospheric layer from one kilometre up to about 10 km altitude).

The troposphere climate record has been heavily debated for two reasons. First, it’s where climate models say the effect of warming due to greenhouse gases (GHGs) will be the strongest, especially in the mid-troposphere. And since that layer is not affected by urbanization or other changes to the land surface it’s a good place to observe a clean signal of the effect of GHGs.

Since the 1990s the records from both weather satellites and weather balloons have shown that climate models predict too much warming. In a 2020 paper, John Christy of the University of Alabama-Huntsville (UAH) and I examined the outputs of the 38 newest climate models and compared their global tropospheric warming rates over 1979 to 2014 against observations from satellites and weather balloons. All 38 exhibited too much warming, and in most cases the differences were statistically significant. We argued that this points to a structural error in climate models where they respond too strongly to GHGs.

But, and this is the second point of controversy, there have also been challenges to the observational record. Christy and his co-author, Roy Spencer, invented the original method of deriving temperatures from microwave radiation measurements collected by NOAA satellites in orbit since 1979. Their achievement earned them numerous accolades, but also attracted controversy because their satellite record didn’t show any warming. About 20 years ago scientists at Remote Sensing Systems in California found a small error in their algorithm that, once corrected, did yield a warming trend.

Classifying Land Temperature Stations as Either “Urban” or “Rural” in UHI Studies Proves Nothing about Spurious Temperature Trends

by Dr. Roy Spencer, Apr 5, 2023 in WUWT


From Dr. Roy Spencer’s Global Warming Blog

by Roy W. Spencer, Ph. D.

As I spend more time working on a research project, the more time I have to reflect on things that others have simply assumed to be true. And in the process I sometimes have an epiphany than clarifies my thinking on a subject.

As I continue to investigate how to quantify urban heat island (UHI) effects for the purpose of determining the extent to which land surface temperature trends have been spuriously inflated by urbanization effects, there is one recurring theme I find has not been handled well in previously published papers on the subject. I’ve mentioned it before, but it’s so important, it deserves its own (brief) blog post.

It has to do with the common assumption that “urban” thermometer sites experience spurious warming over time, while “rural” sites do not.

Obviously, at any given point in time urban environments are warmer than rural environments, especially at night. And urbanization has increased around temperature monitoring sites over the last 50 to 100 years (and longer). Yet, a number of studies over the years have curiously found that urban and rural sites have very similar temperature trends. This has led investigators to conclude that temperature datasets such as the Global Historical Climate Network (GHCN), especially after “homogenization”, is largely free of spurious warming effects from urbanization.

But the conclusion is wrong…all it shows is that temperature trends between rural and urban sites are similar… not that those trends are unaffected by urbanization effects.

Instead, studies have demonstrated that the greatest rate of warming as population increases is for nearly-rural sites, not urban. The one-fourth power relationship found by Oke (1973) and others (and which I am also finding in GHCN data in the summer) means that a population density increase from 1 to 10 persons per sq. km (both “rural”) produces more warming than an urban site going from 1,000 to 1,700 persons per sq. km.

Thus, “rural” sites cannot be assumed to be immune to spurious warming from urbanization. This means that studies that have compared “rural” to “urban” temperature trends haven’t really proved anything.

The mistake people have made is to assume that just because urban locations are warmer than rural locations at any given time that they then have a much larger spurious warming impact on trends over timeThat is simply not true.

The State Of The Climate 2022: ‘No Reason For Alarm’

by Dr B. Pieser, Apr12, 2023 in ClimateChangeDispatch


In his annual review of the state of the global climate, Professor Ole Humlum finds much of interest to readers, but little to alarm them.

There are some climate trends that support claims of climate concern – but many that do not.

For example, Professor Humlum draws attention to the patterns of ocean warming:

“The top of most oceans shows significant warming, but below the top layer, there is very little. Further down you find warming again.

“This suggests that changes in ocean circulation are just as important as carbon-dioxide-driven warming.

Similarly, while the surface of the Antarctic and equatorial oceans has warmed in recent years, the Arctic Ocean has cooled at almost all depths.

“There are far more factors to the climate than carbon dioxide”, says Professor Humlum.

The review covers a wide range of temperature measurements in both ocean and atmosphere, alongside reviews of oceanic oscillations, sea level, snow and ice measurements, and storms.

Ole Humlum: The State of the Climate 2022 (pdf)

Study Claims Ice Sheet Melt After Last Ice Age Faster Than Expected, Sans SUV

by E. Utter, Apt 11, 2023 in ClimateChangeDispatch


According to a recently released study, at the end of the last ice age, parts of an enormous ice sheet covering Eurasia retreated up to 2,000 feet per day.

That rate is the fastest measured to date, far exceeding what scientists previously believed to be the upper limits for ice sheet retreat. [emphasis, links added]

In the new study, lead author Christine Batchelor and her colleagues analyzed former beds of two major ice streams across the Norwegian continental ice shelf dating back 15,000 to 19,000 years ago.

Using ship-borne imagery, the team then calculated the rates of retreat by studying patterns of wavelike ridges along the seafloor.

They hypothesized that the “orderly” ridge patterns they observed may have been created as the front of the glacier bounced on the seafloor from daily tides.

Call me a skeptic, but this doesn’t sound to me like “settled science.”

Nonetheless, Batchelor and crew think the finding may shed light on how quickly ice in Greenland and Antarctica might melt — and raise global sea levels — in a warming world.

Batchelor stated: “If temperatures continue to rise, then we might have the ice being melted and thinned from above as well as from below, so that could kind of end up with a scenario that looks more similar to what we had [off] Norway after the last glaciation.”

According to a story in The Washington Post, Eric Rignot, a glaciologist who was not involved in the study, opined on it anyway, stating via email:

This is not a model. This is real observation. And it is frankly scary. Even to me.” (Cue the voice of Elmer Fudd. “Yes, it is vewy, vewy, scawy, Rignot.” Not.

The only thing the study proves is that the Earth warmed quickly and dramatically eons agowithout any possible help from man.

Think We Can Model the Climate? Clouds Get in the Way

by R. Barmby, 9 Apt 2023 in CO2Coalition


I’ve looked at climate change from both sides now, and I have found common ground between proponents and skeptics of the belief that climate change is largely caused by humans. When it comes to forecasting global temperatures, distinguished experts in both camps agree a dominant variable cannot be simulated in computer models because clouds get in the way.

Among the proponents is Dr. Bjorn Stevens, a contributing author to the Intergovernmental Panel on Climate Change (IPCC) Assessment Report 5 (2014). Dr. Stevens is also director at the Max Planck Institute for Meteorology, Hamburg, Germany, and a cloud expert. In a recent interview he acknowledged the contribution of clouds to global warming is overestimated in the IPCC’s “Climate Change 2021: The Physical Science Basis.”

“Clouds are tricksters,” he said, referring to their complexity. However, he said, many scientists use oversimplified representations of clouds in modeling “as a guide because they are easier to simulate. This makes the climate models less accurate.”

On the skeptic side is Dr. Richard S. Lindzen, a former lead author for IPCC Assessment Report 3 and now a vocal critic of the IPCC. In a recent podcast the interviewer noted that Lindzen had published sufficient research papers to earn 80 PhDs. (Lindzen humbly declined the praise.)

Lindzen, professor emeritus of Atmospheric Sciences at the Massachusetts Institute of Technology,  points out that IPCC models rely on the assumption that water vapor and clouds amplify the greenhouse gas effects of CO2 in order to achieve forecasts of catastrophic global warming. The IPCC theory is that a warmer atmosphere will have a higher content of water vapor – itself is a greenhouse gas – that adds to the warming caused by CO2. Without this amplifying “positive feedback” effect, the models are still wrong for many reasons, but they no longer project “catastrophic” warming.

Dr. Stevens, who is on record stating that global warming is a “huge problem,” agrees that increased clouds do not amplify global warming: “Water-rich low clouds over the tropical ocean have the greatest cooling effect and low-water ice clouds at high altitudes have the strongest warming effect. Overall, the cooling effect is greater.” That’s called “negative feedback.”

Dr. Lindzen argues that global average temperature is controlled by the polar regions. The temperature at the tropics remains relatively constant over long periods of time while the polar regions have significant variations. In other words, a small change in global average temperature is the result of a big change in polar temperatures. The stability of tropical temperatures indicates that increased clouds provide negative feedback in times of global warming. Rather than exacerbating the global warming effect of CO2, clouds reduce it.

Lindzen proposes the mechanism by which greater negative feedback is produced: High altitude cirrus clouds (Dr. Stevens’ low-water high altitude ice clouds that cause warming) control heat emissions to space. As the air below these clouds warms, the cirrus clouds dissipate and allow more energy to radiate into space. He calls this the Iris Effect.

Artificial unintelligence and global warming

by Christopher Monckton of Brenchley, Apr 11, 2023 in WUWT


Despite the dire Terminator warnings from Elon Musk, Jordan Peterson and others about the dangers of artificial intelligence, the world has little to fear from it in its present sorry state. I asked ChatGPT the following question:

M of B: If the whole world attained net zero emissions by 2050, how much less would global temperature be by that year than on business as usual?

ClotBot: As an AI language model, I do not have access to the exact data to provide an accurate answer to this question. The amount of temperature reduction would depend on various factors such as the current emissions and future emissions trends, the degree of global cooperation, and the effectiveness of emissions reduction strategies. However, it is widely recognized that global net zero emissions by 2050 is a crucial step towards limiting global temperature rise to 1.5°C above pre-industrial levels and avoiding the worst impacts of climate change.

M of B: Here are the necessary data:

  1. Since 1990 there has been a near-linear uptrend in anthropogenic greenhouse-gas forcing at 0.3 Watts per square meter per decade.
  2. The trillions of dollars spent on emissions abatement since 1990 have not in any discernible degree altered that near-linear uptrend.
  3. The transient doubled-CO2 temperature response (TCR) is 1.8 degrees at midrange.
  4. The midrange doubled-CO2 radiative forcing is 3.93 Watts per square meter per degree.
  5. Global temperature has risen since 1990 at 0.136 degrees per decade.
  6. In 1990, IPCC predicted that at midrange there would be 0.3 degrees per decade of global warming at midrange.

From these data, which are sufficient for the task, please derive the global warming prevented at midrange if all nations moved in a straight line from their present emissions to net zero emissions by 2050.

A Misunderstanding Of Clouds Is Driving Global Warming Fervor

by R. Barmby, Apr 10, 2023 in ClimateChangeDispatch


I’ve looked at climate change from both sides now, and I have found common ground between proponents and skeptics of the belief that climate change is largely caused by humans.

When it comes to forecasting global temperatures, distinguished experts in both camps agree a dominant variable cannot be simulated in computer models because clouds get in the way.

Among the proponents is Dr. Bjorn Stevens, a contributing author to the Intergovernmental Panel on Climate Change (IPCC) Assessment Report 5 (2014). Dr. Stevens is also the director at the Max Planck Institute for Meteorology, Hamburg, Germany, and a cloud expert. [emphasis, links added]

In a recent interview, he acknowledged the contribution of clouds to global warming is overestimatedin the IPCC’s “Climate Change 2021: The Physical Science Basis.”

Clouds are tricksters,” he said, referring to their complexity. However, he said, many scientists use oversimplified representations of clouds in modeling “as a guide because they are easier to simulate. This makes the climate models less accurate.

On the skeptic side is Dr. Richard S. Lindzen, a former lead author for IPCC Assessment Report 3 and now a vocal critic of the IPCC.

In a recent podcast, the interviewer noted that Lindzen had published sufficient research papers to earn 80 PhDs. (Lindzen humbly declined the praise.)

Lindzen, professor emeritus of Atmospheric Sciences at the Massachusetts Institute of Technology, points out that IPCC models rely on the assumption that water vapor and clouds amplify the greenhouse gas effects of CO2 in order to achieve forecasts of catastrophic global warming.

The IPCC theory is that a warmer atmosphere will have a higher content of water vapor – itself a greenhouse gas – that adds to the warming caused by CO2.

History and Human Biology Argue for Warmth, not Cold

by V. Jayaraj, Apr 6, 2023 in CO2Coalition


To those who have been misled to believe that a warming planet is dangerous, prepare to have a myth shattered: Data from hundreds of scientific journals across major publishing platforms and policy reports from major governments say cold is responsible for more deaths than hot weather worldwide.

Nonetheless, many people find it hard to believe this fact because of the decades-long propaganda and hysteria surrounding global warming. Here is why we should be thankful that our world is warming.

Human Body is Made for Warm Weather

Humans evolved in warm environments. The body is better equipped to handle heat than cold as it can regulate temperature through sweating and other mechanisms. However, in cold weather, our bodies must work harder to maintain a normal temperature, which can lead to a variety of health problems.

Anecdotes of heart attacks induced by shoveling snow are common in northern climes. When exposed to cold temperatures, the body’s blood vessels constrict to conserve heat, which can increase blood pressure and strain the heart.

The relative dryness of cold air is irritating to airways, causing inflammation and making breathing more difficult, particularly for those with preexisting respiratory conditions like asthma or chronic obstructive pulmonary disease (COPD).

So, it is no wonder that civilizations flourished when temperatures were higher, especially when home heating was primitive or nonexistent.

Lessons from Norse Farming in Greenland

Scientists Say A 6°C Warmer-Than-Today Arctic Is ‘Optimal’ For Thermophile Species

by K. Richard, Apr 6, 2023 in NoTricksZone


Back in the Early Holocene, when CO2 levels were said to be ~255 ppm, Arctic Svalbard was warm enough to accommodate abundant numbers of thermophiles, or warmth-demanding species. Only “remnants” of these species and their habitat exist in today’s much-colder Arctic.

With the exception of a few centuries in recent millennia, today’s Svalbard (Arctic) is the most glaciated it has been in the last 10,000 years (see the blue trend line in the below chart from Brožová et al., 2023).


This region is today about 6°C colder than it was during the early Holocene (~10,000 to 8,000 years ago), a climatic period scientists characterize as an optimum, or “most favorable,” for a “rich species pool” of thermophiles.

The sea surface temperatures (SSTs) in the western Barents Sea were as warm as 13°C and “sea ice-free during most of the mid-Holocene” (Łącka et al., 2019). In contrast, today’s SST in this region are as cold as they were during the last glacial (2-4°C), when CO2 hovered near 200 ppm. Rapid double-digit SST fluctuations, varying from 3 to 13°C, have been ongoing throughout the Holocene.

Earth’s Greenhouse Effect Has Not Been Enhanced, But Instead Its Impact Has Declined Since 1983

by K. Richard, April 10, 2023 in NoTricksZone


In the satellite era scientists have continued to observe the Earth’s total greenhouse effect (which includes effects from greenhouse gases and clouds) exerting an overall negative impact (cooling) on surface temperatures since the 1980s. This rules out both CO2 and an enhanced greenhouse effect as drivers of global warming.

Earth’s total greenhouse effect impact on climate is realized by the sum of all contributors to it: water vapor, clouds, and the “anthropogenic” greenhouse gases CO2 and CH4.

Given the modern assumption that humans are responsible for global warming due especially to our CO2 and CH4 emissions, it stands to reason that Earth’s downwelling longwave (LWdn) should be increasing and thus the Earth’s greenhouse effect should be enhanced due to the rising greenhouse gases emissions.

But, as Cess and Udelhofen (2003) reported 20 years ago, Earth’s greenhouse effect has not been enhanced in recent decades. Instead, it has been in a state of decline since the 1980s.

“[T]he negative trend in G [greenhouse effect] indicates that the atmospheric greenhouse effect is temporarily [1985-1999] decreasing despite the fact that greenhouse gasses are increasing.”

Happy Easter, Happy End of the 2023 Cyclone Season at the Great Barrier Reef

by J. Maroshasy, Apr 11, 2023 in WUWT


Year on year, however, contrary to human-caused global warming theory, neither the number nor intensity of cyclones has increased at the Great Barrier Reef. The available data shows that there has been a steady decline in both the number and intensity of cyclones since the 1970s.

This is probably why coral cover, as measured around the perimeter of coral reefs, is reported to be so high. The most recent Australian Institute of Marine Science survey reported coral cover to be the highest in 36 years. Cyclones can be incredibly damaging to corals, with fewer cyclones there will be more coral.

Contrary to expectations, this last 2022-23 season has also been quiet, with few cyclones. The exact number will hopefully be published at the Bureau’s cyclone page, that is here. But I doubt there will be a media release.


See also: Bellies Full of Coral

NASA Data On Global Sea Ice Area Shows A Growth Equal To The Size Of Belgium Since 1982!

by P. Gosselin, Nov 30, 2021 in NoTricksZone


Global Sea Ice Area

Data analyst Zoe Phin just posted some interesting, surprising results on global sea ice area.

Data sources like the National Snow and Ice Data Center show global sea ice has been” drastically decreasing for a long time” and so we need to panic and overhaul the entire carbon economy. We hear this daily in the media.

Surprising global sea ice area findings

But Zoe has analyzed what she characterizes as a “very legitimate source” of data from NASA, (here, or here). And according to her findings, the data from these sources suggest global sea ice loss is not as dramatic as some institutes would like us to believe it is. In fact there ‘s been a gain!

Zoe plotted the data going back 40 years, from 1982 to 2021, the “Global Sea Ice Area Fraction”, which “is a proportion of the entire Earth’s surface that is ice over water.”

“As you can see, about 3.6% (on average) of our planet’s area is covered in ice over water,” reports Zoe. “In the last 40 years, ice over water has INCREASED, and not decreased, as popularly claimed.”

According to Zoe, the observed increase is equivalent to ~30,600 km², or “roughly the size of Belgium”.

Northern hemisphere sea ice area has declined

The northern hemisphere has decreased, and this has gotten lots of attention from alarmists and the media:

The New Pause lengthens to 8 years 9 months

by C. Monckton of Brenchley, Apr 2023 in WUWT


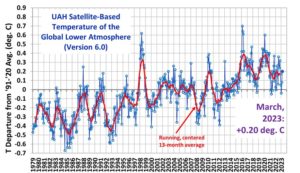
The New Pause has lengthened to 8 years 9 months. The least-squares linear-regression trend on the UAH monthly satellite global-temperature dataset shows no global warming from July 2015 to March 2023. As usual, this site is just about the only place where this continuing failure of global temperatures to do as they are told is reported.


The start and end dates of the New Pause are not cherry-picked. The end date is the present; the start date is the farthest back one can reach and still find a zero trend. It is what it is.

For comparison, here is the entire dataset for 44 years 4 months since December 1978. It shows a less than terrifying long-run warming rate equivalent to 1.3 degrees/century, of which 0.3 K has already occurred since January 2021, leaving just 1 K to go (on the current trend) until 2100, by which time reserves of coal, oil and gas will be largely exhausted.

Why You Should Ignore The Latest IPCC Climate Report

by R. Barmby, Mar 31, 2023 in ClimateChangheDispatch


You have a fever with jaundice, feel crappy, and are vomiting.

You go to the emergency room at the local hospital.

The ER doctor does not run any tests, but based on the symptoms his diagnosis is acute alcoholism and prescribes abstinence or you will drink yourself to death.

“What about some tests, or a second opinion?” you ask. The doctor informs you that “the administration in this hospital has two rules: firstly, the only diagnosis we give out for these symptoms is chronic alcohol abuse; and secondly, we delete any data to the contrary from your file.”

You check into rehab but the fever, jaundice, and nausea persist. Six days later you die from acute fulminant viral hepatitis (Hep B). But sober.

A reasonable person would not accept a diagnosis dictated by the hospital administration and the deletion of conflicting data. Especially if you knew acute alcoholic hepatitis and acute viral HBV hepatitis present the same symptoms and it takes blood tests to differentiate them with certainty.

And that’s why you should ignore the latest Intergovernmental Panel on Climate Change (IPCC) reportbecause two similar rules govern their analysis and reporting. The cure is also similar: Net Zero CO2 by 2050.

The IPCC Report Cycle

The IPCC’s 1988 mandate from the United Nations was to review, “The state of the knowledge of the science of climate and climatic change”.

In that mandate, the UN expressed “concern that human activities could change global climate patterns, threatening present and future generations…” and also includes the conjecture “…emerging evidence indicates that continued growth in ‘greenhouse’ gases could produce global warming…”

For the last 35 years, the IPCC has developed this mandate into an industry of perpetual reporting on a six-year cycle designed to instill constant fear of human-caused global warming.

The foundation of each reporting cycle, which in its whole is termed an Assessment Report (AR), is the report from Working Group I (WG I) as that is the physical sciences basis addressing the UN mandate.

It is then followed by a report from Working Group II (WG II) which assesses the impacts of climate change and then Working Group III (WG III) dictates what needs to be done to mitigate the damages caused by climate change.

Each of these reports consists of between two thousand to three thousand pages, and each is condensed into a Summary for Policy Makers (SPM). Ultimately a Synthesis Report combining all three Working Groups is issued, again with its SPM.

Media Regurgitate Nonsense About Greenland Ice Sheet And Sea Level Rise

by D. Burton, Apr 3, 2023 in ClimateChangeDispatch


CNBC and the Potsdam Institute (PIK) report that:

We’re halfway to a tipping point that would trigger 6 feet of sea-level rise from the melting of the Greenland Ice Sheet

PUBLISHED WED, MAR 29 202312:12 PM EDT By Catherine Clifford

KEY POINTS:

● Once people have cumulatively emitted approximately 1,000 gigatons of carbon in total, then the southern part of the Greenland Ice Sheet will melt eventually causing the sea level to rise by almost six feet.

● Once humans have cumulatively emitted approximately 2,500 gigatons of carbon in total, the whole Greenland Ice Sheet will eventually melt and the sea level rise would rise by 6.9 meters or 22.6 feet.


● And right now, now we are at approximately 500 gigatons of carbon emissions released.

Here’s the article.

Here’s the paper.

Like most things from PIK, this “study,” and this CNBC article, are nonsense. [emphasis, links added]

The best estimates are that since 1850, anthropogenic carbon emissions have totaled about 675 Gt of carbon (a/k/a PgC) (not 500).

Over that same period, the amount of CO2 in the atmosphere has increased by only about 135 ppmv CO2 = 287 PgC (gigatonnes carbon).

The difference is the amount removed from the atmosphere by natural negative feedbacks, such as absorption by the oceans, the greening of the Earth, and rock weathering.

(Aside: Petagram ≡ gigatonne ≡ Gt, and “PgC” means “petagram of carbon,” so 1 PgC = 1 Gt of carbon (GtC). 1 ppmv CO2 = 7.8024 Gt CO2 = 2.12940 PgC.)

Yet we’ve only gotten an estimated 1.02 to 1.27 °C of warming from all that CO2, and it’s beenaccompanied by negligible acceleration in sea-level trends:

….

Greenland Temperatures 2020

by P. Homewood, June 12, 2021 in NotaLotofPeopleKnowThat


I mentioned a year ago that the reason for the deficit in ice mass increase during the winter and spring of 2020 was sustained cold and dry weather. (Conversely milder weather tends to bring snow). I also reported how the summer melt began much later than normal.

The Danish Meteorological Institute (DMI) have now published the official Greenland temperature for last year, bearing this out and showing how cold it really was:


image

Greenland Surface Mass Ice Balance 2019/20

http://polarportal.dk/en/greenland/surface-conditions/

New Study: Sea Levels Have Receded Over Last 1500 Years, Including Since 1800s, Along India’s Coasts

by K. Richard, April 3, 2023 in NoTricksZone


Contrary to alarmist claims, the seas have been retreating and the coasts have been expanding seaward along the coasts of southern India since the early 1800s.

Korkai was a port city, capital, and the principal trade center for India’s Pandya Kingdom from the 6th to 9th centuries CE.

While Korkai was situated on the sea coast during the early stages of the Medieval  Warm Period, the city center is now approximately 5 or 6 km from the coast. This confirms the sea has substantially receded since then.

Nautical maps from the 1805-1828 period clearly affirm the coast of southern India has continued expanding seaward in the last 200 years, despite the reported rise in relative sea level (Gupta and Bhoolokam Rajani, 2023).

In other words, much more coastal land area is above sea level today than during the Little Ice Age, or when CO2 levels were said to be 280 ppm.

Real-World Observation: Increasing CO2 By 7,000 ppm Has A 0.3°C Temperature Differential

by K. Richard, Mar 30, 2023 in NoTricksZone


Surface air CO2 concentrations vary by 100s to 1,000s of ppm within a span of hours to days or weeks across the natural world. The observational evidence suggests these variations are neither driving or even causing temperature changes.

According to recent field research (Mungai, 2021) conducted in Kenya, the observed CO2 concentrations in the atmospheric air above mofette springs (8) averages 3,400-4,800 ppm. Interestingly, the temperatures associated with these high CO2 levels are “relatively low” or “cold” (~21.5 to 29.5°C) compared to ambient temperatures at other nearby sites with ~400 ppm CO2.
 
The study also shows that when CO2 increases from 5,253 ppm in wet season to 12,138 ppm in dry season over a mofette springs site, there is only a 0.3°C temperature differential (23.4°C vs. 23.1°C) associated with this >7,000 ppm CO2 change. The sensitivity of the surface air temperature to these extremely high CO2 variations would appear to be vanishingly small – or non-existent.

The Latest UN Climate Report Is Bumper-Sticker Climate Science

by J. Curry, Mar 29, 2023 in ClimateChangeDispatch


The Intergovernmental Panel on Climate Change (IPCC) has issued a new Synthesis Report, with fanfare from the UN Secretary-General Antonio Guterres:

“The climate time-bomb is ticking but the latest IPCC report shows that we have the knowledge & resources to tackle the climate crisis. We need to act now to ensure a livable planet in the future.”

The new IPCC Report is a synthesis of the three reports that constitute the Sixth Assessment Report, plus three special reports[emphasis, links added]

This Synthesis Report does not introduceany new information or findings.

While the IPCC Reports include some good material, the Summary for Policy Makers for the Synthesis Report weakly emphasizes justified findings on climate impacts driven by extreme emission scenarios and politicized policy recommendations on emissions reductions.

The most important finding of the past five years is that the extreme emissions scenarios RCP8.5 and SSP5-8.5, commonly referred to as “business-as-usual” scenarios, are now widely recognized as implausible.

These extreme scenarios have been dropped by the UN Conference of the Parties (COP) to the UN Climate Agreement.

However, the new Synthesis Report continues to emphasize these extreme scenarios, while this important finding is buried in a footnote:

“Very high emission scenarios have become less likely but cannot be ruled out.”

The extreme emissions scenarios are associated with alarming projections of 4-5°C of warming by 2100.

The most recent Conference of the Parties (COP27) is working from a baseline temperature projectionbased on a medium emissions scenario of 2.5°C by 2100.

Climate Expert: The Misinformation In The IPCC, Part 1

by R. Pielke, Mar 29 2023 in ClimateChangeDispatch


Today, in the first of two posts, I explain how the IPCC made several misleading claims related to tropical cyclones.

The IPCC’s failures are both obvious and undeniable.

I will walk you through them in detail. Once again, I conclude that the IPCC needs reform. Mistakes can creep into massive assessments, to be sure, but the failures I document below are unacceptable. [emphasis, links added]

The first failure never rose above the depths of Chapter 11 of its AR6 Working Group 1 (WG1) report. The second is a bit technical and is much more significant – having made its way into the Summaries for Policymakers (SPMs) of both WG1 and the Synthesis Report released last week.

Before proceeding, let me reiterate that the IPCC is not just one report or one group of people. It is many things and comprised of many different people. Its products are of uneven quality, and even individual chapters in the same report can be of very different scientific quality.

For instance, in general, IPCC AR6 WG1 did a nice job on the physical science aspects of extreme weather, whereas IPCC AR6 WG2 was chock full of massive problems. …snip…