Tous les articles par Alain Préat

Full-time professor at the Free University of Brussels, Belgium apreat@gmail.com apreat@ulb.ac.be • Department of Earth Sciences and Environment Res. Grp. - Biogeochemistry & Modeling of the Earth System Sedimentology & Basin Analysis • Alumnus, Collège des Alumni, Académie Royale de Sciences, des Lettres et des Beaux Arts de Belgique (mars 2013). http://www.academieroyale.be/cgi?usr=2a8crwkksq&lg=fr&pag=858&rec=0&frm=0&par=aybabtu&id=4471&flux=8365323 • Prof. Invited, Université de Mons-Hainaut (2010-present-day) • Prof. Coordinator and invited to the Royal Academy of Sciences of Belgium (Belgian College) (2009- present day) • Prof. partim to the DEA (third cycle) led by the University of Lille (9 universities from 1999 to 2004) - Prof. partim at the University of Paris-Sud/Orsay, European-Socrates Agreement (1995-1998) • Prof. partim at the University of Louvain, Convention ULB-UCL (1993-2000) • Since 2015 : Member of Comité éditorial de la Revue Géologie de la France http://geolfrance.brgm.fr • Since 2014 : Regular author of texts for ‘la Revue Science et Pseudosciences’ http://www.pseudo-sciences.org/ • Many field works (several weeks to 2 months) (Meso- and Paleozoic carbonates, Paleo- to Neoproterozoic carbonates) in Europe, USA (Nevada), Papouasia (Holocene), North Africa (Algeria, Morrocco, Tunisia), West Africa (Gabon, DRC, Congo-Brazzaville, South Africa, Angola), Iraq... Recently : field works (3 to 5 weeks) Congo- Brazzaville 2012, 2015, 2016 (carbonate Neoproterozoic). Degree in geological sciences at the Free University of Brussels (ULB) in 1974, I went to Algeria for two years teaching mining geology at the University of Constantine. Back in Belgium I worked for two years as an expert for the EEC (European Commission), first on the prospecting of Pb and Zn in carbonate environments, then the uranium exploration in Belgium. Then Assistant at ULB, Department of Geology I got the degree of Doctor of Sciences (Geology) in 1985. My thesis, devoted to the study of the Devonian carbonate sedimentology of northern France and southern Belgium, comprised a significant portion of field work whose interpretation and synthesis conducted to the establishment of model of carbonate platforms and ramps with reefal constructions. I then worked for Petrofina SA and shared a little more than two years in Angola as Director of the Research Laboratory of this oil company. The lab included 22 people (micropaleontology, sedimentology, petrophysics). My main activity was to interpret facies reservoirs from drillings in the Cretaceous, sometimes in the Tertiary. I carried out many studies for oil companies operating in this country. I returned to the ULB in 1988 as First Assistant and was appointed Professor in 1990. I carried out various missions for mining companies in Belgium and oil companies abroad and continued research, particularly through projects of the Scientific Research National Funds (FNRS). My research still concerns sedimentology, geochemistry and diagenesis of carbonate rocks which leads me to travel many countries in Europe or outside Europe, North Africa, Papua New Guinea and the USA, to conduct field missions. Since the late 90's, I expanded my field of research in addressing the problem of mass extinctions of organisms from the Upper Devonian series across Euramerica (from North America to Poland) and I also specialized in microbiological and geochemical analyses of ancient carbonate series developing a sustained collaboration with biologists of my university. We are at the origin of a paleoecological model based on the presence of iron-bacterial microfossils, which led me to travel many countries in Europe and North Africa. This model accounts for the red pigmentation of many marble and ornamental stones used in the world. This research also has implications on the emergence of Life from the earliest stages of formation of Earth, as well as in the field of exobiology or extraterrestrial life ... More recently I invested in the study from the Precambrian series of Gabon and Congo. These works with colleagues from BRGM (Orléans) are as much about the academic side (consequences of the appearance of oxygen in the Paleoproterozoic and study of Neoproterozoic glaciations) that the potential applications in reservoir rocks and source rocks of oil (in collaboration with oil companies). Finally I recently established a close collaboration with the Royal Institute of Natural Sciences of Belgium to study the susceptibility magnetic signal from various European Paleozoic series. All these works allowed me to gain a thorough understanding of carbonate rocks (petrology, micropaleontology, geobiology, geochemistry, sequence stratigraphy, diagenesis) as well in Precambrian (2.2 Ga and 0.6 Ga), Paleozoic (from Silurian to Carboniferous) and Mesozoic (Jurassic and Cretaceous) rocks. Recently (2010) I have established a collaboration with Iraqi Kurdistan as part of a government program to boost scientific research in this country. My research led me to publish about 180 papers in international and national journals and presented more than 170 conference papers. I am a holder of eight courses at the ULB (5 mandatory and 3 optional), excursions and field stages, I taught at the third cycle in several French universities and led or co-managed a score of 20 Doctoral (PhD) and Post-doctoral theses and has been the promotor of more than 50 Masters theses.

Températures extrêmes et foehn – Démonter le mythe des ‘dômes de chaleur’

by B. Van Vliet-Lanoë et J. Van Vliet, 27 août 2021, in ScienceClimat Energie


EN GUISE DE CONCLUSIONS

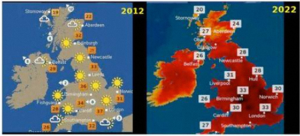
Les températures extrêmes observées en juin 2021 en Colombie britannique et dans le Nord-Ouest américain s’expliquent quantitativement et de manière classique par le gradient vertical de 9,8 K/km de l’adiabatique sèche, associé à une baisse d’altitude de 2 km, par l’intermédiaire d’un phénomène de foehn autocatalytique.Les concepts de « dôme de chaleur » et de Global Warming ne sont donc d’aucune utilité pour interpréter les observations. 

De manière plus générale, le phénomène de foehn peut être déclenché par la présence de hautes pressions dans le voisinage d’une chaîne de montagnes. La chaîne des Montagnes Rocheuses est particulièrement sujette à ces phénomènes depuis la Colombie britannique jusqu’à la Californie, mais elle est loin d’être la seule, comme le montre le Tableau 13. Le vent de foehn chaud et sec favorise également les incendies de forêts.

La genèse des hautes pressions peut résulter du passage d’ondes planétaires, mais également du passage d’AMP en provenance du vortex polaire. Ce dernier est particulièrement renforcé lorsque le vent solaire – ou l’activité aurorale qui lui est équivalente – faiblit, comme c’est le cas entre la fin d’un cycle solaire et la montée de l’activité du cycle suivant (Schlamminger 1990). Ceci explique pourquoi les hautes pressions et les vagues de froid sont particulièrement intenses au début du cycle solaire, comme déjà observé entre 2009 et 2013, et comme attendu entre 2019 et 2023. Il est donc probable que les phénomènes extrêmes et les incendies de forêts se poursuivront dans les 2 ou 3 années qui viennent. 

Enfin, les différents phénomènes physiques évoqués se situent non pas dans un contexte de réchauffement, mais bien dans un contexte de refroidissement global qui a démarré avec le 21ème siècle (van Vliet 2020) et que le printemps froid et l’été pluvieux de 2021 rendent particulièrement visible en Belgique, en France, en Angleterre et en Allemagne.

Dans cet article, une analyse quantitative simple nous a conduit à la conclusion que les températures extrêmes et les feux de forêt sont d’origine naturelle : l’homme n’y est donc pour rien, sauf pour la gestion de la couverture végétale et … l’allumage. Il est faux de juger l’homme coupable comme le font systématiquement l’ONU et le GIEC.

Oser prétendre que la transition énergétique améliorera cette situation relève d’une alliance contre nature entre le monde politique, le marketing insensé des énergies renouvelables et la propagande écologiste.

Sea Levels Near B.C. Canada Were 90 Meters Higher Than Today 14,500 Years Ago

by K. Richard, Aug 23, 2021 in NoTricksZone


A new study suggests British Columbia (Canada) relative sea levels remained 10 meters higher than they are today until they fell to their present levels in the last ~1800 years. Two other new studies suggest sea levels were still 0.8 to 1 meter higher than today during the Medieval Warm Period.

After the peak of the last glacial about 20,000 years ago, relative sea levels subsequently rose from 120 meters below modern sea levels to heights of 90 meters above today’s by ~14,500 years ago in the Douglas Channel near British Columbia, Canada (Letham et al., 2021).

Sea levels proceeded to fall 75 to 80 meters over the next 3000 years, or about -2.5 meters per century (-25 mm/yr), and then they remained 10-15 m above present for the next ~9000 years.

We determine that central Douglas Channel was ice-free following the Last Glacial Maximum by 14,500 BP and RSL was at least 90 m higher than today. Isostatic rebound caused RSL to fall to 21 m asl by 11,500 BP, though there may have been a glacial re-advance that would have paused RSL fall around the beginning of the Younger Dryas. RSL fell to 10–15 m asl by 10,000 BP, and continued to drop at a slower rate towards its current position, which it reached by ∼1800 years ago.”

NEW STUDY: 23 EXPERTS IN THE FIELDS OF SOLAR PHYSICS AND CLIMATE SCIENCE CONTRADICT THE IPCC — THE SCIENCE IS NOT SETTLED

by Cap Allon, Aug 16, 2021 in Electroverse


A diverse expert panel of global scientists finds blaming climate change mostly on greenhouse gas emissions was premature. Their findings contradict the UN IPCC’s conclusion, which the study shows, is grounded in narrow and incomplete data about the Sun’s total solar irradiance (TSI).

A new scientific review article has just been published on the role of the Sun in climate change over the last 150 years.

It finds that the United Nations’ Intergovernmental Panel on Climate Change (IPCC) may have been premature in their conclusion that recent climate change is mostly caused by human greenhouse gas emissions.

The paper by 23 experts in the fields of solar physics and of climate science from 14 different countries is published in the peer-reviewed journal Research in Astronomy and Astrophysics (RAA).

The paper, which is the most comprehensive to date, carries out an analysis of the 16 most prominent published solar output datasets, including those used by the IPCC.

The researchers compared them to 26 different estimates of Northern Hemisphere temperature trends since the 19th century (sorted into five categories), including the datasets used by the IPCC.

They focused on the Northern Hemisphere since the available data for the early 20th century and earlier is much more limited for the Southern Hemisphere, but their results can be generalized for global temperatures.

Dr. Ronan Connolly, lead author of the study, at the Center for Environmental Research and Earth Sciences (CERES):

“The IPCC is mandated to find a consensus on the causes of climate change. I understand the political usefulness of having a consensus view in that it makes things easier for politicians. However, science doesn’t work by consensus. In fact, science thrives best when scientists are allowed to disagree with each other and to investigate the various reasons for disagreement. I fear that by effectively only considering the datasets and studies that support their chosen narrative, the IPCC have seriously hampered scientific progress into genuinely understanding the causes of recent and future climate change. I am particularly disturbed by their inability to satisfactorily explain the rural temperature trends.”

Challenging UN, Study Finds Sun—not CO2—May Be Behind Global Warming

by P. Homewood, Aug 16, 2021 in NotaLotofPeopleKnowThat


The sun and not human emissions of carbon dioxide (CO2) may be the main cause of warmer temperatures in recent decades, according to a new study with findings that sharply contradict the conclusions of the United Nations (UN) Intergovernmental Panel on Climate Change (IPCC).

The peer-reviewed paper, produced by a team of almost two dozen scientists from around the world, concluded that previous studies did not adequately consider the role of solar energy in explaining increased temperatures.

The new study was released just as the UN released its sixth “Assessment Report,” known as AR6, that once again argued in favor of the view that man-kind’s emissions of CO2 were to blame for global warming. The report said human responsibility was “unequivocal.”

But the new study casts serious doubt on the hypothesis.

Calling the blaming of CO2 by the IPCC “premature,” the climate scientists and solar physicists argued in the new paper that the UN IPCC’s conclusions blaming human emissions were based on “narrow and incomplete data about the Sun’s total irradiance.”

Indeed, the global climate body appears to display deliberate and systemic bias in what views, studies, and data are included in its influential reports, multiple authors told The Epoch Times in a series of phone and video interviews.

“Depending on which published data and studies you use, you can show that all of the warming is caused by the sun, but the IPCC uses a different data set to come up with the opposite conclusion,” lead study author Ronan Connolly, Ph.D. told The Epoch Times in a video interview.

“In their insistence on forcing a so-called scientific consensus, the IPCC seems to have decided to consider only those data sets and studies that support their chosen narrative,” he added.

The implications, from a policy perspective, are enormous, especially in this field where trillions of dollars are at stake and a dramatic re-organization of the global economy is being proposed.

Paper Examines Sun Vs. CO2

….

Critical Solar Factors Ignored…IPCC AR6 Covers Up Scientific Flaws In Climate Models

by P. Gosselin, Aug 22, 2021 in NoTricksZone


According to the latest IPCC Assessment Report 6 (AR6), the observed temperature increase and the calculated temperature increase according to climate models have been almost the same 1.3 °C from 1750 to 2020.  The report shows a strong positive trend in solar shortwave radiation from 9/2000 to  6/2017, but its impact has been omitted in post-2000 warming calculations which explains the high temperatures since El Nino of 2015-2016.

For example, the temperature effect in 2019 is about 0.7 °C according to the AR6 science. Actually, the IPCC models give a 2019 temperature increase of 2.0°C (1.3°C + 0.7°C). This 54 percent error is due to the positive water feedback applied in climate models, which doubles the impact of other climate forcings and which, according to this natural experiment by climate, does not exist.

The amount of carbon dioxide in the atmosphere has increased by 32% since 1750. According to the AR6, this is only due to man-made anthropogenic emissions staying there (remain, accumulate) by an average of 44% per year and the rest has been absorbed by oceans and vegetation.

Approximately 25% of the atmospheric carbon dioxide changes annually from the oceans and vegetation. As a result, less than 6% of the initial amount of carbon dioxide in the atmosphere remains after 10 years, and therefore the increased amount of carbon dioxide in the atmosphere cannot be entirely anthropogenic origin with a permille value of -28%. The IPCC remains silent on permille values, as in the AR6 there is no word “permille”, which is a measure of the ratio of carbon isotopes and it has been used to analyze the origin of carbon dioxide, suitable for validating carbon cycle models.

Cover-up

The cover-up of this issue continues with the anthropogenic carbon dioxide lifetime in the atmosphere, which is now vaguely from hundreds of years to thousands of years. The removal rate of radioactive carbon from the atmosphere (a perfect tracer test for anthropogenic carbon dioxide) after 1964 is only 64 years. The recovery time of the total atmospheric amount of carbon dioxide to the level of 1750 can be estimated to be similar to that of its accumulation period, i.e. just under 300 years.

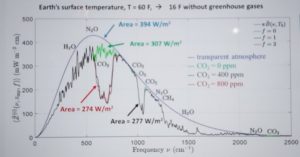
The AR6 report no longer shows the IPCC’s very own definition of the greenhouse effect, except in the glossary. The definition no longer contains the description for how greenhouse gas absorption of 158 Wm-2, which causes the greenhouse effect, creates downward infrared radiation downwards on the ground of 342 Wm-2. This is against fundamental physical laws because energy comes from nothing. The radiation to the surface consists of four energy fluxes, which according to the IPCC’s energy balance are: greenhouse gas absorption of 158 Wm-2, latent water heat 82 Wm-2, sensible heat (warm air) 21 Wm-2, and solar radiation absorption in the atmosphere 80 Wm-2. The three firstly mentioned energy fluxes totaling 261 Wm-2 maintain the greenhouse effect.

Fudging the forcings

Another Round Of Anti-Science From The IPCC

by P. Homewood, Aug 19, 2021 in NotaLotofPeopleKnowThat


McIntyre is promptly on the job again. Here is his post of August 11, basically dismantling the new Hockey Stick. If you have a taste for a lot of technical detail, I urge you to read the whole thing. But the gist is actually simple. This time these people were not going to get caught furtively “hiding the decline.” Instead, they announce boldly that they are simply going to exclude any data that do not fit the narrative that they are putting forth.

McIntyre goes through multiple of the data series that contribute to the “shaft” of the new stick. Most just appear to be random fluctuations up and down. But then there are the few key series that show the sharp 20th-century uptick needed to support the Hockey Stick narrative. One such series is the McKenzie Delta tree ring series from Porter, et al., of 2013. McIntyre goes back to that Porter article and quotes the passage that describes how the researchers chose those trees that would contribute to the series:

AR6 and The Paleocene-Eocene Thermal Maximum

by Andy May, Aug 18, 2021 in WUWT


The PETM or Paleocene-Eocene Thermal Maximum was a warm period that began between 56.3 and 55.9 Ma (million years ago). The IPCC AR6 report (actually a draft, not a final edited report), released to the public on August 9, 2021, suggests that this warm period is similar to what is happening today and they expect to happen in the future (IPCC, 2021, pp. 2-82 & 5-14). During the PETM, it was very warm and average global surface temperatures probably peaked between 25.5°C and 26°C briefly, compared to a global surface temperature average of about 14.5°C today, as shown in Figure 1.

….


oday we have tens of thousands of daily temperature measurements around the world and can calculate a fairly accurate global average surface temperature. To construct a global average for the PETM we must rely on proxy temperatures, such as oxygen isotope ratios, Calcium/Magnesium ratios in fossil shells, and fossil membrane lipids that are sensitive to temperature like Tex86. Proxy temperature values are sparsely located and have a temporal resolution, 56 Ma, of thousands to hundreds of thousands of years. Thus, in terms of rate of temperature change, they are not comparable to today’s monthly global averages.

Before diving into the PETM, we will provide some geological perspective. According to Christopher Scotese, the highest global average temperature in the Phanerozoic (the age of complex shelled organisms, or the past 550 million years) was the Triassic hothouse event, following the end of the Karoo Ice Age, around 250-300 Ma. Global average surface temperatures peaked then at about 27.9°C.

 …

Two Dozen Top Scientists: IPCC “Premature” Blaming CO2 Emissions…Warming Mostly From Natural Cycles

by P. Gosselin, Aug 18, 2021 in NoTricksZone


Most of the energy in the Earth’s atmosphere comes from the Sun. This new study found that the UN’s Intergovernmental Panel on Climate Change (IPCC) only considered a small subset of the published TSI datasets when they assessed the role of the Sun in climate change and that this subset only included “low solar variability” datasets. As a result, the IPCC was premature in ruling out a substantial role for the Sun in recent climate change.

A diverse expert panel of global scientists finds blaming climate change mostly on greenhouse gas emissions was premature. Their findings contradict the UN IPCC’s conclusion, which the study shows, is grounded in narrow and incomplete data about the Sun’s total solar irradiance.

The paper by 23 experts in the fields of solar physics and of climate science from 14 different countries is published in the peer-reviewed journal  (RAA). The paper, which is the most comprehensive to date, carries out an analysis of the 16 most prominent published solar output datasets, including those used by the IPCC.

Scientists come to opposite conclusions recent climate change causes 

The researchers compared them to 26 different estimates of Northern Hemisphere temperature trends since the 19th century (sorted into five categories), including the datasets used by the IPCC. They focused on the Northern Hemisphere since the available data for the early 20th century and earlier is much more limited for the Southern Hemisphere, but their results can be generalized for global temperatures.

The IPCC’s attribution methodology is fundamentally flawed

by R. McKitrick, Aug 18, 2021 in ClimateEtc.


One day after the IPCC released the AR6 I published a paper in Climate Dynamics showing that their “Optimal Fingerprinting” methodology on which they have long relied for attributing climate change to greenhouse gases is seriously flawed and its results are unreliable and largely meaningless. Some of the errors would be obvious to anyone trained in regression analysis, and the fact that they went unnoticed for 20 years despite the method being so heavily used does not reflect well on climatology as an empirical discipline.

My paper is a critique of “Checking for model consistency in optimal fingerprinting” by Myles Allen and Simon Tett, which was published in Climate Dynamics in 1999 and to which I refer as AT99. Their attribution methodology was instantly embraced and promoted by the IPCC in the 2001 Third Assessment Report (coincident with their embrace and promotion of the Mann hockey stick). The IPCC promotion continues today: see AR6 Section 3.2.1. It has been used in dozens and possibly hundreds of studies over the years. Wherever you begin in the Optimal Fingerprinting literature (example), all paths lead back to AT99, often via Allen and Stott (2003). So its errors and deficiencies matter acutely.

The abstract of my paper reads as follows:

New Confirmation that Climate Models Overstate Atmospheric Warming

by R. McKitrick, Aug 17, 2021 in ClimateEtc


Two new peer-reviewed papers from independent teams confirm that climate models overstate atmospheric warming and the problem has gotten worse over time, not better. The papers are Mitchell et al. (2020) “The vertical profile of recent tropical temperature trends: Persistent model biases in the context of internal variability”  Environmental Research Letters, and McKitrick and Christy (2020) “Pervasive warming bias in CMIP6 tropospheric layers” Earth and Space Science. John and I didn’t know about the Mitchell team’s work until after their paper came out, and they likewise didn’t know about ours.

Mitchell et al. look at the surface, troposphere and stratosphere over the tropics (20N to 20S). John and I look at the tropical and global lower- and mid- troposphere.  Both papers test large samples of the latest generation (“Coupled Model Intercomparison Project version 6” or CMIP6) climate models, i.e. the ones being used for the next IPCC report, and compare model outputs to post-1979 observations. John and I were able to examine 38 models while Mitchell et al. looked at 48 models. The sheer number makes one wonder why so many are needed, if the science is settled. Both papers looked at “hindcasts,” which are reconstructions of recent historical temperatures in response to observed greenhouse gas emissions and other changes (e.g. aerosols and solar forcing). Across the two papers it emerges that the models overshoot historical warming from the near-surface through the upper troposphere, in the tropics and globally.

New Study: 2000-Year Precipitation Reconstructions Expose Climate Models Still Of Junk Grade

by Atwood et al., Aug 18, 2021 in NoTricksZone


A new study by Atwood et al (2021) published in the journal of Paleoceanography and Paleoclimatology found there’s “poor agreement” between precipitation reconstructions and model simulations over the past 2000 years. This means future projections made by current models are unreliable. 


Models and reconstructions don’t agree

These comprehensive reconstructions show that from 800 to 1000 CE there was a pronounced drying event relative from the eastern Pacific and parts of Mesoamerica.

Also the period “1400–1700 CE is marked by pronounced hydroclimate changes across the tropics, including dry and/or isotopically enriched conditions in South and East Asia, wet and/or isotopically depleted conditions in the central Andes and southern Amazon in South America, and fresher and/or isotopically depleted conditions in the Maritime Continent.”

The study’s abstract also notes how there’s a glaring disagreement between the simulations done by models and what the reconstructions show: “We find notable dissimilarities between the regional hydroclimate changes and global-scale and hemispheric-scale temperature reconstructions, indicating that more work needs to be done to understand the mechanisms of the widespread tropical hydroclimate changes during the LIA.”

Another Round Of Anti-Science From The IPCC (With A NEW Hockey Stick!)

by F. Menton, Aug 16, 2021 in ClimateChangeDispatch


What with the ongoing catastrophe in Afghanistan and the earthquake in Haiti, among other news, you may have failed to notice that the UN IPCC came out on Monday with substantial parts of its long-awaited Sixth Assessment Report on the state of the world’s climate.

This is the first such assessment issued by the IPCC since 2014. The most important piece is the so-called “Summary for Policymakers,” (SPM), a 41-page section that is the only part that anyone ever reads.

The IPCC attempts to cloak itself in the mantle of “science,” but its real mission is to attempt to scare the bejeezus out of everyone to get the world to cede more power to the UN.

Beginning with its Third Assessment Report in 2001, the lead technician for the IPCC to generate fear has been the iconic “hockey stick” graph, supposedly showing that world temperatures have suddenly shot up dramatically in the last 100 or so years, purportedly due to human influences.

The 2001 Third Assessment Report thus prominently featured the famous Hockey Stick graph, derived from the work of Michael Mann and other authors. Here is that graph from the 2001 Report:


McIntyre comments:

They took “hide the decline” to extremes that had never been contemplated by prior practitioners of this dark art. Rather than hiding the decline in the final product, they did so for individual trees: as explained in the underlying article, they excluded the “divergent portions” of individual trees that had the temerity to have decreasing growth in recent years. Even Briffa would never have contemplated such woke radical measures.

Decide on your desired conclusion and then just exclude any data that refuses to go along. This is the “science” on which our world leaders are off spending multiple trillions of taxpayer dollars.

Antarctic Sea Ice Recovery Surprises Scientists… Classic Disinformation Technique Of Not Reporting

by P. Gosselin, Aug 15, 2021 in NoTricksZone


Just two years ago, many of Germany’s mainstream media outlets declared sea ice at the South Pole was melting at an “astonishing” rate. For example, the left of center, Munich based Süddeutsche Zeitung,

German national daily Süddeutsche Zeitung (above) reported in June, 2019, that Antarctic sea ice had “shrunk 1.8 million square kilometers”, writing: “the massive disappearance of ice is astonishing”.

But many readers here, who are aware of the real data, know nothing of the sort over the long term has happened since satellite measurements began over 40 years ago.

Massive sea ice rebound goes unreported

Today, two years later, German climate science site Die kalte Sonne looks at recent sea ice developments in Antarctica – noting that the climate-ambulance chasing mainstream media like the Süddeutsche Zeitung have since mysteriously stopped reporting on Antarctica. Here’s why:

How to build your hockey stick graph

by Dr H. Masson, Aug 16, 2021 in ScienceClimatEnergie


Introduction

This note is a reaction to the reintroduction by IPCC in the SPM (Summary for Policy Makers) of AR6 of a hockey stick curve, initially introduced by Michael Mann in AR4, and that disappeared in AR5, after the devasting analysis made by Mc Intyre and Mc Kritick, showing the methodological flaws made by Michael Mann. This new curve does not seem to appear in the extended report AR6, inducing some doubt about its scientific meaning, but at the same time underlying the political use IPCC intends to make of it, as a weapon of mass manipulation aimed to alert the media and afraid people.

All this justifies some deeper insight in the methodologies used by IPCC to generate this figure.

Conclusion

The hockey stick graph given in fig 6, which is supposed to be a reliable image of the “raw data” presented in fig 2, is a “fake” and results from misuse of data mining techniques, based on fairy hypotheses that cannot longer be accepted. As an exercise in critical thinking, the reader is invited to find the intentional methodological bugs introduced in this parodic note.

La cerise catastrophiste du GIEC

by ScienceClimatEnergie, 13 août 2021


Il fallait faire fort et ils l’ont fait : la toute première figure du résumé pour décideurs (SPM) du dernier rapport du GIEC (l’AR6), reproduite ci-dessous (Figure 1), est une véritable cerise sur leur gâteau catastrophiste. La courbe est destinée à faire peur au public, par exemple aux étudiants qui ne connaissent rien (ou très peu) de la science climatique (démonstration ici) et qui ont déjà décidé de faire grève en début d’année scolaire. Elle est également destinée aux décideurs trop occupés à leurs affaires politiques pour pouvoir se permettre d’analyser la courbe en profondeur. N’oubliez pas que le Royaume-Uni accueillera la 26eConférence des Parties des Nations unies sur le changement climatique (COP26) à Glasgow du 1er au 12 novembre 2021. Le SPM tombe donc à pic pour influencer les décideurs qui devront voter.

….

Conclusions

En comparant des pommes et des poires (raison n°1), en effaçant des chapitres entiers des livres d’histoire (raison n°2) et en jouant sur l’échelle du graphique (raison n°3), la Figure SPM.1 du GIEC remplit parfaitement son rôle : faire peur aux gens qui ne prennent pas le temps de réfléchir. Et cela marche, les manifestations ne font que commencer. Bravo le GIEC!

Mais ce super tour de passe-passe, ne suggère-t-il pas que le GIEC a perdu les pédales, est à bout de souffle et ne sait plus quoi inventer pour sortir de l’impasse? S’agirait-il d’une première forme de ‘suicide scientifique’? Espérons quand même que de nombreux scientifiques ne seront pas dupes, sinon il y a vraiment de quoi désespérer.

Le Nouveau Testament du GIEC est enfin disponible !

by ScienceClimatEnergie, 10 août 2021


En ce lundi 9 août 2021, le dernier rapport du groupe I du GIEC, l’AR6, est enfin disponible sur le site internet de l’organisation internationale (ici). Il s’intitule : « Climate Change 2021: the Physical Science Basis » et est, bien entendu, hyper alarmiste, du moins dans son résumé pour décideurs (SPM). Ne manquez pas de lire la présentation de ce nouveau rapport par le GIEC lui-même.

L’arrivée de ce nouveau bébé a été célébrée en grande pompe par tous les médias, comme par exemple le site alarmiste RTL-info, qui a réussi à publier 8 articles différents sur le sujet en une seule journée[1]. Ces articles comprennent bien entendu une interview de J.P. Van Yperseleet de Greta Thunberg. L’alarmisme climatique ferait-il grimper les recettes publicitaires?

Ce nouveau rapport AR6 sera bien entendu analysé en détail par l’équipe SCE et nous ne manquerons pas de vous faire part de nos observations. Nous vous proposons déjà deux remarques importantes.

Remarque 1.

Le nouveau rapport du GIEC (AR6) fait 3949 pages (et la majorité des figures ne sont pas encore disponibles). Si vous lisez 10 à 11 pages par jour vous mettrez exactement un an pour le finir. Il faut bien entendu avoir une certaine base scientifique et savoir lire l’anglais sinon vous aurez beaucoup de mal à comprendre quoi que ce soit… Qui va donc lire ce rapport dans son entièreté? Très peu de monde, et certainement pas les décideurs qui n’ont généralement pas le temps. Un résumé de 41 pages (le SPM) leur est donc destiné. Toutes les nuances et les incertitudes du rapport de 3949 pages seront donc gommées dans le résumé de 41 pages, comme nous vous l’avions démontré pour l’AR5 (ici).


Continuer la lecture de Le Nouveau Testament du GIEC est enfin disponible !

The UN IPCC buries two millennia of fluctuating temperatures

by P. Homewood, Aug 16, 2021 in NotaLotofPeopleKnowThat


….

That there has been 1.1°C of warming since 1850 is not especially controversial.  There is some disagreement about the degree to which it reflects the “recovery” from the mini-Ice Age (when there were Ice Fairs on the Thames among other events not seen today) and the effects of increased CO2 emissions.

The controversial part is the removal of temperature oscillations commonly thought to have occurred over the course of the past 2,000 years. These include warming that was known to have occurred in Roman times and again in the tenth century when the Vikings colonised Greenland until 1250, and the cold period 1400-1700.  Such events are downgraded as being either exaggerated or localised.

The earlier iteration of the IPCC 2021 picture was the notorious hockey stick fabrication by Michael Mann.  Mann cherry-picked data from tree rings and spliced together incongruent data sources, and reported his “findings” in a 1998 paper. Like the latest IPCC report, this showed a flat temperature trend until the 20th Century, then a sharp rise.

The IPCC in its 2001 report used Mann’s graph as its poster child to substantiate human-induced global warming.  In the years after 2001 the IPCC quietly dropped Mann’s “hockey stick”.  Its discreditating was completed by 2009 release of confidential emails (dubbed “Climategate”), which showed Michael Mann as the conductor of other climate scientists seeing a need to eradicate the “medieval warming period” in order to make the case that the modern warming is unique.

The chicanery under which this strategy was conducted resulted in legal cases.  Canadian scientist Tim Ball called Mann a fraud, Mann sued and the subsequent court case lasted a decade before finding against Mann. (Mann has managed to string out another case that he brought against Mark Steyn for even longer).

But in the 2021 climate review the “hockey stick” is again the main feature.

Climate Scientists Admit Climate Models Exaggerated Warming

by V. Jayaraj & E.C. Beisner, Aug 12, 2021 in ClimateChangeDispatch


Last week, a group of scientists sent shockwaves through the climate science community. They boldly pointed out that current climate models exaggerate greenhouse warming.

In other words, they confirmed what climate skeptics have been arguing all along: that most computer climate models forecast unrealistic warming — warming not observed anywhere in the real world.

Could this be a turning point for climate science? Has the hitherto staunch resistance to any kind of scrutiny regarding the dangerous warming narrative come to an end?

Scientific Method

Science is not a body of facts. It is a method of finding facts — a method that is inherently skeptical. Not cynically skeptical, but humbly skeptical.

It insists, as the motto of the Royal Society, nullius in verba, roughly translated “take nobody’s word for it,” that a scientist’s every claim be tested — over and over and over.

Thus, as the philosopher of science Robert K. Merton put it in 1938, “Most institutions demand unqualified faith; but the institution of science makes skepticism a virtue.”

A scientific hypothesis is carefully studied and checked against the available evidence. The process of establishing a scientific truth involves the scientific community’s continuous effort to falsify it until so many such efforts have failed that the community provisionally accepts it — with emphasis on provisionally.

In the age of celebrity culture, though, people easily assume that theories celebrated scientists — or large numbers of scientists, or scientists associated with government authorities — embrace are above challenge.

Yet even theories universally embraced (for example, that continents don’t move, or that all ulcers are caused by excess stomach acid arising from too-acidic foods or anxiety) are not immune from new challenges or improvements and have been discarded.

Even the most celebrated scientists have been wrong. As EarthSky editor Deborah Byrd notes,

Einstein’s [General] Theory of Relativity implied that the universe must either be expanding or contracting. But Einstein himself rejected this notion in favor of the accepted idea that the universe was stationary and had always existed. When [Edwin] Hubble presented his evidence [the red shift] of the expansion of the universe, Einstein embraced the idea. He called his adherence to the old idea “my greatest blunder.”

It is now understood that the universe is constantly expanding.

Today, climate science finds itself in turmoil. Theories of catastrophic global warming driven by carbon dioxide emissions have long escaped careful scrutiny — just as the theories of acid-caused ulcers and stable continents long did.

Climate Scientists: Yes, the Models are Wrong

….

THE IPCC’S LATEST CLIMATE REPORT IS ANTISCIENCE AND ANTIHUMAN — REJECT IT

by Cap Allon, Aug 12, 2021 in Electroverse


The IPCC are still ignoring the influences of the sun, even in 2021. Their latest report pays it such little mind that it may as well not be there — and soon, I wouldn’t put it past these jokers to completely deny its existence.

They do have a section called “solar forcing” in the report, but this feels more of a placating inclusion rather than a genuine scientific inquiry. It appears to only get a mention so it can be immediately dismissed — but such lip service is often all it takes to fool the unthinkers into believing a topic has been covered, when in fact it most certainly has not.

As with their previous reports, when it comes to the sun, the IPCC’s focus is on “irradiance“.

This is an intentionally narrow-minded stance which excludes ALL secondary forcings, which are plentiful.

The IPCC purposefully ignore the global electric circuit; they fail to mention earth’s waning magnetic field; they don’t touch on auroras (i.e. solar wind/flares/CMES) which have been found to heat the planet; and they sidestep the influx of cosmic rays during times of low solar activity, which have been found to nucleate clouds (global cooling) AND heat the muons in the subsurface (volcanic and seismic uptick, with the former also leading to cooling).

IPCC AR6 Focusses On “Absurd”, “Fairy Tale” Scenarios, Ignores Hundreds Of Publications, Major Factors

by F. Vahrenholt, Aug 11, 2021 in NoTricksZone


Now we look at the new IPCC report.

The new IPCC report: climate change 2021 – widespread, rapid, worsening climate change

The new IPCC 6th Assessment Report published on Monday, August 9th, makes a clear statement in the title of its “Summary for Policymakers”: Climate change is continuing to spread rapidly at an accelerated pace.

What are the main changes compared to the 5th Assessment Report of 2013?

1. Global warming from 1850 to the present is reported to have been 1.07 °C. The warming from 2011 to 2020 increased by 0.19°C since the last reporting period from 2003 to 2012.

2. There are new models (CMIP6), but some of them produced completely implausible results (Science, Paul Voosen: U.N. Climate Panel confronts implausibly hot forecasts of future warming). Since CO2’s influence was assumed to be too strong, the backward modelling of the temperature development of the last millennia of some models led to unrealistically cold temperatures. Looking into the future, many models ran too hot. Even Gavin Schmidt of the NASA GISS Institute, who is close to the IPCC, stated: “insanely scary – and wrong”.

As a result, the models relied on by the IPCC were constrained. Nevertheless, the holy grail of climate research, the climate sensitivity ECS (temperature increase with doubling of CO2) was raised. Until now, the IPCC calculated a temperature increase range of 1.5° to 4.5° Celsius with a doubling of the CO2 concentration from 280 ppm (1850) to 560 ppm in the future. Against the background of the new models, the IPCC now gives a temperature range of 2° to 5°C, with a narrower confidence interval of 2.5°C to 4°C. They even venture so far as to assign a mean value for climate sensitivity of 3°C for a doubling of CO2.

Entire Holocene warmth gets airbrushed

3. Surprisingly, the IPCC has deleted the Medieval Warm Period (MWP) from 900 to 1200 from the climate report and thus from humanity’s climate memory. The first graph in the report, SPM.1, shows the temperature curve for the last 2000 years. From year 1 onwards, the curve shows a steadily decreasing trend until 1850, after which the temperature rises sharply until today. A new hockey stick has been created. So the IPCC can claim that it has never been as warm as it is today for 125,000 years.

Numerous scientific publications (I was involved in five of them) document that the Medieval Warm Period was about as warm as today (as described in the 5th State of the Climate Report).

But now even the period of 6500 to 8500 years ago is also rewritten as cold. That was the time when hippos roamed the Sahara and shortly afterwards, Ötzi wandered over the Ötztal Alps. Dozens of publications had proven that the temperatures at that time were 3 degrees higher than today. All no longer true. (see “Unwanted truths”, p.34 to p.54). In the last IPCC report of 2013 it was still stated: “On a continental scale, temperature reconstructions of the medieval climate anomaly (years 950 to 1250 show with high confidence intervals of decades that were as warm in some regions as in the late 20th century.

Here We Go Again: UN Climate Panel Continues Decades-Long Climate Fear Porn Tradition

by J. Vazquez, Aug 9, 2021 in mrcNewsBusters


Run for cover! The Intergovernmental Panel on Climate Change (IPCC) is warning that we only have a few years to save the planet — a nugget of fear porn the United Nations and the media have been peddling for decades.

Liberal outlet The Guardian ran a climate propaganda story headlined “Major climate changes inevitable and irreversible – IPCC’s starkest warning yet.” The outlet took a nosedive into absurdity by blaming humanity for “climate crimes”: “IPCC’s verdict on climate crimes of humanity: guilty as hell.” The outlet took the IPCC report and screeched that unless “rapid and drastic reductions in greenhouse gases in this decade” are initiated, temperatures would rise by “more than” 1.5 degrees Celsius “above pre-industrial levels,” bringing a “climate breakdown” of “widespread devastation and extreme weather.” President of the 2021 U.N. Climate Change Conference Alok Sharma fearmongered that failing to limit warming to 1.5 degrees Celsius would be “‘catastrophic.'” [Emphasis added.]

The IPCC’s latest scare tactics reflect the words of University of Southampton Professor emeritus John Brignell, as reported by Climate Depot: “The creation of the UN IPCC was a cataclysmic event in the history of science. Here was a purely political body posing as a scientific institution.”

Hoover Institution visiting fellow Bjorn Lomborg has pointed out on Twitter, “UN routinely warns us that we have just a few years left until catastrophe.” The U.N. has a sorry record of those predictions failing to materialize.

The IPCC Summary For Policymakers

by P. Homewood, Aug 10, 2021 in NotaLotofPeopleKnowThat


https://www.ipcc.ch/report/ar6/wg1/#FullReport

If we ignore all of the alarmist rhetoric in the IPCC’s Summary for Policymakers, the real nitty gritty lies in these four sections:


Conclusion

The reality is that our weather is no worse now than it was 150 years ago. Indeed I would strongly suggest that governments all around the world would be terrified if they were told we were going back to the climate Little Ice Age.

Think I’m kidding? This was exactly scientists thought was going to happen during the global cooldown in the 1970s, and governments were genuinely alarmed.

All that is left in the IPCC report is a host of highly subjective projections of what might happen in the future.

Does Scientific Data Show Humans, CO2, And Fossil Fuels Cause Global Warming?

by J. Heller, Aug 10, 2021 in ClimateChangeDispatch


Another day, another dire warning about global warming.

The press and its taskmasters could essentially Xerox a copy of what they printed for the public in the Washington Post in 1922, or a UN report in 1989, or a UN report in 2019 for this report here:

U.N. climate report likely to deliver stark warnings on global warming

As always, journalists just print and repeat these never-ending reports to scare the public into submission with no questions asked.

For decades, journalists, educators, scientists, bureaucrats, and other Democrats have colluded to spread these dire warnings, (misinformation) without scientific evidence, to scare and control the public.

We are repeatedly have been told that we only have a few years left to solve the problem.

The end date always evolves. No matter how wrong these dire predictions are they just repeat them and say the science is settled to cut off debate. Why are people who are always so wrong considered experts?

Many CEOs, Republicans, and others repeat the same claims without evidence because it is so much more pleasant to go along instead of being called anti-science, or worse still, “deniers.”

In D.C., and throughout the country, politicians are using these dire forecasts to pass policies to destroy thousands of industries and millions of jobs.

Joe Biden and his administration have been in office for seven months and are working as fast as they can to remake and destroy America.

He has signed executive orders to stop a pipeline, stop drilling and force people to buy vehicles powered by the poisonous, very combustible pollutant Lithium. These anti-oil policies greatly harm the poor, middle class, and small businesses with higher prices.

The Biden administration has rejoined the Paris climate accord where politicians and bureaucrats from around the world pretend they can control temperatures, sea levels, and storm activity if thousands of industries are destroyed and we hand them trillions of our hard-earned dollars.

Does anyone really believe that Iran, Russia, and other major oil-producing countries will give up oil? Isn’t it important that Biden let a pipeline proceed from Russia to Germany while stopping the pipeline from Canada to the United States?

Does anyone believe that China cares about its carbon footprint as it continues to build a large number of coal power plants? Here’s what’s going on in China:

Despite Pledges to Cut Emissions, China Goes on a Coal Spree

As the Biden administration works so hard to destroy industries, I have not seen one journalist as Biden, Harris, Kerry, Psaki, or anyone else in the administration who has been asked for evidence to support the claimed science that can justify what Biden is doing.

In a free society with independent journalists, we should see the reporters asking questions and doing research to see if what they are told is correct before they repeat talking points to the public.

Sadly, in the United States, we have seen, for decades, almost all journalists have essentially become campaign workers to elect Democrats and lobbyists to sell the radical leftist policies to the public.

Media outlets, especially the social media giants, work very hard to stifle debate and silence anyone who disagrees by repeating the talking points that we are anti-science and climate change deniers who should not be listened to.

It is an outright lie to call people who tell the truth that the climate has always changed cyclically and natural climate-change deniers. I have never seen anyone deny that the climate changes.

Inside The Acceleration Factory

by W. Eschenbach, Aug 11, 2021 in WUWT


Nerem and Fasullo have a new paper called OBSERVATIONS OF THE RATE AND ACCELERATION OF GLOBAL MEAN SEA LEVEL CHANGE, available here. In it, we find the following statement:

Both tide gauge sea level reconstructions and satellite altimetry show that the current rate of global mean sea level change is about 3 mm yr–1, and both show that this rate is accelerating.

So the claim is that tide gauges show acceleration. Let’s start with a look at the Church and White (hereinafter C&W) estimate of sea level from tide gauges around the world, which is the one used in the Nerem and Fasullo paper. The C&W paper is here.

How Climate Scenarios Lost Touch With Reality

by R. Pielke Jr & J. Ritchie, Aug, 4, 2021 in CO2Coalition


A failure of self-correction in science has compromised climate science’s ability to provide plausible views of our collective future.

The integrity of science depends on its capacity to provide an ever more reliable picture of how the world works. Over the past decade or so, serious threats to this integrity have come to light. The expectation that science is inherently self-correcting, and that it moves cumulatively and progressively away from false beliefs and toward truth, has been challenged in numerous fields—including cancer research, neuroscience, hydrology, cosmology, and economics—as observers discover that many published findings are of poor quality, subject to systemic biases, or irreproducible.

In a particularly troubling example from the biomedical sciences, a 2015 literature review found that almost 900 peer-reviewed publications reporting studies of a supposed breast cancer cell line were in fact based on a misidentified skin cancer line. Worse still, nearly 250 of these studies were published even after the mistaken cell line was conclusively identified in 2007. Our cursory search of Google Scholar indicates that researchers are still using the skin cancer cell line in breast cancer studies published in 2021. All of these erroneous studies remain in the literature and will continue to be a source of misinformation for scientists working on breast cancer.

In 2021, climate research finds itself in a situation similar to breast cancer research in 2007. Our research (and that of several colleagues) indicates that the scenarios of greenhouse gas (GHG) emissions through the end of the twenty-first century are grounded in outdated portrayals of the recent past. Because climate models depend on these scenarios to project the future behavior of the climate, the outdated scenarios provide a misleading basis both for developing a scientific evidence base and for informing climate policy discussions. The continuing misuse of scenarios in climate research has become pervasive and consequential—so much so that we view it as one of the most significant failures of scientific integrity in the twenty-first century thus far. We need a course correction.

In calling for this change, we emphasize explicitly and unequivocally that human-caused climate change is real, that it poses significant risks to society and the environment, and that various policy responses in the form of mitigation and adaptation are necessary and make good sense. However, the reality and importance of climate change does not provide a rationale or excuse for avoiding questions of research integrity any more than does the reality and importance of breast cancer. To the contrary, urgency makes attention to integrity that much more important.

Scenarios and baselines