Full-time professor at the Free University of Brussels, Belgium
apreat@gmail.com
apreat@ulb.ac.be
• Department of Earth Sciences and Environment
Res. Grp. - Biogeochemistry & Modeling of the Earth System
Sedimentology & Basin Analysis
• Alumnus, Collège des Alumni, Académie Royale de Sciences, des Lettres et des Beaux Arts de Belgique (mars 2013). http://www.academieroyale.be/cgi?usr=2a8crwkksq&lg=fr&pag=858&rec=0&frm=0&par=aybabtu&id=4471&flux=8365323
• Prof. Invited, Université de Mons-Hainaut (2010-present-day)
• Prof. Coordinator and invited to the Royal Academy of Sciences of Belgium (Belgian College) (2009-
present day)
• Prof. partim to the DEA (third cycle) led by the University of Lille (9 universities from 1999 to 2004) - Prof. partim at the University of Paris-Sud/Orsay, European-Socrates Agreement (1995-1998)
• Prof. partim at the University of Louvain, Convention ULB-UCL (1993-2000)
• Since 2015 : Member of Comité éditorial de la Revue Géologie de la France http://geolfrance.brgm.fr
• Since 2014 : Regular author of texts for ‘la Revue Science et Pseudosciences’ http://www.pseudo-sciences.org/
• Many field works (several weeks to 2 months) (Meso- and Paleozoic carbonates, Paleo- to Neoproterozoic carbonates) in Europe, USA (Nevada), Papouasia (Holocene), North Africa (Algeria, Morrocco, Tunisia), West Africa (Gabon, DRC, Congo-Brazzaville, South Africa, Angola), Iraq... Recently : field works (3 to 5 weeks) Congo- Brazzaville 2012, 2015, 2016 (carbonate Neoproterozoic).
Degree in geological sciences at the Free University of Brussels (ULB) in 1974, I went to Algeria for two years teaching mining geology at the University of Constantine. Back in Belgium I worked for two years as an expert for the EEC (European Commission), first on the prospecting of Pb and Zn in carbonate environments, then the uranium exploration in Belgium. Then Assistant at ULB, Department of Geology I got the degree of Doctor of Sciences (Geology) in 1985. My thesis, devoted to the study of the Devonian carbonate sedimentology of northern France and southern Belgium, comprised a significant portion of field work whose interpretation and synthesis conducted to the establishment of model of carbonate platforms and ramps with reefal constructions.
I then worked for Petrofina SA and shared a little more than two years in Angola as Director of the Research Laboratory of this oil company. The lab included 22 people (micropaleontology, sedimentology, petrophysics). My main activity was to interpret facies reservoirs from drillings in the Cretaceous, sometimes in the Tertiary. I carried out many studies for oil companies operating in this country.
I returned to the ULB in 1988 as First Assistant and was appointed Professor in 1990. I carried out various missions for mining companies in Belgium and oil companies abroad and continued research, particularly through projects of the Scientific Research National Funds (FNRS).
My research still concerns sedimentology, geochemistry and diagenesis of carbonate rocks which leads me to travel many countries in Europe or outside Europe, North Africa, Papua New Guinea and the USA, to conduct field missions.
Since the late 90's, I expanded my field of research in addressing the problem of mass extinctions of organisms from the Upper Devonian series across Euramerica (from North America to Poland) and I also specialized in microbiological and geochemical analyses of ancient carbonate series developing a sustained collaboration with biologists of my university. We are at the origin of a paleoecological model based on the presence of iron-bacterial microfossils, which led me to travel many countries in Europe and North Africa. This model accounts for the red pigmentation of many marble and ornamental stones used in the world. This research also has implications on the emergence of Life from the earliest stages of formation of Earth, as well as in the field of exobiology or extraterrestrial life ...
More recently I invested in the study from the Precambrian series of Gabon and Congo. These works with colleagues from BRGM (Orléans) are as much about the academic side (consequences of the appearance of oxygen in the Paleoproterozoic and study of Neoproterozoic glaciations) that the potential applications in reservoir rocks and source rocks of oil (in collaboration with oil companies).
Finally I recently established a close collaboration with the Royal Institute of Natural Sciences of Belgium to study the susceptibility magnetic signal from various European Paleozoic series. All these works allowed me to gain a thorough understanding of carbonate rocks (petrology, micropaleontology, geobiology, geochemistry, sequence stratigraphy, diagenesis) as well in Precambrian (2.2 Ga and 0.6 Ga), Paleozoic (from Silurian to Carboniferous) and Mesozoic (Jurassic and Cretaceous) rocks. Recently (2010) I have established a collaboration with Iraqi Kurdistan as part of a government program to boost scientific research in this country.
My research led me to publish about 180 papers in international and national journals and presented more than 170 conference papers. I am a holder of eight courses at the ULB (5 mandatory and 3 optional), excursions and field stages, I taught at the third cycle in several French universities and led or co-managed a score of 20 Doctoral (PhD) and Post-doctoral theses and has been the promotor of more than 50 Masters theses.
Cet article fait suite à la première partie (1/2) publiée par SCE le 14 août 2020.
5. La longueur des cycles solaires
Le passage d’un cycle solaire au cycle suivant est défini en principe par le changement de signe du champ magnétique autour des taches solaires. Le moment de ce passage est difficile à déterminer dans le cas des cycles longs, parce qu’on peut avoir pendant plusieurs années cohabitation, dans le même hémisphère solaire, de taches solaires d’orientations magnétiques différentes. Ainsi, à l’heure d’écriture de cet article (juillet 2020), la fin du cycle solaire 24 se rapproche, mais les premières taches avec l’orientation magnétique du cycle 25 ont fait leur apparition dès 2019; si le cycle 24 n’était pas terminé avant la fin de cette année, la transition du cycle 24 au cycle 25 serait étalée sur 3 années.
De manière à tirer profit de la richesse des données disponibles sur le site (ici) la longueur des cycles solaires est déterminée comme suit: pour les cycles allant de 1700 à 1755, seules les moyennes annuelles du nombre de taches solaires sont disponibles et le début de cycle correspond à l’année suivant le minimum de cette moyenne. Pour les cycles allant de 1755 à nos jours, la longueur est déterminée en utilisant les moyennes mensuelles: le début de cycle correspond au mois à partir duquel s’amorce la montée du nombre de taches. Cette méthode diffère de celle utilisée par Friis-Christensen et Lassen [29] et Butler et Johnston [30] qui ont travaillé par interpolation au départ des valeurs mensuelles lissées sur 13 mois.
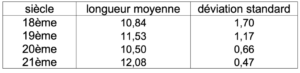
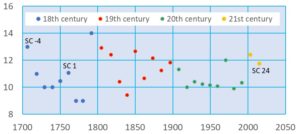
Comme nous allons le voir, la longueur des cycles solaires varie de 9 ans minimum (cycles 2, 3 et 8) à 14 ans (cycle 4 marquant le début du Minimum de Dalton et la Révolution française). La Figure 5 fournit les longueurs des 29 cycles solaires observés depuis le début du 18ème siècle, chaque valeur étant positionnée au milieu du cycle correspondant. La figure suggère que la dispersion des cycles solaires va diminuant du 18ème au 20èmesiècle: de manière à préciser cette impression, on calcule dans le tableau suivant, pour chacun des siècles considérés, les longueurs moyennes des cycles solaires (en années) et leurs déviations standard.
Figure 5 : Longueur des 29 cycles solaires observés du 18ème au 21ème siècle.
Le résultat le plus frappant de ce tableau est que les cycles solaires du 20ème siècle sont en moyenne un an plus courts que ceux du 19ème siècle, la tendance s’inversant avec les 2 premiers cycles du 21ème siècle. En appliquant la corrélation de Butler et Johnston[24], ceci rendrait le 20ème siècle plus chaud de 0,5°C en moyenne que le 19ème siècle.
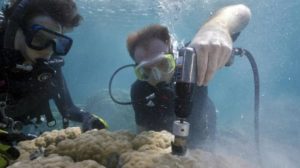
Scientists have long suspected that ocean acidification is affecting corals’ ability to build their skeletons, but it has been challenging to isolate its effect from that of simultaneous warming ocean temperatures, which also influence coral growth. New research from the Woods Hole Oceanographic Institution (WHOI) reveals the distinct impact that ocean acidification is having on coral growth on some of the world’s iconic reefs.
IMAGE: WHOI SCIENTIST ANNE COHEN (LEFT) AND MIT-WHOI JOINT PROGRAM STUDENT NATHAN MOLLICA EXTRACT CORE SAMPLES FROM A GIANT PORITES CORAL IN RISONG BAY, PALAU. view more CREDIT: PHOTO BY RICHARD BROOKS, LIGHTNING STRIKE MEDIA PRODUCTIONS, PALAU.
In a paper published Aug. 27, 2020, in the journal Geophysical Research Letters, researchers show a significant reduction in the density of coral skeleton along much of the Great Barrier Reef–the world’s largest coral reef system–and also on two reefs in the South China Sea, which they attribute largely to the increasing acidity of the waters surrounding these reefs since 1950.
“This is the first unambiguous detection and attribution of ocean acidification’s impact on coral growth,” says lead author and WHOI scientist Weifu Guo. “Our study presents strong evidence that 20th century ocean acidification, exacerbated by reef biogeochemical processes, had measurable effects on the growth of a keystone reef-building coral species across the Great Barrier Reef and in the South China Sea. These effects will likely accelerate as ocean acidification progresses over the next several decades.”
Roughly a third of global carbon dioxide emissions are absorbed by the ocean, causing an average 0.1 unit decline in seawater pH since the pre-industrial era. This phenomenon, known as ocean acidification, has led to a 20 percent decrease in the concentration of carbonate ions in seawater. Animals that rely on calcium carbonate to create their skeletons, such as corals, are at risk as ocean pH continues to decline. Ocean acidification targets the density of the skeleton, silently whittling away at the coral’s strength, much like osteoporosis weakens bones in humans.
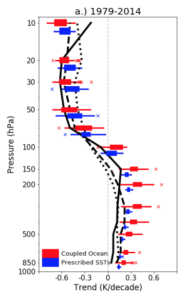
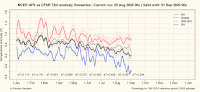
Two new peer-reviewed papers from independent teams confirm that climate models overstate atmospheric warming and the problem has gotten worse over time, not better.
The papers are Mitchell et al. (2020) “The vertical profile of recent tropical temperature trends: Persistent model biases in the context of internal variability” Environmental Research Letters, and McKitrick and Christy (2020) “Pervasive warming bias in CMIP6 tropospheric layers” Earth and Space Science. John and I didn’t know about the Mitchell team’s work until after their paper came out, and they likewise didn’t know about ours.
Mitchell et al. look at the surface, troposphere and stratosphere over the tropics (20N to 20S). John and I look at the tropical and global lower- and mid- troposphere. Both papers test large samples of the latest generation (“Coupled Model Intercomparison Project version 6” or CMIP6) climate models, i.e. the ones being used for the next IPCC report, and compare model outputs to post-1979 observations. John and I were able to examine 38 models while Mitchell et al. looked at 48 models. The sheer number makes one wonder why so many are needed, if the science is settled. Both papers looked at “hindcasts,” which are reconstructions of recent historical temperatures in response to observed greenhouse gas emissions and other changes (e.g. aerosols and solar forcing). Across the two papers it emerges that the models overshoot historical warming from the near-surface through the upper troposphere, in the tropics and globally.
Mitchell et al. 2020
Mitchell et al. had, in an earlier study, examined whether the problem is that the models amplify surface warming too much as you go up in altitude, or whether they get the vertical amplification right but start with too much surface warming. The short answer is both.
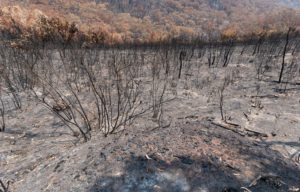
With wildfires devastating California, it may be worth while seeing if lessons can be learned from Australia. Connections between American and Australian firefighters go back many years, with each helping the other from time to time. There were devastating bushfires in Australia last summer, and, tragically, three Americans who had come to help were killed when their water tanker plane crashed. It’s now Australia’s turn to help California, and let us all hope there is a better outcome.
Gum trees burnt in the bushfires in The Blue Mountains in Australia
Submissions to Enquiries
Australia’s federal enquiry into the bushfires is not due to report until 28 October 2020 but the NSW [New South Wales] state enquiry report was published today. There were nearly 2,000 public submissions. Before I go into the report’s recommendations, it may be worth looking at a couple of the public submissions in order to understand the extreme level of public frustration with green tape and the way that the fire hazard has been allowed to grow ever larger over the years.
During the last Grand Solar Minimum (17th century), global surface temperatures dipped to the coldest of the last 10,000 years – about 1.4°C colder than today. Dr. Zharkova, an astrophysicist, has determined another imminent drop in solar activity will lead to a 1°C cooling in the coming decades.
From 1645 to 1710, the Sun went into a quiet phase referred to as the Maunder Minimum. During this period, the “surface temperature of the Earth was reduced all over the Globe” (Zharkova, 2020). Cold summers and winters ensued, with glaciers extending onto farmland, sea ice expanding beyond the Arctic, and “frost fairs” on frozen rivers in Europe.
.
The coldest temperatures and most expansive ice extent (glaciers, permafrost, sea ice) of the last 10,000 years occurred during both this period and the surrounding centuries – often referred to as the Little Ice Age (LIA) (Glazer et al., 2020, Geirsdottir et al., 2019).
…
In a new paper, Dr. Valentina Zharkova asserts that during solar cycles 25-27, the Sun may return to a modern Maunder-like Grand Solar Minimum. This solar quiet phase is expected to substantially reduce the Earth’s solar magnetic field, which will, in turn, lead to an increase in cosmic rays extending into Earth’s atmosphere and thus an increase in high clouds reflecting the Sun’s radiation back to space.
The consequence? A reduction in global temperatures to just 0.4°C above what they were in 1710.
The role of atmospheric CO2 as a temperature-driving mechanism is not mentioned in the paper.
by H.S. Burnett, August 20, 2020 in ClimateChangeDispatch
PBS News Hour attacked climate science this weekend, publishing alarmist claims about hurricanes and wildfires that defy findings of the United Nations Intergovernmental Panel on Climate Change (IPCC).
In an interview between PBS reporter Hari Sreenivasan and Andrew Freedman, editor of Washington Post’s Capital Weather Gang, the two journalists blamed global warming for severe wildfires and hurricanes.
According to the IPCC, however, there is little or no evidence indicating global warming is impacting hurricanes or drought.
…
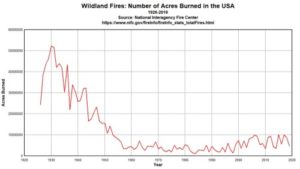
Figure 1: Total wildfire acreage burned by year in the United States, 1926 to 2019. Data from NIFC. Graph by meteorologist Anthony Watts
by P. Homewood, August 26, 2020 in NotaLotofPeopleKnowThat
…
…
It’s Not About The Climate
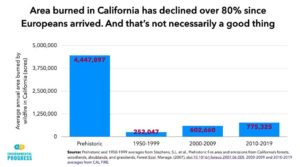
Nobody denies climate change is occurring and playing a role in warmer temperatures and heatwaves. Keeley notes that, since 1960, the variation in spring and summer temperatures explain 50% of the variation in fire frequency and intensity from one year to the next.
But the half-century since 1960 is the same period in which the U.S. government promoted, mostly out of ignorance, the suppression of regular fires which most forests need to allow for new growth.
For much of the 20th Century, U.S. agencies and private landowners suppressed fires as a matter of policy. The results were disastrous: the accumulation of wood fuel resulting in fires that burn so hot they sometimes kill the forest, turning it into shrubland.
The US government started to allow forests in national parks to burn more in the 1960s, and allowed a wider set of forests on public lands to burn starting in the 1990s.
“When I hear climate change discussed it’s suggested that it’s a major reason and it’s not,” Scott Stevens of the University of California, Berkeley, told me.
Redwood forests before Europeans arrived burned every 6 to 25 years. The evidence comes from fire scars on barks and the bases of massive ancient trees, hollowed out by fire, like the one depicted in The New York Times photograph.
“There was severe heat before the lightning that dried-out [wood] fuel,” noted Stevens. “But in Big Basin [redwood park], where fire burned every seven to ten years, there is a high-density of fuel build-up, especially in the forests.”
L’Amérique du Sud a connu une vague de froid particulièrement remarquable par son intensité et son étendue géographique du 19 au 23 août 2020, c’est-à-dire durant la seconde partie de l’hiver météorologique austral qui s’achève à la fin de ce mois.
Cet épisode froid est intervenu alors que l’hémisphère sud enregistre un déficit thermique significatif depuis le début du mois d’août et une tendance à la baisse de la température moyenne sur les 5 derniers mois. Dans ce contexte climatique, plusieurs coups de froid se sont produits dans l’hémisphère sud depuis le début de l’hiver, notamment en Australie au début du mois d’août avec un record absolu de froid enregistré par l’État insulaire de Tasmanie le 7 août (-14,2°C à Liawenee) et des chutes de neige abondantes au centre de l’île le 5 août (les plus importantes à Launceston depuis la tempête de neige du 31 juillet 1921), en Afrique australe à plusieurs reprises durant l’hiver, dans le sud-ouest de l’océan Indien en août, dans plusieurs archipels de l’Océanie (en Polynésie française en juin et début juillet, en Nouvelle-Calédonie à la mi-juillet), ou encore dans le sud de l’Argentine dès la fin du mois de juin avec -20,0°C le 27 juin à l’aéroport de Perito Moreno en Patagonie qui enregistre à cette occasion sa plus basse température pour un mois d’août depuis 1961 (précédent record : -18,2°C le 21 juin 2002), puis durant la première quinzaine de juillet avec des températures anormalement basses en Patagonie qui enregistre son 4e mois de juillet le plus froid depuis 1961 et d’abondantes chutes de neige à basse altitude en Patagonie et sur les reliefs andins (en particulier dans la province de Mendoza où il n’avait pas autant neigé depuis plus de 15 ans et jamais autant sur une période de 10 jours).
Une vague de froid plus intense et de plus grande ampleur a touché l’Amérique du Sud à partir du 19 août 2020, avec des températures particulièrement basses en Argentine les 20 et 21 août : plusieurs stations dans le centre et le nord du pays ont enregistré un record mensuel de froid, comme Villa Reynolds (-13,1°C le 20), Santa Rosa de Conlara (-12,0°C le 20), Río Cuarto (-5,0°C le 20), Córdoba (-6,5°C le 21), Presidencia Roque Sáenz Peña (-6,1°C le 21) et Corrientes (-1,7°C le 21).
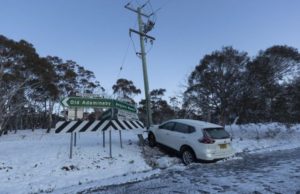
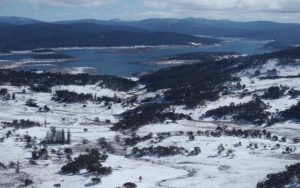
Antarctic air reaching Australia’s south east triggered snowfall down to low-lying regions across several states over the weekend and into Monday, with many people temporarily escaping house-arrest to enjoy the “once-in-a-15-year” event.
…
Heavy snow made for treacherous driving conditions near Old Adaminaby [Aug 23, 2020].
The town of Oberon received a record-breaking 20 cm (8 inches) of global warming goodness, the highest 24-hour snow total ever recorded outside of an Aussie alpine region. Traffic, predictably, was soon bumper-to-bumper through Hampton as tourists descended on Oberon to enjoy the snow–much to the chagrin of the local sheep. One Oberon resident reportedly bleated: “Let’s all go mingle with people from hot spots then risk taking something home. It will be so worth it.” And another jumbuck added: “I wonder what part of STAY AT HOME do all those idiots not understand.”
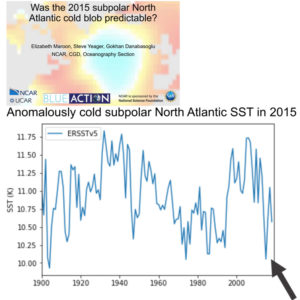
Ecological conditions for 3 temperature- and sea ice-sensitive species show the sub-Arctic North Atlantic has been cooling and gaining ice since 1940.
In recent months, several scientific publications have documented a dramatic cooling trend in the subpolar North Atlantic, with temperatures plummeting 2°C since 2008 (Bryden et al., 2020) or -0.78°C per decade since 2004 (Fröb et al., 2019). Maroon et al. (2020) even point out 2015 was the coldest of the last 100 years.
Clouds dominate as the driver of changes in the Earth’s radiation budget and climate. A comprehensive new analysis suggests we’re so uncertain about cloud processes and how they affect climate we can’t even quantify our uncertainty.
According to scientists (Song et al., 2016), the total net forcing for Earth’s oceanic atmospheric greenhouse effect (Gaa) during 1992-2014 amounted to -0.04 W/m² per year. In other words, the trend in total longwave forcing had a net negative (cooling) influence during those 22 years despite a 42 ppm increase in CO2. This was primarily due to the downward trend in cloud cover that overwhelmed or “offset” the longwave influence from CO2.
…
Cloud impacts on climate are profound – but so are uncertainties
The influence of clouds profoundly affects Earth’s radiation budget, easily overwhelming CO2’s impact within the greeenhouse effect. This has been acknowledged by scientists for decades.
Despite the magnitude of clouds’ radiative impact on climate, scientists have also pointed out that our limited capacity to observe or measure cloud effects necessarily results in massive uncertainties.
For example, Stephens et al. (2012) estimated the uncertainty in Earth’s annual longwave surface fluxes is ±9 W/m² (~18 W/m²) primarily due to the uncertainties associated with cloud longwave radiation impacts.
Starting today through the end of the year, humankind will start consuming more resources than our planet can sustainably produce, according to the Global Footprint Network (GFN), which has been organizing such days since 1986.
“Humanity is using nature 1.75 times faster than our planet’s ecosystems can regenerate,” says the group. “This is akin to using 1.75 Earths.”
Rich nations “overshoot” their resources before poorer ones, according to GFN. The US, Australia, Denmark and Canada overshoot before the end of March, while Cuba, Nicaragua, Iraq, and Ecuador don’t overshoot until December.
“Earth Overshoot Day” is based on something called the “Ecological Footprint,” which is used by the World Wildlife Fund, the United Nations Environment Program, the United Nations Development Program’s Human Development Report, and the International Union for Conservation of Nature.
…
…
The Ecological Footprint has as much scientific merit as astrology, phrenology, and flat-earth theories. It’s time to treat the Ecological Footprint as the pseudoscientific theory it is.
Yale Climate Connections has listed 13 major climate reports published this year, like it is a good thing. But at least 6 of the major reports received funding from US taxpayers.
Addressing Climate as a Systemic Risk: A Call to Action for U.S. Financial Regulators, by Veena Ramani (Ceres 2020, 68 pages, free download available here, registration required). Not sure who paid. Ceres Foundation is a tax exempt group based in Switzerland, who appear to function as a meta charity – they provide a vehicle for people who want to create a charitable fund without having to set everything up themselves.
by C. Rotter, August 20, 2020 in TheDailyCaller/WUWT
Wildfires are scorching California amid a massive heatwave, which is prompting citizens to consume more energy in hopes of staying cool. The increase in consumption resulted in rolling blackouts, as energy regulators managed an over-taxed energy grid.
The wildfires and blackouts are also coming amid a severe economic downturn caused in part by government-imposed lockdowns designed to slow the spread of the coronavirus pandemic.
At the same time, a recent fuel tax increase is forcing Californians to pay more at the gas pump. California now has the highest gas prices in the country, data show.
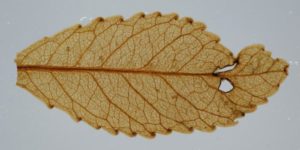
Scientists studying leaves from a 23-million-year-old forest have for the first time linked high levels of atmospheric carbon dioxide with increased plant growth, and the hot climate off the time. The finding adds to the understanding of how rising CO2 heats the earth, and how the dynamics of plant life could shift within decades, when CO2 levels may closely mirror those of the distant past.
Scientists retrieved the leaves from a unique onetime New Zealand lake bed that holds the remains of plants, algae, spiders, beetle, flies, fungi and other living things from a warm period known as the early Miocene. Scientists have long postulated that CO2 was high then, and some plants could harvest it more efficiently for photosynthesis. This is the first study to show that those things actually happened in tandem. The findings were published this week in the journal Climate of the Past.
“The amazing thing is that these leaves are basically mummified, so we have their original chemical compositions, and can see all their fine features under a microscope,” said lead author Tammo Reichgelt, an adjunct scientist at Columbia University’s Lamont-Doherty Earth Observatory and assistant professor of geosciences at the University of Connecticut. “Evidence has been building that CO2 was high then, but there have been paradoxes.”
…
IMAGE: A 23-MILLION-YEAR-OLD LEAF PRESERVED IN A ONETIME NEW ZEALAND LAKE BED, KEY TO PAST ATMOSPHERIC CONDITIONS. ONE CAN SEE VEINS, GLANDS ALONG THE TEETH, AND HOLES GNAWED BY INSECTS, WITH… view more CREDIT: JENNIFER BANNISTER/UNIVERSITY OF OTAGO
by A. Préat (.pdf), 21 août 2020 in Bull.Séanc.Acad.R.Sci.OutreMer
Mots-clés. — Écosystèmes microbiens; Isotopes du carbone et du soufre; Oxydoréduction; Oxygène; Océans et atmosphère.
Résumé. — L’oxygène n’est pas apparu aussi brutalement qu’on le pensait sur notre planète. Malgré un apport en oxygène lié aux cyanobactéries dès l’archéen, ce ne sont pas ces microorganismes qui sont à la base de la première grande «révolution» de l’oxygène qui a eu lieu à la limite archéen/paléoprotérozoïque (il y a deux milliards et demi d’années) dans l’atmosphère, lors du Grand Événement d’Oxydation. Ce sont les processus liés au cycle de la tectonique des plaques (activité mantellique et périodes intenses d’érosion/altération) qui ont contribué de manière déterminante à l’augmentation de la concentration de l’oxygène atmosphérique voici deux milliards et demi d’années. Les deux principaux processus responsables de cette augmentation sont liés à l’enfouissement de la matière organique et de la pyrite. L’altération des séries riches de ces deux composants conditionnera ensuite pendant près d’un milliard d’années la composition chimique des océans en oxygène, soufre et fer. Au cours du temps, l’oxygène proviendra de l’activité des cyanobactéries et l’atmosphère réductrice du début de l’archéen sera remplacée par une atmosphère oxydante à la fin du précambrien.
Keywords. — Microbial Ecosystems; Carbon and Sulfur Isotopes; Oxidation Reduction; Oxygen; Oceans and Atmosphere.
Summary. — The Precambrian: Bacteria, Plate Tectonics and Oxygen. — Oxygen did not appear as abruptly as we thought on our planet. Despite an oxygen supply related to cyanobacteria since the Archean, these microorganisms are not at the origin of the first great oxygen revolution that took place at the Archean/Paleoproterozoic boundary (two and a half billion years) in the atmosphere during the Great Oxidation Event. Two processes related to the cycle of plate tectonics (mantle activity and intense periods of erosion/weathering) were mostly involved in the increase of the atmospheric oxygen concentration two and a half billion years ago. These two main processes are related to the burial of organic matter and pyrite. The alteration of series with high contents of these two elements will then condition for nearly one billion years the oxygen, sulfur and iron chemical composition of the oceans. Oxygen will finally come from the activity of cyanobacteria and the early Archean reducing atmosphere will be replaced by an oxidizing atmosphere at the end of the Precambrian.
…
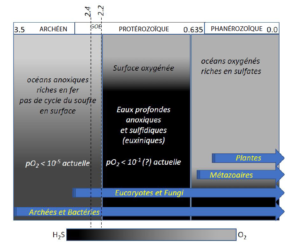
Fig. 3. — Évolution des compositions chimiques et des organismes des océans en trois phases majeures. À l’archéen, les océans contiennent peu d’oxygène et sont relativement riches en fer (colonne de gauche), alors que dans les océans modernes (colonne de droite) l’oxygène est abondant et le fer en quantité limitée. Entre ces deux phases, un long intervalle d’un peu plus d’un milliard d’années est caractérisé par des océans avec des concentrations modérées d’oxygène en surface et des eaux plus profondes riches en H2S en présence de quantités limitées de fer, de molybdène et d’autres éléments en traces importants dans les cycles biologiques. La colonne centrale représente l’«Océan de Canfield» et caractérise le Boring Billion. L’H2S produit (suite à la présence des sulfates, cf. texte) réagit avec le fer ferreux pour former la pyrite. Le fer ferreux n’est donc pas consommé par l’oxygène durant cet intervalle de temps, mais par l’H2S. L’Événement Lomagundi-Jatuli a lieu à environ 2,1 Ga dans le GOE (Great Oxidation Event), marqué par une très forte production d’oxygène. Le début du GOE est marqué par l’oxydation de la pyrite sur les cratons et la disparition des minéraux détritiques sensibles aux conditions d’oxydoréduction des éléments chalcophiles ou sidérophiles (uraninite, sidérite, pyrite, molybdénite, etc.). Les deux grands épisodes «Terre Boule de Neige» à 2,3 Ga («Glaciation Makganyena») et 0,635 («Glaciation Marinoenne»), et d’autres événements glaciaires moins importants ne sont pas reportés ni discutés dans le texte (modifié d’après Knoll 2003).
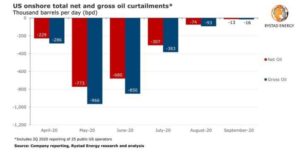
While overall production will decline this year due to the drop in drilling activity, almost all of the curtailed production is expected to be back online by September.
People do the best they can with the information they have, but it appears to me, and Charles Bukowski, that the problem with the world is that the intelligent people are full of doubt, while the stupid people are full of confidence.
HEAVY SNOW is set to bury large swathes of NSW and the ACT over the next few days in what the Bureau of Meteorology is calling a “one-in-15-year weather event”, and what Electroverse posits is an addition to the ever-mounting pile of evidence which suggests anthropogenic global warming is a politicized, data-spun lie.
A large mass of Antarctic air is on course to blast the eastern half of Australia with blizzards, wild winds, and record-breaking low temperatures as it breaks-away from the ice continent and rides anomalously-far north on the back of a weak & wavy (meridional) jet stream (a phenomenon associated with the historically low solar activity we’re currently receiving).
Former Federal Reserve Board Vice Chairman and Princeton University economist Alan Blinder recently wrote the following in the Wall Street Journal: “cumulative CO2 emissions heat up the atmosphere, causing climate changes of all sorts—most of them bad. Because this huge negative externality has been allowed to run rampant, we are gradually making the Earth an inhospitable place for humans.”
Increasing CO2 emissions have been “making the Earth an inhospitable place for humans?” Really?
Scientists at Skolkovo Institute of Science and Technology (Skoltech), together with colleagues from the Karl-Franzens University of Graz & the Kanzelhöhe Observatory (Austria), Jet Propulsion Laboratory of California Institute of Technology (USA), Helioresearch (USA) and Space Research Institute of the Russian Academy of Sciences (Russia) developed a method to study fast Coronal Mass Ejections, powerful ejections of magnetized matter from the outer atmosphere of the Sun. The results can help to better understand and predict the most extreme space weather events and their potential to cause strong geomagnetic storms that directly affect the operation of engineering systems in space and on Earth. The results of the study are published in the Astrophysical Journal.
Coronal Mass Ejections are among the most energetic eruptive phenomena in our solar system and the main source of major space weather events. Huge clouds of plasma and magnetic flux are ejected from the atmosphere of the Sun into the surrounding space with speeds ranging from 100 to 3500 km/s. These gigantic solar plasma clouds and the accompanying powerful shock waves can reach our planet in less than a day, causing severe geomagnetic storms posing hazards to astronauts and technology in space and on Earth.
One of the strongest Space Weather events occurred in 1859 when the induced geomagnetic storm collapsed the whole telegraph system in North America and Europe, the main means of communication for business and personal contacts in those days.
According to Spiegel, the Greenland ice sheet is already doomed (that is unless we skip the usual democratic process and just act immediately).
Spiegel claims Greenland “glaciers are continuously losing huge masses of ice” and that the system there is “dramatically off balance”. The leftist Hamburg-based weekly reported:
The melting of the glaciers on Greenland has apparently passed the point of no return. Even if the global rise in temperature were to stop immediately, the ice sheet would continue to retreat, report researchers led by Michalea King of Ohio State University report in the journal “Communications Earth and Environment“.
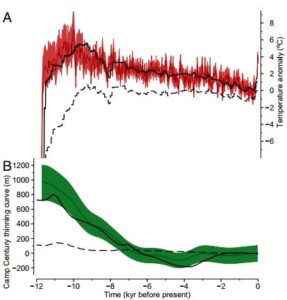
But Die kalte Sonne wondered if this were really so, and needed only 2 mouse clicks to find a recent temperature reconstruction for Greenland’s past (Lecavalier et al. 2017, pdf here). The paper’s Figure 4a shows the temperatures, with the temperature of 1950 at the far right which in paleo-climatology is always meant as “present”.
Thus, 11,000 years ago, it was up to 4°C warmer than in 1950 over long periods of thousands of years, and today the warming has been about 1°C since then. Since we can see an ice sheet of 2,850,000 km³ (that is roughly Gt) today, the “point of no return” cannot have been exceeded 10,000 years ago. How does the heading then come about? We take a look at the associated work by King et al. 2020:
An Antarctic blast has brought record-breaking low temperatures and blizzard conditions across much of Australia this August, according to the Bureau of Meteorology — and even the kangas appear to have had their fill of it.
he heavy snowfall in New South Wales over recent days led to one lucky local capturing a pair of kangaroos going toe-to-toe in the driving snow:
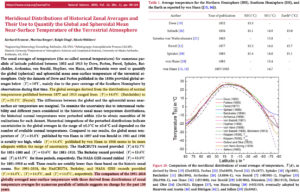
In the early 1900s, the globally-averaged distribution of calculated surface temperature estimates ranged between 14 and 15°C. For 1991-2018, HadCRUT, Berkeley, and NASA GISS also estimate today’s global temperature is about 14.5°C.
Scientists estimating Earth’s surface temperature has been an ongoing pursuit since the early 19th century.
A new study (Kramm et al., 2020) suggests the generally agreed-upon global temperature from 1877 to 1913 from dozens of calculated results was about 14.4°C.
Problematically, HadCRUT, Berkley, and NASA GISS also indicate the 1991-2018 had a global surface temperature of about 14.5°C.
This would suggest there has been “no change in the globally averaged near-surface temperature over the past 100 years”.
A new study, published this week in the journal Nature Climate Change, supports predictions that the Arctic could be free of sea ice by 2035.
BRITISH ANTARCTIC SURVEY
A new study, published this week in the journal Nature Climate Change, supports predictions that the Arctic could be free of sea ice by 2035.
High temperatures in the Arctic during the last interglacial – the warm period around 127,000 years ago – have puzzled scientists for decades. Now the UK Met Office’s Hadley Centre climate model has enabled an international team of researchers to compare Arctic sea ice conditions during the last interglacial with present day. Their findings are important for improving predictions of future sea ice change.
During spring and early summer, shallow pools of water form on the surface of Arctic sea-ice. These ‘melt ponds’ are important for how much sunlight is absorbed by the ice and how much is reflected back into space. The new Hadley Centre model is the UK’s most advanced physical representation of the Earth’s climate and a critical tool for climate research and incorporates sea-ice and melt ponds.
Using the model to look at Arctic sea ice during the last interglacial, the team concludes that the impact of intense springtime sunshine created many melt ponds, which played a crucial role in sea-ice melt. A simulation of the future using the same model indicates that the Arctic may become sea ice-free by 2035.
Joint lead author Dr Maria Vittoria Guarino, Earth System Modeller at British Antarctic Survey (BAS), says:
“High temperatures in the Arctic have puzzled scientists for decades. …
by D. Solway, August 11, 2020 in ClimateChangeDispatch
“The more one has paid for a forgery, the more one defends it in the face of all the evidence to the contrary,” writes John Le Carré in his novel about espionage and deception, Smiley’s People.
This certainly seems to be the case with the four major weather-tracking agencies: the Hadley Climate Research Unit in Britain, the Christy group at the University of Alabama, the Remote Sensing Systems Inc. in California, and the NASA Goddard Institute for Space Studies in New York (NASA GISS).
In a previous article for The Pipeline, I examined the malfeasance of the influential Hadley Climate Research Unit at the University of East Anglia in Norwich, where two major email dumps (aka “Climategate”) showed the outfit’s determined efforts to fudge the data, suppress unfavorable results and eliminate dissenting voices.
This should have put the “global warming” farce to bed once and for all, but the deception shows no sign of abating.
…
La géologie, une science plus que passionnante … et diverse