by P. Berth, 28 février 2020 in ScienceClimatEnergie
Selon un récent article du Guardian, des scientifiques ont mesuré pour la première fois la température de 20,75°C le 9 février 2020 sur l’île Seymour, une île située au large de la péninsule Antarctique. Cette île comporte la station de mesure Marambio où les relevés ont été réalisés. Bien entendu, cette nouvelle a été reprise par les médias, Greta Thunberg en tête. Cependant, en analysant objectivement la situation vous pourrez constater qu’il n’y a pas lieu de s’alarmer.
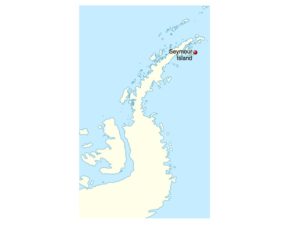
1. Localisation de l’île Seymour et température moyenne annuelle
L’île Seymour est située au large de la péninsule Antarctique (Figure 1), la région la plus au nord du continent Antarctique et, quasiment, la seule partie d’Antarctique s’étendant au-delà du cercle polaire.
…
…
3. Conclusions
– Pour comprendre ce qu’il se passe dans un jeu de données de température il ne faut pas considérer une seule mesure comme le fait l’article du Guardian; il ne faut pas non plus considérer une seule station de mesure.
– Si l’on désire faire passer des droites parmi les données de température, les plus longues séries disponibles sont celles de la station Orcadas (depuis 1902), qui est quand même assez éloignée de la péninsule Antarctique. On constate alors un réchauffement d’environ + 2°C en 110 ans (la courbe de tendance coupe –5°C en 1900 et –3°C en 2010). Cependant, en considérant des courbes polynomiales dont le coefficient de détermination est meilleur on constate que les températures moyennes chutent depuis les années 2000, comme dans toutes les stations de la péninsule Antarctique présentées dans cet article.
– Les phénomènes naturels suivent rarement des droites. Ils sont généralement cycliques, avec des périodes et amplitudes très variables. Il est donc permis de conclure que la péninsule Antarctique ne se réchauffe pas depuis 25 ans. Ceci est confirmé par d’autres analyses (voir ici et ici) et il est dommage qu’une fois de plus les médias ne fassent pas plus preuve de rigueur et se permettent des raccourcis donnant une information inexacte à 100%. En sont-ils seulement conscients ?