Archives de catégorie : climate-debate

Why We Must “Quit Worrying About Uncertainty in Sea Level Projections”

by K. Hansen, Dec 2, 2021 in CO2Coalition


It is an interesting read but not because it presents good advice to the scientific community.  Rather, it presents the case that climate and ice models, which are used to make projections, are not up to the task.  While those who program climate models have been trained in what we know about the basic physics involved in the biggest sea level rise issue – ice sheet dynamics – the actual projections by those models depend on parameters that are loose guesses about things we don’t know.  As a result, Bassis says “…recent studies using climate and ice sheet models are, more and more often, coming to very different conclusions about future rates of sea level rise and even about the sensitivity of ice sheets to future warming…”  and because of that, he tells us:

“Large discrepancies among model projections of long-term sea level rise have spawned calls among the scientific community for scientists to work on reducing uncertainty. However, focusing on uncertainty is a trap we must avoid. Instead, we should focus on the adaptation decisions we can already make on the basis of current models and communicating and building confidence in models for longer-term decisions.”

Kip Hansen is an expert on sea level and sea-level rise. Prolific author of numerous articles on the subjects. WUWT lists 445 commentaries and articles.

He has spent much of his adult life at sea, first as an officer on a merchant ship, and later as a USCG-licensed captain in the Caribbean, where he sailed with his wife while doing humanitarian work (mostly Dominican Republic).

He is a proud member of the CO2 Coalition.

 This commentary was first published by the CO2 Coalition, December 3, 2021

The Arctic Ocean began warming decades earlier than previously thought, new research shows

by P. Homewood, Nov 27, 2021 in NotaLotofPeopleKnowThat


A new study throws doubt on the theory that Arctic warming is man made.

The Arctic Ocean has been warming since the onset of the 20th century, decades earlier than instrument observations would suggest, according to new research.

The study, published Wednesday in the journal Science Advances, found that the expansion of warm Atlantic Ocean water flowing into the Arctic, a phenomenon known as “Atlantification,” has caused Arctic water temperature in the region studied to increase by around 2 degrees Celsius since 1900.

Francesco Muschitiello, an author on the study and assistant professor of geography at the University of Cambridge, said the findings were worrisome because the early warming suggests there might be a flaw in the models scientists use to predict how the climate will change.

Scientists discover link between climate change and biological evolution of phytoplankton

by Rutgers University, Dec 2, 2021 in WUWT


New Brunswick, N.J. (Dec. 1, 2021) – Using artificial intelligence techniques, an international team that included Rutgers-New Brunswick researchers have traced the evolution of coccolithophores, an ocean-dwelling phytoplankton group, over 2.8 million years.

Their findings, published this week in the journal Nature, reveal new evidence that evolutionary cycles in a marine phytoplankton group are related to changes in tropical seasonality, shedding light on the link between biological evolution and climate change.

Coccolithophores are abundant single-celled organisms that surround themselves with microscopic plates made of calcium carbonate, called coccoliths. Due to their photosynthetic activity, mineral production and widespread abundance throughout the world’s oceans, coccolithophores play an important role in the carbon cycle.

Scientists have long thought that climate changes’ effects on plants, animals and other organisms occur in cycles, which are reversed when each cycle is completed, thus erasing any small evolutionary changes during each cycle. In contrast, evolutionary changes, as known from the fossil record, are non-cyclic trends that occur over millions of years.

Deep freeze in Arctic Europe sends power prices soaring

by T. Nilsen, Nov 28, 2021 in The BarentsObserver


On the Finnmark plateau, between Kautokeino and Karasjok, temperatures dropped down to -35°C on Sunday. The forecast for the coming week shows a temperature anomaly for the last days of November of 10°C below the reference period 1961-1990, the Swedish Meteorological and Hydrological Institute informs.

Coldest out is Nikkaluokta near Gällivare in Norrbotten with -36°C.

In times of climate change, the current freeze comes in sharp contrast to last fall, when meteorologists reported about the hottest October and early November ever measured, with an average of 6,7°C above normal across the Arctic.

Cold weather even sweeps the coast of northernmost Norway where the Arctic waters are kept ice-free by the warm Gulf Stream. In Kirkenes, on the border to Russia, the thermometer read -25°C on Saturday outside the Barents Observer’s office.

On the Kola Peninsula, Sunday November 28 came with temperatures from -18°C to -30°C the news online Severpost reported.

Further east in the Russian Arctic, quickly accumulating sea-ice on the Northern Sea Route has created a critical situation as a number of ships have been trapped in thick sea-ice for several weeks.

Inari, northern Finland. Photo: Thomas Nilsen

NASA Data On Global Sea Ice Area Shows A Growth Equal To The Size Of Belgium Since 1982!

by P. Gosselin,  Nov 30, 2021 in NoTricksZone


Data sources like the National Snow and Ice Data Center show global sea ice has been” drastically decreasing for a long time” and so we need to panic and overhaul the entire carbon economy. We hear this daily in the media.

Surprising global sea ice area findings

But Zoe has analyzed what she characterizes as a “very legitimate source” of data from NASA, (here, or here). And according to her findings, the data from these sources suggest global sea ice loss is not as dramatic as some institutes would like us to believe it is. In fact there ‘s been a gain!

Zoe plotted the data going back 40 years, from 1982 to 2021, the “Global Sea Ice Area Fraction”, which “is a proportion of the entire Earth’s surface that is ice over water.”

“As you can see, about 3.6% (on average) of our planet’s area is covered in ice over water,” reports Zoe. “In the last 40 years, ice over water has INCREASED, and not decreased, as popularly claimed.”

According to Zoe, the observed increase is equivalent to ~30,600 km², or “roughly the size of Belgium”.

Physicists: Climate Model Error Overestimates CO2 Impact On Global Temps By Factor Of 5

by K. Richard, Nov 22, 2021 in NoTricksZone


A new study suggests CO2 molecules have little consequential impact affecting outgoing radiation, and that climate models attribute global temperature effects to CO2 that are fundamentally erroneous.

Russian physicists (Smirnov and Zhilyaev, 2021) have published a peer-reviewed paper in the Advances in Fundamental Physics Special Issue for the journal Foundations.

They assesses the role of CO2 molecules in the standard atmosphere and assert “we have a contradiction with the results of climatological models in the analysis of the Earth’s greenhouse effect.”

Key points from the paper include the following:

1. Climate model calculations of CO2’s impact on global temperatures are in error by a factor of 5 as a result of “ignoring, in climatological models, the Kirchhoff law” which says radiators are “simultaneously the absorbers.”

2. Change in the concentration of an optically active atmospheric component (like CO2) “would not lead to change in the outgoing radiative flux.”

3. CO2 molecules “are not the main radiator of the atmosphere.” Water vapor molecules are, and thus they “may be responsible for the observed heating of the Earth.”

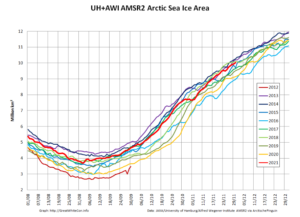
Climate Fail: Arctic Sea Ice Growing, Nearing Highest Extent In Two Decades

by T. Lison, Nov 24, 2021 in ClimateChangeDispatch


t’s so cold in the Arctic that:

Two icebreakers are on the way to rescue ice-locked ships on Northern Sea Route (snip)

District authorities in the Russian Far East have decided to commission two icebreakers to aid the vessels currently ice-locked in the East Siberian Sea. (snip)

The commissioning of the powerful icebreaking vessels comes as severe sea-ice conditions have taken shippers by surprise. There are now about 20 vessels that either are stuck or struggling to make it across the icy waters.

But what about the Antarctic ice cap?

That’s not about to melt either:

[T]he South Pole also just witnessed a historically cold winter. As reported last month: “Between the months of April and September, the South Pole averaged a temperature of -61.1C (-78F). Simply put, this was the region’s coldest 6-month spell ever recorded, and it comfortably usurped the previous coldest ‘coreless winter‘ on record: the -60.6C (-77F) from 1976 (solar minimum of weak cycle 20).”

In  fact, it turns out that, according to a study released a week ago:

PALEOCLIMATE DATA INDICATE THERE WAS LESS ARCTIC SEA ICE DURING THE PRE-INDUSTRIAL PERIOD THAN IN MODERN TIMES, OR WHEN CO2 CONCENTRATIONS WERE 100 PPM LOWER THAN TODAY (280 VS. 380 PPM).

Scientists (Diamond et al., 2021) assert that during the 18th and 19th centuries Arctic sea ice extent minimum (September) values averaged 5.54 million km².

New Study: Modelers Got Aerosols All Wrong…CO2 Climate Sensitivity Likely Another 0.4°C Overstated!

by P. Gosselin, Nov 26, 2021 in WUWT


Die kalte Sonne reports on a new aerosol study by Liu et al.

The results are a major blow to the high greenhouse-gas climate sensitivity modelers.

IPCC scientists have a favorite wild card they often use to explain serious model discrepancies: aerosols. Mysterious cooling events in the past are often explained away by aerosols from major volcanic eruptions, for example. They act to filter out sunlight.

ccording to IPCC climate models, the mean global temperature should have risen by 1.5°C since 1850 due to the higher CO2 concentrations. But best estimates show that it has instead risen by only 1.1°C. So what about the missing 0.4°C?

Naturally, the missing 0.4°C of warming since 1850 gets explained by the higher 20th century aerosol levels in the atmosphere – due to the burning of fossil fuels. Air pollution by man over the course of the late 19th century and entire 20th century are said to have dimmed the earth, and thus this explains the 0.4°C less warming.

Surprise: global aerosol emissions have been flat over past 250 years

But now results by a new study appearing in the journal Science Advances by Liu et al tells us that the forcing by aerosols had to have been overestimated by climate modelers. IPCC modelers insisted that 20th century aerosol concentrations were higher than during the pre-industrial times, and this is what kept the climate from warming by 1.5°C.

According to the scientists led by Liu, however, atmospheric aerosols in the preindustrial times were just as high as they were just recently. They were in fact more or less constant over the past 250 years. No change means it could not have been aerosols putting the brakes on temperature rise:

That’s a real embarrassment for the IPCC modelers. It means CO2 climate sensitivity has been overestimated.

Physicists: Climate Model Error Overestimates CO2 Impact On Global Temps By Factor Of 5

by K. Richard, Nov 22, 2021 in NoTricksZone


A new study suggests CO2 molecules have little consequential impact affecting outgoing radiation, and that climate models attribute global temperature effects to CO2 that are fundamentally erroneous.

Russian physicists (Smirnov and Zhilyaev, 2021) have published a peer-reviewed paper in the Advances in Fundamental Physics Special Issue for the journal Foundations.

They assesses the role of CO2 molecules in the standard atmosphere and assert “we have a contradiction with the results of climatological models in the analysis of the Earth’s greenhouse effect.”

Key points from the paper include the following:

1. Climate model calculations of CO2’s impact on global temperatures are in error by a factor of 5 as a result of “ignoring, in climatological models, the Kirchhoff law” which says radiators are “simultaneously the absorbers.”

2. Change in the concentration of an optically active atmospheric component (like CO2) “would not lead to change in the outgoing radiative flux.”

3. CO2 molecules “are not the main radiator of the atmosphere.” Water vapor molecules are, and thus they “may be responsible for the observed heating of the Earth.”

Emission Reductions From Pandemic Had Unexpected Effects on Atmosphere

by J. Lee & J. O’Neill, Nov 9, 2021 in JetPropulsionLaboratory


Earth’s atmosphere reacted in surprising ways to the lowering of emissions during the pandemic, showing how closely climate warming and air pollution are linked.

The COVID-19 pandemic and resulting limitations on travel and other economic sectors by countries around the globe drastically decreased air pollution and greenhouse gas emissions within just a few weeks. That sudden change gave scientists an unprecedented view of results that would take regulations years to achieve.

A comprehensive new survey of the effects of the pandemic on the atmosphere, using satellite data from NASA and other international space agencies, reveals some unexpected findings. The study also offers insights into addressing the dual threats of climate warming and air pollution. “We’re past the point where we can think of these as two separate problems,” said Joshua Laughner, lead author of the new study and a postdoctoral fellow at Caltech in Pasadena, California. “To understand what is driving changes to the atmosphere, we must consider how air quality and climate influence each other.”

Published Nov. 9 in the Proceedings of the National Academy of Sciences, the paper grew from a workshop sponsored by Caltech’s W.M. Keck Institute for Space Studies, led by scientists at that institution and at the Jet Propulsion Laboratory in Southern California, which is managed by Caltech. Participants from about 20 U.S. and international universities, federal and state agencies, and laboratories pinpointed four atmospheric components for in-depth study: the two most important greenhouse gases, carbon dioxide and methane; and two air pollutants, nitrogen oxides and microscopic nitrate particles.

Carbon Dioxide

The most surprising result, the authors noted, is that while carbon dioxide (CO2) emissions fell by 5.4% in 2020, the amount of CO2 in the atmosphere continued to grow at about the same rate as in preceding years. “During previous socioeconomic disruptions, like the 1973 oil shortage, you could immediately see a change in the growth rate of CO2,” said David Schimel, head of JPL’s carbon group and a co-author of the study. “We all expected to see it this time, too.”

Using data from NASA’s Orbiting Carbon Observatory-2 satellite launched in 2014 and the NASA Goddard Earth Observing System atmospheric model, the researchers identified several reasons for this result. First, while the 5.4% drop in emissions was significant, the growth in atmospheric concentrations was within the normal range of year-to-year variation caused by natural processes. Also, the ocean didn’t absorb as much CO2 from the atmosphere as it has in recent years – probably in an unexpectedly rapid response to the reduced pressure of CO2 in the air at the ocean’s surface.

Be Thankful That COP26 Has Ended

by F. Menton, Nov 14, 2021 in WUWT


If you have been following the news at all for the past several weeks, you know that the latest gigantic UN “climate” conference, going by the name COP (Conference of Parties) 26, has been taking place in Glasgow, Scotland. Mercifully, it ended yesterday, Saturday, November 13. All of those hundreds of private jets have now flown home.

Every time one of these UN confabs takes place, you have to hold your breath fearing that some tremendously damaging result will emerge. But, reviewing the final outcome of this latest conference, my comment is that we climate realists have gotten about the best result we could have hoped for. If you read some mainstream news sources, you may well get exactly the opposite impression. So let me give my reasoning.

At this point, there are basically two paths that the world might take in the movement toward so-called “decarbonization” of the energy system:

  • Path 1 is the path of strict world socialism. Of course, this is the preferred path of climate activists and UN bureaucrats. In this scenario, the entire world is forced, through binding international agreements, into an energy straightjacket, mandating reduction and then elimination of the use of fossil fuels within two or three decades at most.
  • Path 2 is what happens when there are no compacts with material binding worldwide energy restrictions. On this path, everybody talks a good game about decarbonization but, lacking meaningful binding agreements, most of the countries, with most of the population, continue to pursue whatever energy system is most reliable and cost effective. In practice that almost inevitably means fossil fuels for most to all applications. Meanwhile, a small number of wealthy, small-population jurisdictions that somehow become obsessed with the perceived virtue of eliminating fossil fuels — likely examples being Germany, California, New York, the UK, and perhaps South Australia (aggregating about 2-3% of world population) — will push the limits of decarbonization and intermittent renewable energy sources.
  • They will then be the guinea pigs for the rest of the world to find out whether a decarbonized energy system can be made to work, and at what cost.

….

Greenland Sees Significant Snow, Ice Mass Loss Slowdown Over Past Decade, Danish Data Show

by P. Gosselin, Nov 14, 2021 in NoTricksZone


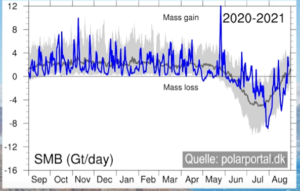
Data from the Danish Polar Portal shows Greenland ice melt slowing significantly over past 10 years. Increasingly rapid mass loss is a myth. 

German climate site Die kalte Sonne here looks at whether Greenland is really melting faster or not in its 78th climate and energy video (3rd segment).

Satellite measurement has allowed accurate measurements over the years and so reliable trends are detectable.

Greenland has added mass since July

Over the past year, since September 2020, Greenland has seen a number of heavy snowfalls, as depicted by the solid blue line in the chart by the Danish polarportal.dk:

Image cropped: Die kalte Sonne.

BBC’s Fake GHGs Graph

by P. Homewood, Nov 15, 2021 in NotaLot ofPeopleKnowThat


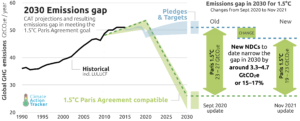
For the last few weeks, the BBC has been regularly publishing the above graph from Climate Action Tracker, showing the extra emission reductions resulting from the new NDCs, National Plans, submitted for COP26.

Essentially they estimate a figure of 3.3 to 4.7 GtCO2e for all GHGs. Significantly this means that they will still be much higher than 2010 in 2030. According to the science, they need to be cut by 45% from 2010 levels to stay on track for 1.5C

Curiously however in the last few days, the BBC has dropped the above graph, and replaced with an ostensibly fake one, which claims that the new COP26 pledges will cut emissions by 10.5 GtCO2e, more than double the Climate Tracker numbers, bringing 2030 levels down to 90% of 2010 ones.

Glasgow Is Fake…Number Of Typhoons Formed In Pacific Has Trended Downward Significantly Since 1951!

by P. Gosselin, Nov 12, 2021 in NoTricksZone


The Glasgow climate conference has been a three-ring circus of doomsday clowns, all warning of ever increasing extreme weather events. But as hurricane trends have shown, most of it is baseless hysteria.

Pacific typhoons trending downward

As the 2021 tropical cyclone season for the northern hemisphere approaches its end, the Japan Meteorological Agency (JMA) presents the latest data for Pacific typhoons — going back to 1951.

Autocorrelation in CO2 and Temperature Time Series

by A. May, Nov 14, 2021 in WUWT


In my last post I plotted the NASA CO2 and the HadCRUT5 records from 1850 to 2020 and compared them. This was in response to a plot posted on twitter by Robert Rohde implying they correlated well. The two records appear to correlate because the resulting R2 is 0.87. The least square’s function used made the global temperature anomaly a function of the logarithm to the base 2 of the CO2 concentration (or ‘log2CO2‘). This means the temperature change was assumed to be linear with the doubling of the CO2concentration, a common assumption. The least squares (or ‘LS’) methodology assumes there is no error in the measurements of the CO2 concentration and all error resulting from the correlation (the residuals) resides in the HadCRUT5 global average surface temperature estimates.

In the comments to the previous post, it became clear that some readers understood the computed R2(often called the coefficient of determination), from LS, was artificially inflated because both X (log2CO2) and Y (HadCRUT5) were autocorrelated and increased with time. But a few did not understand this vital point. As most investors, engineers, and geoscientists know, two time series that are both autocorrelated and increase with time will almost always have an inflated R2. This is one type of “spurious correlation.” In other words, the high R2 does not necessarily mean the variables are related to one another. Autocorrelation is a big deal in time series analysis and in climate science, but too frequently ignored. To judge any correlation between CO2 and HadCRUT5 we must look for autocorrelation effects. The most tool used is the Durbin-Watson statistic.

The Durbin-Watson statistic tests the null hypothesis that the residuals from a LS regression are not autocorrelated against the alternative that they are. The statistic is a number between 0 and 4, a value of 2 indicates non-autocorrelation and a value < 2 suggests positive autocorrelation and a value >2 suggests negative autocorrelation. Since the computation of R2 assumes that each observation is independent of the others, we hope that we get a value of 2, that way the R2 is valid. If the regression residuals are autocorrelated and not random—that is normally distributed about the mean—the R2 is invalid and too high. In the statistical program R, this is done—using a linear fit—with only one statement, as shown below:

17 More Studies Show No Unusual Warming Trend In Recent Centuries…And A Warmer Holocene

by K. Richard, Nov 11, 2021 in NoTricksZone


Cruz et al., 2021 (Argentina)

Argentina’s (Tixi Cave) present annual temperature is 13.8°C. It was 3.5°C (17.3°C), 1.7°C (15.5°C), 3°C (16.8°C), and 4.5°C (18.3°C) warmer than today 3496, 1656, 656, and 160 years before present, respectively. So ~1860 was 4.5°C warmer.


China and India among 22 nations calling for key section to be cut from COP26 agreement

by Angela Dewan, Ivana Kottasová and Amy Cassidy, CNN, Updated 1915 GMT (0315 HKT) November 11, 2021


Glasgow, Scotland (CNN)After 11 days of climate talks that have included progress on protecting forests, phasing out coal and transitioning to electric cars, the future of our planet has boiled down to one key thing: who’s going to pay for the mess we’re in?

On Thursday afternoon, the eve of the final day of COP26, huge gaps remain between what different countries want on key issues, including how ambitious the world should be in slashing greenhouse gas emissions, all part of what climate folks call “mitigation.”
In what has been the fiercest opposition to the summit’s draft agreement published Wednesday, Bolivia’s chief negotiator Diego Pacheco said his country and 21 other allied nations — including major emitters like China, India and Saudi Arabia — would oppose the entire section on climate change mitigation.

Temperature Bottom Falling Out: Antarctica’s Coldest Half-Year Since Measurements Began 60 Years Ago

by P. Gosselin, Nov 9, 2021 in NoTricksZone


Antarctica sets a record cold six month period…Neumayer station sets new winter record low, sees rapid cooling since 2000!

German Die kalte Sonne here features Antarctica’s record cold winter – the coldest since temperature measurements began some 60 years ago.

Coldest April-September period

The Amundsen Scott station at the South Pole recorded a mean temperature of -60.9°C for the April 1 to September 30 period, according to the US National Snow and Ice Data Center (NSIDC). For the June-July-August period, the mean was minus 62.9°C  — the second coldest recorded.

Apparently the 140 or so ppm added CO2 couldn’t trap enough heat to prevent a record cold from being set. The previous record for June-July-August was set in 2004.

Neumayer sets record cold, sees 3°C of cooling since 1985

Die kalte Sonne reports that a record was also set at the German Neumayer Antarctic station, located on the Antarctic coast, which saw a mean June-July-August temperature of -28.6°C.

A Potted History of Glaciers

by P. Homewood, Nov 10, 2021 in NotaLotofPeopleKnowThat


A friend recently suggested that “melting glaciers” must surely prove “global warming is true”.

It is a common belief. After all, glaciers are a visible phenomenon and it all sounds logical.

As you know, I have written extensively about glaciers, (see the “glaciers” tab on the sidebar). But it is worth posting this potted history of them:

Summary

The modern day retreat of glaciers is part of a much longer natural cycle. Indeed, we find evidence of that cycle going back long before the Middle Ages.

Lamb, for instance, claims that glaciers in the Alps and Norway were advancing between 800 and 400BC, reaching an extent almost as great as during the Little Ice Age. They advanced again around AD600 to a similar position as before.

In between times, of course, the same glaciers also retreated, both during the Roman Warm Period and the Medieval Warming Period.

Whether man-made warming has played any part in modern glacial retreat, we know that:

  • Most of the retreat since the 18thC occurred before any possible impact from humans.
  • Glaciers were smaller than now in the Middle Ages
  • There is nothing unprecedented or alarming about the current state of the world’s glaciers

All of this is common knowledge amongst glaciologists. But for some reason the world of climate science does not want the public to know.

COP26–The Stage Show

by P. Homewood, Nov 9, 2021 in NotaLotofPeopleKnowThat


Maybe it’s just me, but I get the impression that COP26 is little more than a stage managed exercise in virtue signalling, allowing world leaders and the great and the good to pat themselves on the back and pretend they are saving the planet.

Today’s discussions will mainly focus, believe it or not, on gender issues! Yesterday’s big event was a speech by yesterday’s man, Obama, calling on “young people to remain angry”.

If you think back to Paris and earlier COPs, they were acted out as some sort of drama. Arguments between countries, late night sessions, all miraculously resolved at the 11th hour with an “Agreement” to save the planet.

Maybe the scene for COP26 was set months ago, when it became clear that China, India and the rest of the developing world would not commit to any emission reductions by 2030, or for that matter 2035.

And if any doubts about this lingered, the refusal of Xi Jinping and Vladimir Putin to turn up soon cleared those up.

To recap, the main purpose of COP26 was to get countries to set new emission targets, as mandated every five years under the Paris Agreement. Given that the pledges made at Paris, the NDCs, or Nationally Determined Contributions, only set targets for 2030, the logic was that this year would see pledges for 2035.

But this has not been the case. Instead some countries have made small adjustments to their 2030 targets, which in overall terms won’t make the blindest of difference:


See also:  BBC’s COP26 Propaganda

Presidents Xi and Putin (and the Hedge Funds!) are laughing at us

by P. Homewood, Nov 8, 2021 in NotaLotofPeople KnowThat


The gap between rhetoric and fact is a perennial feature of politics. But seldom can the chasm between claim and reality have been as wide as that displayed by Alok Sharma at the Cop26 conference in Glasgow. The British president of the latest intergovernmental climate change gathering told the delegates (and the world’s media) that “the end of coal is in sight”, as a result of the agreement he had negotiated.


That was the rhetoric. Now the fact. Not only was the declaration to phase out coal by the 2040s not signed by the world’s top three consumers (China, India and America, which account for more than 70 per cent of the global CO2 emissions from burning the stuff); the pledge itself was neutered by the addition of the get-out “or as soon as possible thereafter”.

CO2 and Temperature

by A. May, Nov 9, 2021 in WUWT


I had a very interesting online discussion about CO2 and temperature with Tinus Pulles, a retired Dutch environmental scientist. To read the whole discussion, go to the comments at the end of this post. He presented me with a graphic from Dr. Robert Rohde from twitter that you can find here. It is also plotted below, as Figure 1.

Conclusion

I’m not impressed with Rohde’s display. The coefficient of correlation is decent, but it does not show that warming is controlled by changes in CO2, the temperature reversals are not explained. The reversals strongly suggest that natural forces are playing a significant role in the warming and can reverse the influence of CO2. The plots show that, at most, CO2 explains about 50% of the warming, something else, like solar changes, must be causing the reversals. If they can reverse the CO2-based warming and overwhelm the influence of CO2 they are just as strong.

Climate change is no catastrophe

by M. Shellenberger, Nov 3, 2021 in Unherd


No global problem has ever been more exaggerated than climate change. As it has gone from being an obscure scientific question to a theme in popular culture, we’ve lost all sense of perspective.

Here are the facts: in Europe, emissions in 2020 were 26% below 1990 levels. In the United States, emissions in 2020 were 22% below 2005 levels. Emissions are likely to start declining, too, in developing nations, including China and India, within the next decade. Most nations’ emissions will be bigger this year than last, due to post-Covid economic growth. But global emissions are still likely to peak within the next decade.

And the result will be a much smaller increase in global average temperatures than almost anyone predicted just five years ago. The best science now predicts that temperatures are likely to rise just 2.5-3°Cabove pre-industrial levels. It’s not ideal, but it’s a far cry from the hysterical and apocalyptic predictions of 6°C, made just a decade ago. A 3°C increase is hardly an existential threat to humanity.

Not that you’d know it, if you had half an eye on the headlines this summer. The floods, fires and heatwaves that plagued the world were, for many observers, proof that the impacts of climate change have already become catastrophic. In Europe, more than 150 people died in flooding. In the United States, wildfire season started earlier and lasted longer, razing hundreds of thousands of acres. Around the world, hundreds died from heatwaves.

But again, it’s worth reminding ourselves of the facts: there has been a 92% decline in the per decade death toll from natural disasters since its peak in the 1920s. In that decade, 5.4 million people died from natural disasters. In the 2010s, just 0.4 million did. Globally, the five-year period ending in 2020 had the fewest natural disaster deaths of any five-year period since 1900. And this decline occurred during a period when the global population nearly quadrupled — and temperatures rose more than 1°C degree centigrade above pre-industrial levels.

The climate moaners need to get some perspective from history

by Ian Plimmer, Nov 4, 2021, SpectatorAustralia


Greta Thunberg rejects all ideas of the enlightenment. Despite what she wails, she is now living in the best times ever to be a child on planet Earth. She can actually go to FLOP26, something that few of us would want to do. Would she prefer to live in the worst of times when there was panic, suffering, environmental damage, death and no hope which she claims exists today?  

We now eat better, are less affected by natural disasters and are able to cope with extremes of weather and climate. During the last 4 of at least 20,000 generations of humans, child mortality has decreased and global human longevity increased from 25 to 79 years. The climate moaners need to get some perspective from history. 

The worst years to live since the time of Jesus were 535-550 AD because massive volcanic eruptions, perhaps Kamchatka or Alaska in 535-536 AD and Ilopango in El Salvador from 539-540 AD. The Northern Hemisphere atmosphere with filled with dust and acid sulphate clouds. These volcanic eruptions were coincidental with extraterrestrial impacts in March 536 AD in the Gulf of Carpentaria and elsewhere in August 536 AD. To make matters worse, these were at the time of a Solar Minimum. 

The Sun was dimmed for 18 months, a white sulphuric acid aerosol cloud enveloped Europe, global temperature dropped by 1.5 to 2.5°C producing worldwide crop failures and death by starvation. There was migration (e.g. Slavic speaking people), political turmoil and the collapse of empires (e.g. Sasanian Empire in Persia). Tree rings show almost no growth for a few years.  


Continuer la lecture de The climate moaners need to get some perspective from history