by D. Siegel, December 199, 2019 in MediumWork
In this piece, I’m going to summarize some of the more recent work by scientists and statisticians on climate. It’s important to understand that …
- The alarm increased dramatically in 2013, with the UN’s decision to promote the most extreme warming scenarios (highly recommended).
- The policy cart is way out in front of the scientific horse.
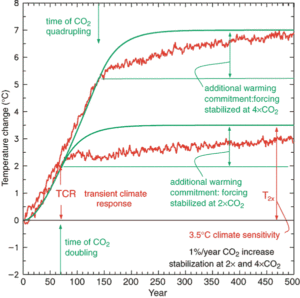
- As time goes on, the less sensitivity to CO2 the models are showing. It is harder and harder to scientifically justify the claims made by the UN in 2013.
- There is no calculation based on first principles that leads to a large warming driven by CO2, none.
- The major publications have declared their bias toward catastrophic warming from CO2. Nature Climate Science says anything they publish must be “grounded in the current literature.” That’s their way of saying “The debate is over, we don’t want anyone presenting evidence to the contrary, now we’re just promoting the long-term projections that haven’t come true yet.” This makes it difficult for scientists to exchange knowledge.
- Publications are now releasing two peer-reviewed papers per day confirming exactly what the UN predicts and zero papers questioning the assumptions. Many scientists complain that their papers are not accepted because they don’t have the right keywords.
- The US government alone gives out more than $12 billion in research grants each year to unequivocally show global warming is happening. Total yearly spend worldwide in 2018 was more than half a trillion dollars.
- The UN says we need to spend $2.4 trillion per year to prevent catastrophe. No one dies from global warming today, yet 1.6 million people die each year from indoor smoke. That’s a lot of money to spend on a future projection.
- Claims of a great “consensus” of experts agreeing are a) inaccurate and b) meaningless. Science is not a personality contest. For a breakdown of the claims, see “Why Scientists Disagree about Global Warming.”
- There is a tremendous amount of distortion of the science, the “consensus,” and the political agenda behind the global climate-change movement.
- …


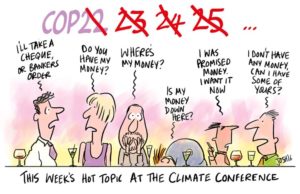

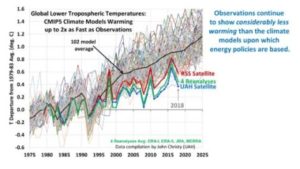
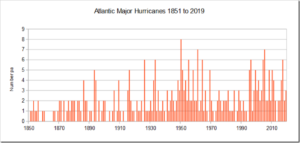
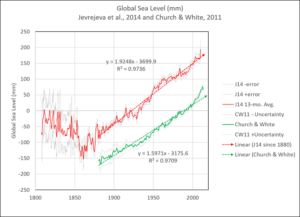 Figure 1. Jevrejeva et al., 2014 (red) and Church & White, 2011 (green).