Archives de catégorie : climate-debate

CMIP5 Model Atmospheric Warming 1979-2018: Some Comparisons to Observations

by Roy Spencer, December 12, 2019 in WUWT


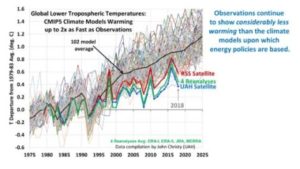
I keep getting asked about our charts comparing the CMIP5 models to observations, old versions of which are still circulating, so it could be I have not been proactive enough at providing updates to those. Since I presented some charts at the Heartland conference in D.C. in July summarizing the latest results we had as of that time, I thought I would reproduce those here.

The following comparisons are for the lower tropospheric (LT) temperature product, with separate results for global and tropical (20N-20S). I also provide trend ranking “bar plots” so you can get a better idea of how the warming trends all quantitatively compare to one another (and since it is the trends that, arguably, matter the most when discussing “global warming”).

From what I understand, the new CMIP6 models are exhibiting even more warming than the CMIP5 models, so it sounds like when we have sufficient model comparisons to produce CMIP6 plots, the discrepancies seen below will be increasing.

Global Comparisons

First is the plot of global LT anomaly time series, where I have averaged 4 reanalysis datasets together, but kept the RSS and UAH versions of the satellite-only datasets separate. (Click on images to get full-resolution versions).

GLOBAL TEMPERATURES HOLDING STEADY FOR TWO DECADES

by Climate Science, December 13,  2019


Global temperatures have been holding nearly steady for almost two decades according to satellites from the Remote Sensing Systems (RSS) and University of Alabama at Huntsville (UAH).6You will never see that in the mass media.

2018 is the 3rd year in a row of cooling global temperatures – So far 2018 was the third year in a row that the globe has cooled off from its El Nino peak set in 2015.

Norwegian Professor Ole Humlum explained in his 2018 “State of the Climate Report”: “After the warm year of 2016, temperatures last year (in 2018) continued to fall back to levels of the so-called warming ‘pause’ of 2000-2015. There is no sign of any acceleration in global temperature, hurricanes or sea-level rise. These empirical observations show no sign of acceleration whatsoever.”

While 2005, 2010, 2015, and 2016 were declared the “hottest years” or “near -hottest,”  based on heavily altered surface data by global warming proponents, a closer examination revealed the claims were “based on year-to-year temperature data that differs by only a few HUNDREDTHS of a degree to tenths of a degree Fahrenheit – differences that were within the margin of error in the data.” 7

MIT climate scientist Dr. Richard Lindzen ridiculed “hottest year” claims. “The uncertainty here is tenths of a degree. It’s just nonsense. This is a very tiny change period,” Lindzen said. “If you can adjust temperatures to 2/10ths of a degree, it means it wasn’t certain to 2/10ths of a degree.”

In 2015, the Associated Press was forced to issue a “clarification” on “hottest year” claims, stating in part: “The story also reported that 2014 was the hottest year on record, according to the National Oceanic and Atmospheric Administration and NASA, but did not include the caveat that other recent years had average temperatures that were almost as high  – and they all fall within a margin of error that lessens the certainty that any one of the years was the hottest.”

Climatologist Pat Michaels explained that, in any case, the world’s temperature “should be near the top of the record given the record only begins in the late 19th century when the surface temperature was still reverberating from the Little Ice Age.”

“Hottest year” claims are purely political statements designed to persuade the public that the government needs to take action on man-made climate change. In addition, the claims of “hottest year” are based on surface data only dating back to the late 19th century, and also ignore the temperature revisions made by NASA and NOAA that have enhanced the warming trend by retroactively cooling the past. 8

6 The Pause Lives on: Global Satellites: 2016 not Statistically Warmer than 1998 – Climatologist Dr. Roy Spencer – January 4, 2017
7 Dr. David Whitehouse noted the ‘temperature pause never went away’ – January 19, 2017
8 Climate analyst Tony Heller – Real Climate Science – February 14, 2017

3000-Year-Old Trees Excavated Under Icelandic Glacier

by P. Homewood, December 12, 2019 in NotaLotofPeopleKnowThat


Ancient tree stumps found under Breiðamerkurjökull glacier in Southeast Iceland are confirmed to be roughly 3,000 years old. RÚV reports.

A specialist believes the remarkably well-preserved stumps were part of a massive forest that disappeared after a long period of a warm climate.

One of the tree stumps was found in Breiðamerkursandur a couple of months ago, and once it was being salvaged a second, larger one was found. The smaller one was sent for examination while the larger will be examined at a later time.

Examinations revealed that the tree stump died very quickly at 89-years-old in the month of June. Nearby sediments and data suggest that the glacier itself was the culprit.

The tree stumps are from a period when Iceland was covered in forests. Even though 9th century Norse settlers reported vast forests across the country, it is believed that 3,000 years ago, the forests were much larger, even reaching the highlands. Approximately 500 BC, the climate became colder and glaciers began to form, destroying parts of the forests.

The 3,000-year-old remains of the forest are very well preserved and will be researched thoroughly. “It is absolutely incredible just how well preserved this tree stump is, having been buried under a glacier and that it still looks so whole, as opposed to being all wrinkled up like many of the specimens we have found.” Once examinations conclude, the water will be extracted from the tree stump and it will be filled with wax instead, allowing it to be exhibited.

https://www.icelandreview.com/news/3000-year-old-trees-excavated-under-glacier/

Discovering ancient forests under receding glaciers is not confined to Iceland. Remains of trees dating back to the Middle Ages have been found under the Juneau and Exit Glaciers in Alaska, as well under glaciers in Patagonia.

Tree stumps have also turned up under Swiss glaciers, carbon dated to about 4000 years ago.

The simple reality is that glaciers worldwide expanded enormously during the Little Ice Age, arguably to their greatest extent since the Ice Age. Despite decades of retreat since the 19thC, they are still abnormally large by historical standards.

The 2019 Atlantic Hurricane Season

by P. Homewood, December 11, 2019 in NotaLotofPeopleKnowThat


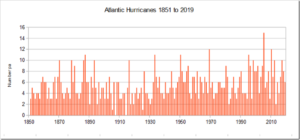
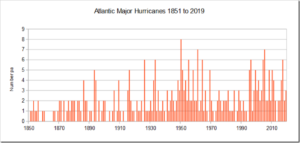
The Atlantic hurricane season has now officially ended, so let’s check the numbers.

https://www.aoml.noaa.gov/hrd/tcfaq/E11.html

http://rammb.cira.colostate.edu/products/tc_realtime/season.asp?storm_season=2019

There have been six hurricanes in total, including three major ones, Dorian, Humberto and Lorenzo. Coincidentally both numbers are the same as the average since 1950.

According to NOAA’s Hurricane Research Division, many hurricanes were missed in the earlier decades. Systematic aircraft reconnaissance began in 1944, but this only covered half of the Atlantic basin, until daily satellite monitoring started in 1966.

Victoria Secrets Exposed…More Falsehoods By Spiegel, Guardian… Victoria Falls Variability Nothing To Do With CO2.

by P. Gosselin, December 11, 2019 in NoTricksZone


Not CO2 related

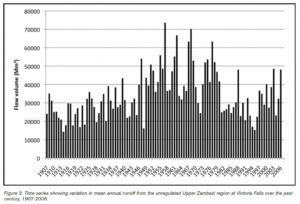
A little later in the report we also find a flow diagram for the Victoria Falls:

Figure: Water flow rate-volume at the Victoria Falls an den 1907-2006. Source: Beilfuss 2012 (immediately pdf)

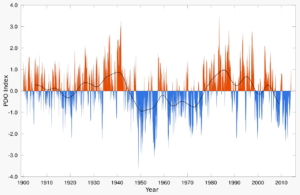
We see a strong variability from year to year. On a scale of several decades, the period 1940-1980 is characterized by particularly high flow rates. The early 20th century was rather dry. A coupling to the 60-year-old ocean cycle offers itself. The Pacific is far away, but the wet Zambezi phase fits quite well into the negative PDO:

igure: The Pacific Decadal Oscillation (PDO). Source: By Giorgiogp2 – Own work, CC BY-SA 3.0, https://commons.wikimedia.org/w/index.php?curid=13297650


Snow Record – Submerged Alps with extraordinary accumulations

by Robert, December 7, 2019 in IceAgeNow


In the face of Global Warming we see scenarios from the ice age.

The Alps were submerged in snow, with truly dramatic accumulations up to 1,500m above sea level, especially considering that we are still at the end of November.

Here are the incredible data:

295cm of snow on the ground at Rifugio Gastaldi – Balme (2.659m asl),
263cm at Macugnaga Rifugio Zamboni (2.075m),
239cm at Rifugio Vaccarone – Giaglione (2.745) m),
227cm at Lago Agnel – Ceresole Reale (2.304m),
222cm at Lago Dietro La Torre – Usseglio (2.360m) and Bocchetta Delle Pisse – Alagna Valsesia (2.410m),
197cm at Larecchio – Montecrestese (1.860m) and Lemon Pancani – Limone Piemonte (1.875m),
191cm in Formazza (2.453m),
188cm in the Del Chiotas Dam – Entracque (2.020m),
185cmin Malciaussia – Usseglio (1,800m),
172cm at Passo Del Moro – Macugnaga (2.820m), 169cm in Clot Of Soma – Pragelato (2.150m),
166cm in Alpe Veglia – Varzo (1.740m),
164cm in Grange Martina – Giaglione (1.967m),
163cm Pian Giasset – Crissolo (2.150m) and Lago Pilone – Sauze D’oulx (2.280m),
156cm Rifugio Mondovi – Roccaforte Mondovi (1.760m),
152cm at Sommeiller – Bardonecchia (2.981m), 150cm in Pian Delle Baracche – Sampeyre (2.135m),
137cm in Alpe Devero – Baceno (1.634m),
129cm in Camparient – Trivero (1.515m),
124cm in Sestriere (2.020m).
Per approfondire http://www.meteoweb.eu/2019/11/meteo-alpi-sommerse-neve-piemonte-sestriere/1350156/#U03AfALMXOVSWFCe.99

See incredible photos:
http://www.meteoweb.eu/2019/11/meteo-alpi-sommerse-neve-piemonte-sestriere/1350156/#1

A Geological Perspective on Sea Level Rise Acceleration

by David Middleton, December 9, 2019 in WUWT


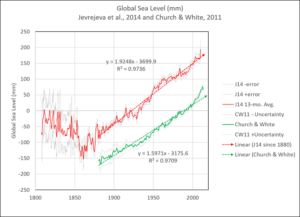
There have been at least three recent peer-reviewed papers asserting an anthropogenic acceleration in the rate of sea level rise (SLR): Church & White, 2006 (CW06), Church & White, 2011 (CW11) and Nerem et al., 2018 (N18). N18 only covers the satellite era (since 1993) and might actually be correct, albeit irrelevant. The primary culprits in the SLR acceleration scam are CW06 and CW11. Two other recent peer-reviewed papers clearly shoot down the notion of a recent anthropogenic acceleration: Jevrejeva et al., 2008 (J08) and Jevrejeva et al., 2014 (J14). This post will focus on CW11 (updated through 2013) and J14.

J08 and J14 indicate that the acceleration, to the extent there is one, started 150-200 years ago, consistent with the end of neoglaciation and that a quasi-periodic fluctuation (~60-yr cycle) is present. CW06 and CW11 also note the 19th Century acceleration; but also assert a more recent acceleration, presumably due to anthropogenic global warming. This SLR acceleration is, at worst, innocuous.

Figure 1. Jevrejeva et al., 2014 (red) and Church & White, 2011 (green).
….

TRIBUNE. Pourquoi les affirmations catastrophistes sur le climat sont fausses

by M. Schellenberger, 10 décembre 2019 in LePoint


Pour l’écologiste pragmatique Michael Shellenberger, les déclarations apocalyptiques s’avèrent scientifiquement erronées et politiquement contre-productives.

Ces dernières semaines, les journalistes et les défenseurs de l’environnement ont fait un certain nombre de prédictions apocalyptiques sur l’impact du changement climatique. L’écologiste Bill McKibben a suggéré qu’en Australie, les incendies causés par le climat avaient rendu les koalas « pratiquement éteints ». Extinction Rebellion affirme : « Des milliards de gens mourront » et « la vie sur Terre est en train de s’éteindre ». Vice magazine soutient que « l’effondrement de la civilisation a peut-être déjà commencé ».

Peu ont plus attiré l’attention sur cette menace que la militante étudiante Greta Thunberg et la représentante démocrate Alexandria Ocasio-Cortez, sponsor du Green New Deal. Cette dernière prétend que « le monde va s’écrouler dans douze ans si nous ne nous attaquons pas au changement climatique ». Dans son nouveau livre, Thunberg affirme : « Vers 2030, nous serons en situation de déclencher une réaction en chaîne irréversible hors du contrôle humain, qui conduira à la fin de la civilisation telle que nous la connaissons. »


See also here: At UN Climate Summit, Alarmists Put Dogma Over Science

Climate Models Have Not Improved in 50 Years

by David Middleton, December 6, 2019 in WUWT


The accuracy of the failed models improved when they adjusted them to fit the observations… Shocking.

The AGU and Wiley currently allow limited access to Hausfather et al., 2019. Of particular note are figures 2 and 3. I won’t post the images here due to the fact that it is a protected limited access document.

Figure 2: Model Failure

Figure 2 has two panels. The upper panel depicts comparisons of the rates of temperature change of the observations vs the models, with error bars that presumably represent 2σ (2 standard deviations). According to my Mark I Eyeball Analysis, of the 17 model scenarios depicted, 6 were above the observations’ 2σ (off the chart too much warming), 4 were near the top of the observations’ 2σ (too much warming), 2 were below the observations’ 2σ (off the chart too little warming), 2 were near the bottom of the observations’ 2σ (too little warming), and 3 were within 1σ (in the ballpark) of the observations.

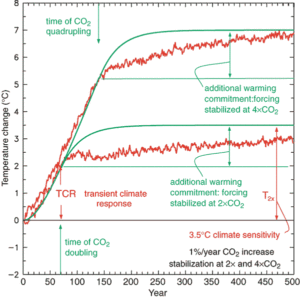
Figure 2. Equilibrium climate sensitivity (ECS) and transient climate response

2019 the Third Least-Chilly in the Satellite Temperature Record

by Roy Spencer, December 6, 2019 in WUWT


It’s that time of year again, when we are subjected to exaggerated climate claims such as in this Forbes article, 2019 Wraps Up The Hottest Decade In Recorded Human History. Given that the global average surface temperature is about 60 deg. F, and most of the climate protesters we see in the news are wearing more clothing than the average Key West bar patron, I would think that journalists striving for accuracy would use a more accurate term than “hottest”.

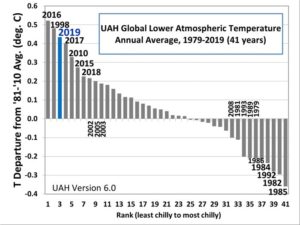
So, I am announcing that in our 41-year record of global satellite measurements of the lower atmosphere, 2019 will come in as 3rd least-chilly.

For the decade 2010-2019, the satellite temperatures averaged only 0.15 C higher than in the previous decade (1990-1999). That’s less than a third of a degree F, which no one would even notice over 10 years.

If you are wondering how your neck of the woods has fared this year, the latest year-to-date plot of 2019 temperature departures from the 30-year average (1981-2010) shows the usual pattern of above- and below-normal, with little visual indication that the global average for 2019 is now running 0.36 deg. C above normal.

Ces villes qui ne se réchauffent pas

by Jean N., 6 décembre 2019 in ScienceClimatEnergie


Non, le réchauffement de la planète n’est pas global comme l’affirment les médias. Selon la dernière version des données officielles de température fournies par le Goddard Institute for Space Studies (GISS) de la NASA (les séries thermométriques terrestres GHCNv4), il existe dans le monde toute une série de villes, villages et régions où aucun réchauffement de la troposphère n’est observé au niveau du sol en fonction du temps. Ceci est d’ailleurs confirmé par la récente étude de Lansner & Pedersen publiée en 2018 (et qui avait fait l’objet d’un article ici-même), mais aussi par d’autres publications qui analysent par exemple le “warming hole” des Etats-Unis (Partridge et al. 2018). Et pourtant, dans ces régions qui ne se réchauffent pas, le taux atmosphérique de CO2 a bel et bien augmenté de manière significative (voir ici). Le but du présent article est d’abord de vous présenter 12 de ces villes et régions. Nous verrons ensuite que le rôle attribué au CO2 est exagéré et que de nombreux facteurs, méconnus, entrent en jeu et jouent probablement un rôle dominant.

1. Présentation de quelques villes et régions qui ne se réchauffent pas.

Dans les lignes qui suivent, les données officielles de température seront utilisées. La qualité de ces données a bien entendu été contrôlée par les gestionnaires locaux des stations météorologiques, et puis par le GISS lui-même. Ne seront présentées que les séries de températures moyennes annuelles. Les données ont ensuite été ajustées pour tenir compte des effets non climatiques, des changements géographiques éventuels de stations de mesure, ainsi que de l’effet de chaleur urbain qui a été déduit. Il s’agit donc de données nettoyées, appelées “GHCN-adj-homogenized”. Chacun peut se les procurer librement sur le site web du GISS (il suffit de cliquer sur un endroit du monde sur la carte ici).

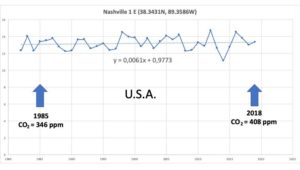
1.1. Commençons par Nashville aux Etats-Unis (Figure 1). Il s’agit de la capitale de l’État du Tennessee qui comptait 668 347 habitants en 2014. Nashville possède un climat subtropical humide (dans la Classification de Köppen) avec des hivers doux qui peuvent être modérément froids et des étés chauds et humides. Les moyennes mensuelles varient entre 3,4 °C pour le mois le plus froid (janvier) et 26,6 °C pour le mois le plus chaud (juillet). On peut voir sur la Figure 1 la relative stabilité de la température moyenne annuelle oscillant autour de 13°C, et ce depuis 1982 (la droite de régression possède une pente très faible, proche de zéro, et valant +0,0061).


Figure 1. Température moyenne annuelle de Nashville (Tennessee, USA) entre 1982 et 2018.


Revolt brewing against EU’s ‘unrealistic’ climate goals

by Frédéric Simon, December 5, 2019 in EurActiv


Czech Prime Minister Andrej Babiš has threatened to veto Europe’s goal of becoming the first climate-neutral continent in the world by 2050, adding his voice to a growing chorus of discontent as EU leaders prepare for heated climate discussions at a summit in Brussels next week.

In a letter to European Commission President Ursula von der Leyen, Babiš said, however, he could still change his mind in exchange for higher financial support from the EU and better investment conditions for nuclear energy.

Private investors are reluctant to pour money into new nuclear power plants, which face escalating costs and growing competition from cheap renewables. New plants are dependent on state support, which require prior approval by the European Commission’s powerful competition department.

“Nuclear plants construction may require changes in the state aid rules,” Babiš wrote in the letter, according to Czech daily Hospodářské noviny, a media partner of EURACTIV.cz.

Funding for new nuclear plants is also an issue for Poland, one of the last remaining EU countries opposed to the bloc’s proposed climate neutrality objective for 2050. At the last EU summit in October, Warsaw called for “significantly larger” amounts of funding under the EU’s next long-term budget before signing up to the 2050 goal.

 …

Cartology Affirms Relative Sea Levels Were Similar To Or HIGHER Than Now During The Little Ice Age

by K. Richard, December 5, 2019 in NoTricksZone


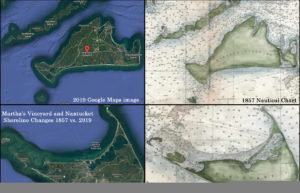
Surprisingly accurate nautical maps created the 17th to 19th centuries strongly suggest coastal land area in both hemispheres were quite similar to today’s. There is even evidence relative sea levels were higher than now back then.

Image Source: Etsy.com

Globally, coasts have grown since the 1980s

Between 1985 and 2015, satellite observations indicate the world’s coasts gained 13,565 km²  more land area than they had lost to the seas (Donchyts et al., 2016).

This means more coastal land area is above sea level today than in the 1980s.

This surprises scientists, as they “expected the coast would start to retreat due to sea level rise,” but instead they observed “coasts are growing all over the world.”

UAH Global Temperature Update for November 2019: +0.55 deg. C

by Roy Spencer, December 2, 2019 in WUWT


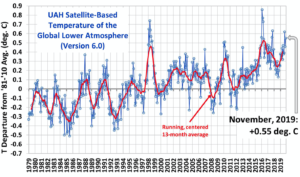
The Version 6.0 global average lower tropospheric temperature (LT) anomaly for November, 2019 was +0.55 deg. C, up from the October value of +0.46 deg. C.

The linear warming trend since January, 1979 remains at +0.13 C/decade (+0.11 C/decade over the global-averaged oceans, and +0.18 C/decade over global-averaged land).

The UAH LT global anomaly image for November, 2019 should be available in the next few days here.

The global and regional monthly anomalies for the various atmospheric layers we monitor should be available in the next few days at the following locations:

Lower Troposphere: http://vortex.nsstc.uah.edu/data/msu/v6.0/tlt/uahncdc_lt_6.0.txt
Mid-Troposphere: http://vortex.nsstc.uah.edu/data/msu/v6.0/tmt/uahncdc_mt_6.0.txt
Tropopause: http://vortex.nsstc.uah.edu/data/msu/v6.0/ttp/uahncdc_tp_6.0.txt
Lower Stratosphere: http://vortex.nsstc.uah.edu/data/msu/v6.0/tls/uahncdc_ls_6.0.txt


Some thoughts and photos from #COP25 in Madrid- What “climate emergency”?

by A. Watts, December 4, 2019 in WUWT


When my live feed presentation is ready on YouTube, I’ll add it.

My #COP25 video presentation

In short, here’s my impression of COP25:

It was a whole lot of hot air talking about cooling the planet, shouting it is “time for action”, while putting out hands asking for money.

The conference seemed subdued compared to the bigger shindigs of Copenhagen in 2009 (which ClimateGate successfully skewered) and Paris in 2015 which got hamstrung by Donald Trump a year later.

Perhaps it was due to the last-minute switch from Chile, perhaps people are realizing these conferences are pointless.

For certain, we live in interesting times.

Next week I’m off to the AGU convention in San Francisco. But, I have to shop for galoshes first.


ORANGE ‘HEAVY SNOW’ ALERTS ISSUED ACROSS SPAIN

by Cap Allon, November 11, 2019 in Electroverse


Following Spain’s weekend of surprise early-season-snow, ORANGE ALERTS have now been issued across the country as the prospect of yet more severe wintry-weather looms — residents have been urged to prepare.

Spain’s state weather agency AEMET had predicted last weekend’s “polar front” and subsequently placed parts of Mallorca and Menorca on orange alert. Now though, an additional 33 provinces have been placed under winter-weather alerts across the country -from Lugo in the north, to Malaga in the south- as further Arctic plunges appear set to engulf ALL of Western/Southwestern Europe this week.

A staggering 40 cm (15.8 inches) of snow buried Northern Spain’s ski resorts over the weekend, including Fuentes de Invierno, in Asturias — as reported by murciatoday.com.

Snow also fell in more unexpected areas, like Port de Pollenca a small town in Northern Majorca.

https://globalcryospherewatch.org

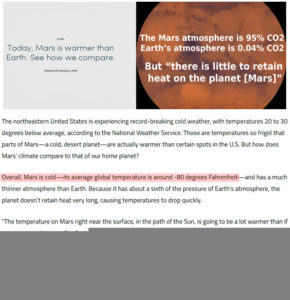
Scientists: Mars Has A 95% CO2 Atmosphere…But ‘There Is Little To Retain Heat On The Planet’

by K. Richard, December 2, 2019 in NoTricksZone


Earth’s atmosphere contains 400 ppm CO2 (0.04%). Mars has a 950,000 ppm (95%) CO2 atmosphere. But Mars has surface temperatures that are about -75°C colder on average than Earth’s because atmospheric density, or pressure, is the “game changer” largely determining planetary temperatures.

Surface temperatures on Mars

The average surface temperature of a planetary body is significantly determined by its distance from the Sun.

According to the NASA Jet Propulsion Laboratory, Mars is close enough to the Sun to have its surface temperatures reach 35°C (95°F) at the equator during summer.

During winter, however, the Martian temperature dips to -90°C (-130°F).

The average surface temperature for Mars is about -60°C (-80°F).

China plans new coal plants, trims support for clean energy

by The Japan Times, December 2, 2019


As world leaders gather in Spain to discuss how to slow the warming of the planet, a spotlight falls on China — the top emitter of greenhouse gases.

China burns about half the coal used globally each year. Between 2000 and 2018, its annual carbon emissions nearly tripled, and it now accounts for about 30 percent of the world’s total. Yet it’s also the leading market for solar panels, wind turbines and electric vehicles, and it manufactures about two-thirds of solar cells installed worldwide.

“We are witnessing many contradictions in China’s energy development,” said Kevin Tu, a Beijing-based fellow with the Center on Global Energy Policy at Columbia University. “It’s the largest coal market and the largest clean energy market in the world.”

That apparent paradox is possible because of the sheer scale of China’s energy demands.

But as China’s economy slows to the lowest level in a quarter century — around 6 percent growth, according to government statistics — policymakers are doubling down on support for coal and other heavy industries, the traditional backbones of China’s energy system and economy. At the same time, the country is reducing subsidies for renewable energy.

Climatologist On The State Of Climate Change Ahead Of COP25

by J. Curry, December 2, 2019 in ClimateChangeDispatch


The UN Climate Change Conference this week in Madrid provides an important opportunity to reflect on the state of the public debate surrounding climate change.

The UN Climate Conference (COP25) is beginning today in Madrid. I’ve been invited to write an op-ed for a newspaper in Madrid, which I assume will be published sometime this week (in Spanish). Below is the text of my op-ed.

JC op-ed

The UN Climate Change Conference this week in Madrid provides an important opportunity to reflect on the state of the public debate surrounding climate change.

Most of the world’s governments are prioritizing energy security, affordability and industrial competitiveness over commitments made for the Paris climate agreement.

Continuer la lecture de Climatologist On The State Of Climate Change Ahead Of COP25

Three Graphs

by Kip Hansen, November 30, 2019 in WUWT


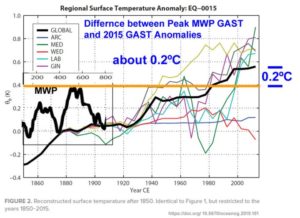
Now an annotated version of the second graph:

Here we have the second graph 1850-2015, with the global Average Surface Temperature anomaly (again — baseline 15 CE)  but I have dropped in a smaller window, on the left, bringing forward  the Roman Warm Period and the Medieval Warm Period (MWP) — the years 100-800 CE (same scale) — to illustrate the difference between the peak Global Average Surface Temperature (GAST)  of the Medieval Warm Period to the most current GAST on the graph (2015).

This exposes the ubiquitous trick of the Climate Debate, in which Global Temperatures are [almost] always shown only from the depths of the Little Ice Age (clearly marked on the first graph by Gebbie), resulting in images similar to Gebbie’s Figure 2 — despite the fact that most 2 millennia reconstructions clearly show the Roman and Medieval Warm Periods as generally in the same range as the Modern Warm Period.   Given the acknowledged range of error  in any temperature reconstruction and in modern estimates of global surface temperatures (today, in absolute temperatrures,  around +/- 0.5ºC  or a range of 1ºC)  — there may be little, if any,  significant-to-the-global-environment difference  between the two periods.

The Medieval Warm period did not result in a “Climate Catastrophe”  and the [iffy] little additional 0.2°C  seen today  is very unlikely to spark a modern Climate Catastrophe either.

SAN FRANCISCO TIES 1896 RECORD FOR COLDEST NOVEMBER DAY EVER!

by Cap Allon, November 30, 2019 in Electroverse


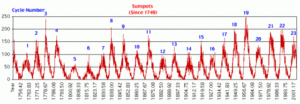
The mercury in San Francisco reached a high of just 8.8C (48F) on Thursday, November 28, tying the 1896 (solar minimum of cycle 12) record for the city’s lowest-max temp ever recorded in November.


And San Francisco wasn’t alone in dealing with below-average temperatures late last week. According to the National Weather Service, much of the interior North Bay suffered sub-zero readings overnight Thursday:

Novato Airport recorded a nipple-hardening -5C (23F).

Santa Rosa and Napa County Airport dipped to -3.3C (26F).

Sonoma Airport bottomed out at -2.8C (27F).

While temps touched freezing point at Livermore Airport.

2.8C (37F) at Oakland Airport and San Jose.

And 5C (41F) in San Francisco.

(Readings all highly unusual for the time of year).


New Paper Presents Photo Evidence Affirming Equatorial Region Sea Levels Have FALLEN Since The 1600s

by K. Richard, November 29, 2019 in NoTricksZone


In a new paper (Mörner, 2019, expanding upon Mörner, 2017), photo evidence confirms sea levels in 5 studied equatorial regions have fallen by about 60 cm since the 17th century…and remained stable since the 1970s.

Another new study (Haryono et al., 2019) of sea level change in equatorial Indonesia also supplies photos of marine terrace biomarker evidence affirming sea levels were about 5 meters higher than they are today between 5000 to 3000 years before present, suggesting “it means it was warmer than the present day” back then.

L’Optimum Climatique Médiéval : ce Grand Oublié !

by A. Préat, 29 novembre 2019 in ScienceClimatEnergie


1/ Introduction

Comme rappelé dans un précédent article (ici) les événements hyperthermiques sont fréquents tout au long de l’histoire de la Terre. Bien que fréquents et étudiés avec détail, force est de reconnaître que le ‘fin’ mot de leur origine n’est toujours pas connu, sauf à leur attribuer à tous un lien de parenté avec l’un ou l’autre des gaz dits à effet de serre, sans qu’une démonstration en bonne et due forme soit présentée. C’est ce que décortique l’article paru dans SCE (ici) pour un des événements hyperthermiques les plus intenses (événement PETM pour Paleocene-Eocene Thermal Maximum) s’étant déroulé au début de l’ère Cénozoïque il y a environ 56 millions d’années.

Rappelons la succession de ces événements au Cénozoïque, d’abord l’événement PETM, ensuite E-O (Eocene-Oligocene transition with climatic shift), MMCO (Mid-Miocene Climatic Optimum), MPTO (Mid-Pliocene Thermal Optimum) et depuis environ 10 000 ans l’Optimum Holocène. Ces événements montrent tous que la Terre a régulièrement connu de longues périodes chaudes avec des ‘températures moyennes globales’ plus élevées que l’actuelle (voir par exemple Cronin 2010, également mentionné sur de nombreux sites web). L’indicateur climatique communément utilisé , la température moyenne globale est loin d’être parfait (ici et ici). Il ne faut donc pas prendre au pied de la lettre cette notion de ‘température moyenne globale’ car déjà pour aujourd’hui elle est plus que discutable, et pour le passé elle est plus qu’inconnue. Mais il n’en reste pas moins vrai que lors des événements hyperthermiques ou des optima climatiques la température était plus élevée qu’actuellement, nous le savons grâce à de nombreux indicateurs ou ‘proxies’ (voir plus loin). Ces événements ne concernent pas uniquement le Cénozoïque (y compris l’Holocène) mais l’ensemble de l’échelle des temps géologiques au-delà du Cénozoïque, avec parfois des températures fort supérieures à celles du Cénozoïque, comme par exemple au Permien (ici).

2/ L’Optimum Climatique Médieval

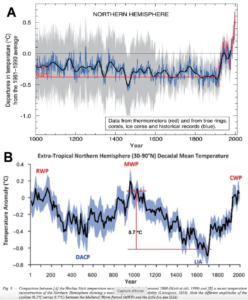
Revenons aux temps actuels, c’est-à-dire aux temps historiques. Plusieurs Optima Climatiques se succèdent depuis environ 6000 ans, avec pour la période la plus proche de nous, c’est-à-dire environ 3500 ans, la succession des Optima Climatiques Minoen, Romain, Médiéval et Actuel (Figure 1). Le plus récent est l’Optimum Climatique Médiéval (OCM) dont l’acmé se situe aux alentours de l’an mil. S’agissant de températures à peine plus élevées (1,5°C cfr ici et Le Roy Ladurie, 1967, également 1.0-1.4°C in Easterbrook, 2011), la délimitation précise de cet intervalle par rapport aux périodes encadrantes est difficile et l’OCM est finalement compris du 8ème au 13ème siècle (= le ‘petit optimum du Moyen Age’ d’environ 700 à 1350 sensu Le Roy Ladurie, 1967).

Figure 8 (cfr. Figure 5 in Préat, 2019). Capture d’écran de la Figure 8 de Scafetta (2019) : On the reliability of computer-based climate models. IJEGE, 19, 49-70. En comparant les deux courbes on peut se demander si l’on parle de la même chose! (RWP Roman Warm Period, DACP Dark Age Cold Period ou période froide post-romaine, MWP Medieval Warm Period, LIA Little Ice Age, CWP Current  Warm Period). Pour rappel la courbe A du haut, est la fameuse courbe en forme de hockey de Mann et al. 1998 du GIEC.

Why Apocalyptic Claims About Climate Change Are Wrong

by P. Homewood, November 29, 2019 in NotaLotoPeopleKnowThat


Journalists and activists alike have an obligation to describe environmental problems honestly and accurately, even if they fear doing so will reduce their news value or salience with the public. There is good evidence that the catastrophist framing of climate change is self-defeating because it alienates and polarizes many people. And exaggerating climate change risks distracting us from other important issues including ones we might have more near-term control over.

I feel the need to say this up-front because I want the issues I’m about to raise to be taken seriously and not dismissed by those who label as “climate deniers” or “climate delayers” anyone who pushes back against exaggeration.

With that out of the way, let’s look whether the science supports what’s being said.


See also: Michael Shellenberger: Apocalypse Cancelled?

UK ON COURSE FOR AN HISTORICALLY COLD NOVEMBER

by Cap Allon, November 19, 2019 in Electroverse


After decades of being lectured by the Met Office -among others– that global warming will bring an end to extreme-cold temperatures, the UK still somehow keeps-on clocking them — yet another example of how simple real-world observations can unravel the AGW-ruse.

Brits have been suffering-through an historically cold month, too — November’s average temperature has held well-below the norm for the first 17 days, continuing October’s dramatic cooling trend:

The Central England Temperature (CET) record measures the monthly mean surface air temperatures for the Midlands region of England, and is the longest series of monthly temperature observations in existence anywhere in the world.

Its mean reading for November 2019 (to the 17th) is sitting at 6.6C — that’s 0.7C below the already cool 1961-1990 average, the current standard period of reference for climatological data used by the WMO.

In the 360 years of CET data, there have only been 10 other years with an November average temperature of 6.6C — these are 1804, 1833, 1835, 1849, 1886, 1932, 1941, 1949, 1977, 1980.

Note also how the majority of these years fall in or around solar minimums of the past (1804, 1849, and 1980 being the only exceptions).