by S. Furfari and H. Masson, July 26, 2019 in ScienceClimateEnergie
Is it the increase of temperature during the period 1980-2000 that has triggered the strong interest for the climate change issue? But actually, about which temperatures are we talking, and how reliable are the corresponding data?
1/ Measurement errors
Temperatures have been recorded with thermometers for a maximum of about 250 years, and by electronic sensors or satellites, since a few decades. For older data, one relies on “proxies” (tree rings, stomata, or other geological evidence requiring time and amplitude calibration, historical chronicles, almanacs, etc.). Each method has some experimental error, 0.1°C for a thermometer, much more for proxies. Switching from one method to another (for example from thermometer to electronic sensor or from electronic sensor to satellite data) requires some calibration and adjustment of the data, not always perfectly documented in the records. Also, as shown further in this paper, the length of the measurement window is of paramount importance for drawing conclusions on a possible trend observed in climate data. Some compromise is required between the accuracy of the data and their representativity.
2/ Time averaging errors
If one considers only “reliable” measurements made using thermometers, one needs to define daily, weekly, monthly, annually averaged temperatures. But before using electronic sensors, allowing quite continuous recording of the data, these measurements were made punctually, by hand, a few times a day. The daily averaging algorithm used changes from country to country and over time, in a way not perfectly documented in the data; which induces some errors (Limburg, 2014) . Also, the temperature follows seasonal cycles, linked to the solar activity and the local exposition to it (angle of incidence of the solar radiations) which means that when averaging monthly data, one compares temperatures (from the beginning and the end of the month) corresponding to different points on the seasonal cycle. Finally, as any experimental gardener knows, the cycles of the Moon have also some detectable effect on the temperature (a 14 days cycle is apparent in local temperature data, corresponding to the harmonic 2 of the Moon month, Frank, 2010); there are circa 13 moon cycle of 28 days in one solar year of 365 days, but the solar year is divided in 12 months, which induces some biases and fake trends (Masson, 2018).
3/ Spatial averaging
…
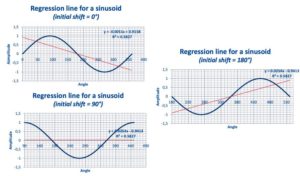
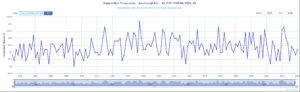
Figs. 12, 13 and 14 : Linear regression line over a single period of a sinusoid.
Conclusions
-
IPCC projections result from mathematical models which need to be calibrated by making use of data from the past. The accuracy of the calibration data is of paramount importance, as the climate system is highly non-linear, and this is also the case for the (Navier-Stokes) equations and (Runge-Kutta integration) algorithms used in the IPCC computer models. Consequently, the system and also the way IPCC represent it, are highly sensitive to tiny changes in the value of parameters or initial conditions (the calibration data in the present case), that must be known with high accuracy. This is not the case, putting serious doubt on whatever conclusion that could be drawn from model projections.
-
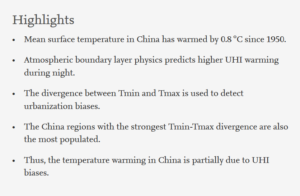
Most of the mainstream climate related data used by IPCC are indeed generated from meteo data collected at land meteo stations. This has two consequences:(i) The spatial coverage of the data is highly questionable, as the temperature over the oceans, representing 70% of the Earth surface, is mostly neglected or “guestimated” by interpolation;(ii) The number and location of theses land meteo stations has considerably changed over time, inducing biases and fake trends.
-
The key indicator used by IPCC is the global temperature anomaly, obtained by spatially averaging, as well as possible, local anomalies. Local anomalies are the comparison of present local temperature to the averaged local temperature calculated over a previous fixed reference period of 30 years, changing each 30 years (1930-1960, 1960-1990, etc.). The concept of local anomaly is highly questionable, due to the presence of poly-cyclic components in the temperature data, inducing considerable biases and false trends when the “measurement window” is shorter than at least 6 times the longest period detectable in the data; which is unfortunately the case with temperature data
-
Linear trend lines applied to (poly-)cyclic data of period similar to the length of the time window considered, open the door to any kind of fake conclusions, if not manipulations aimed to push one political agenda or another.
-
Consequently, it is highly recommended to abandon the concept of global temperature anomaly and to focus on unbiased local meteo data to detect an eventual change in the local climate, which is a physically meaningful concept, and which is after all what is really of importance for local people, agriculture, industry, services, business, health and welfare in general.


