by P. Gosselin, March 27, 2019 in NoTricksZone
Real vegetation development in southern Africa takes a very different course than claimed by climate models
By Die kalte Sonne
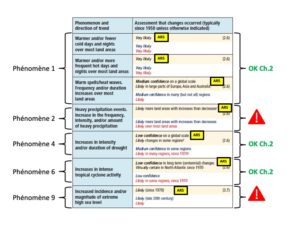
(German translated by P Gosselin)Climate models provide answers to all conceivable questions about the future. Political decision-makers are grateful for this information because they can make their plans accordingly.
But are the forecasts derived from models correct at all?
A research team led by Timm Hoffman has now compared the model projections with real vegetation development in southern Africa using historical photos. The sobering result: Nature has mostly developed quite differently than assumed by the models. In contrast to the model assumptions, no significant long-term trend in precipitation could be observed. Vegetation belts, which were supposed to shrink, ended up expanding. Confidence in the models is correspondingly low.
Political planning or even CO2 damage calculations based on the simulations are not possible. Here is the abstract of the work published in the journal Anthropocene in March 2019:
…
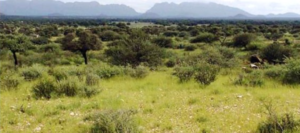
Southern Africa vegetation expanding, images show. Source: here.