Archives de catégorie : climate-debate

A Story of CO2 Data Manipulation

by Tim Ball in A. Watts, May 1, 2019 in WUWT


The consistent pattern of the IPCC reveals demonization and misrepresentations of CO2. Here are some basic facts about CO2 that illustrate the discrepancy between what the IPCC claim and what science knows.

  • Natural levels of Carbon dioxide (CO2) are less than 0.04% of the total atmosphere; it is far from being the most important or even only greenhouse gas as most of the public understands.

  • Water vapour which is 95 percent of the greenhouse gases by volume is by far the most abundant and important greenhouse gas.

  • The other natural greenhouse gas of relevance is methane (CH4), but it is only 0.000175 percent of atmospheric gases and 0,036 percent of all greenhouse gases.

  • In order to amplify the importance of CO2 they created a measure called “climate sensitivity”. This determines that CO2 is more “effective” as a greenhouse gas than water vapour

  • Here is a table from Wikipedia showing estimates of the effectiveness of the various GHGs. Notice the range of estimates, which effectively makes the measures meaningless, unless you have a political agenda. Wikipedia acknowledges “It is not possible to state that a certain gas    causes an exact percentage of the greenhouse effect.”


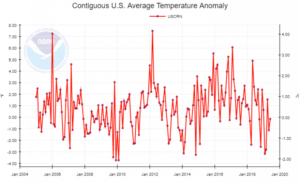
Analysis of new NASA AIRS study: 80% of U.S. Warming has been at Night

by Dr. Roy Spencer, April 30, 2019 in WUWT


I have previously addressed the NASA study that concluded the AIRS satellite temperatures “verified global warming trends“. The AIRS is an infrared temperature sounding instrument on the NASA Aqua satellite, providing data since late 2002 (over 16 years). All results in that study, and presented here, are based upon infrared measurements alone, with no microwave temperature sounder data being used in these products.

That reported study addressed only the surface “skin” temperature measurements, but the AIRS is also used to retrieve temperature profiles throughout the troposphere and stratosphere — that’s 99.9% of the total mass of the atmosphere.

Since AIRS data are also used to retrieve a 2 meter temperature (the traditional surface air temperature measurement height), I was curious why that wasn’t used instead of the surface skin temperature. Also, AIRS allows me to compare to our UAH tropospheric deep-layer temperature products.

So, I downloaded the entire archive of monthly average AIRS temperature retrievals on a 1 deg. lat/lon grid (85 GB of data). I’ve been analyzing those data over various regions (global, tropical, land, ocean). While there are a lot of interesting results I could show, today I’m going to focus just on the United States.

China Building 300 New Coal Power Plants Around The World

by P. Homewood, April 30, 2019 in NotaLotofPeopleKnowThat


China is building 300 new coal power stations around the world, according to NPR(National Public Radio), who I gather are the US equivalent of the BBC.

China, known as the world’s biggest polluter, has been taking dramatic steps to clean up and fight climate change.

So why is it also building hundreds of coal-fired power plants in other countries?

President Xi Jinping hosted the Belt and Road Forum in Beijing over the weekend, promoting his signature foreign policy of building massive infrastructure and trade links across several continents.

The forum, attended by leaders and delegates of nearly 40 countries, came amid growing criticism of China’s projects, including their effect on the environment.

Xi took the highly unusual step, for him, of meeting with international journalists, during which he repeated the slogan that he is committed to “open, clean and green development.”

The Three Sides Of Climate Science

by Hans Schreuder, April 29, 2019 in ClimateChangeDispatch


For the past 30 years, there has been an orchestrated alarm over how much a trace of a trace gas, human-produced carbon dioxide (CO2), impacts earth’s climate.

The idea was presented as the ‘settled science’ and that there exists a ‘greenhouse effect’ in Earth’s atmosphere and that CO2 ‘traps heat’ or ‘delays cooling’.

Besides the ‘official scientists’ who have convinced the world that there really is a problem, there are what I call the pseudo-skeptics, a large group that is more widely known as ‘Lukewarmists’.

They include many professors who don’t disagree that the trace gas CO2 must be causing ‘some’ warming but think it is so small it isn’t worth worrying about.

This group also fully backs the greenhouse gas theory and claims CO2 warming is logarithmic (i.e., determined on a sliding scale of positive water vapor feedback – see this post from WUWT with reader comments and the subsequent confusion).

Another climate lie bites the dust – No, Honolulu’s beaches aren’t going to disappear in 20 years

by Aylin Woodward, April 25, 201 in WUWT


In May 2017, high tides engulfed parts of the iconic Waikiki beach, edging dangerously close to waterfront hotels. This kind of high-tide flooding, often called a king tide or sunny-day flood, occurs when ocean water surges to higher levels than coastal infrastructure was designed to accommodate. In that case, water levels rose 2.5 feet above average in Waikiki, drowning nearby roads and sidewalks.

According to a 2017 report (which was updated in September 2018), Hawaii’s state capital and Waikiki Beach – along with other coastal strips on Hawaii’s five islands – are expected to experience frequent flooding within 15 to 20 years.

“This flooding will threaten $5 billion of taxable real estate; flood nearly 30 miles of roadway; and impact pedestrians, commercial and recreation activities, tourism, transportation, and infrastructure,” Shellie Habel, lead author of the 2017 study, said in a release.

Now, Hawaii state lawmakers are taking steps to shore up the state’s beaches and coastal cities. A new bill that mandates a statewide shore protection program has passed both houses of Hawaii’s state legislature, and will soon makes its way to the governor’s desk for approval.


All well and good that they want to improve beach resilience. But, the claim that ” Hawaii’s iconic Waikiki Beach could be engulfed by the ocean in 20 years ” is totally bogus.

Here is why:


Basic Science: 4 Keys to Melt Fears About Ice Sheets Melting

by William Ward, April 18, 2019 in WUWT


The world is drowning in articles about catastrophic sea level rise (SLR), reminding us that if the ice sheets melt, 260 feet of water will flood our coastal cities. We know that sea level today is 20-30 feet lower than it was at the end of the last interglacial period 120,000 years ago. We also know that sea level has risen 430 feet since the end of the last glacial maximum 22,000 years ago. Research shows this rise was not monotonic but oscillatory, and during periods over the past 10,000 years, sea level has been several meters higher than today. So, evidence supports the possibility of higher sea levels, but does the evidence support the possibility of catastrophic sea level rise from rapidly melting ice?

In this paper, basic science is used to show that catastrophic SLR from melting ice cannot happen naturally over a short period. Additionally, humankind does not possess the capability to melt a large amount of ice quickly even through our most advanced technology. This news should relieve the public, which is routinely deceived by reporting that misrepresents the facts. The public is susceptible to unnecessary alarmism when melt rates and ice-melt masses are presented without perspective and juxtaposed against claims that scientists are worried. This paper uses the same facts but places them in perspective to show that catastrophic risks do not exist.

UAH, RSS, NOAA, UW: Which Satellite Dataset Should We Believe?

by Dr Roy Spencer, April 23, 2019 in GlobalWarming


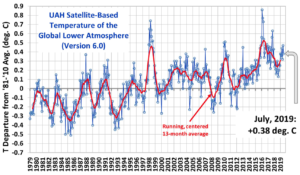
This post has two related parts. The first has to do with the recently published study of AIRS satellite-based surface skin temperature trends. The second is our response to a rather nasty Twitter comment maligning our UAH global temperature dataset that was a response to that study.

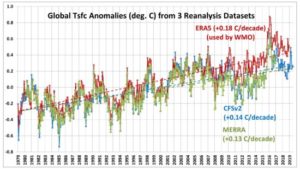
Furthermore, that period (January 2003 through December 2017) shows significant warming even in our UAH lower tropospheric temperature (LT) data, with a trend 0.01 warmer than the “gold standard” HadCRUT4 surface temperature dataset (all deg. C/decade):

AIRS: +0.24
GISTEMP: +0.22
ECMWF: +0.20
Cowtan & Way: +0.19
UAH LT: +0.18
HadCRUT4: +0.17

I’m pretty sure the Susskind et al. paper was meant to prop up Gavin Schmidt’s GISTEMP dataset, which generally shows greater warming trends than the HadCRUT4 dataset that the IPCC tends to favor more. It remains to be seen whether the AIRS skin temperature dataset, with its “clear sky bias”, will be accepted as a way to monitor global temperature trends into the future.

What Satellite Dataset Should We Believe?

Greenland Temperature Data For 2018

by P. Homewood, April 24, 2019 in NotaLotOfPeopleKnowThat


The DMI has just published its Greenland Climate Data Collection for last year, and it is worth looking at the temperature data:

There are six stations with long records, Upernavik, Nuuk, Ilulissat, Qaqortoq, Narsarsuaq and Tasilaq.

Throughout Greenland we find that temperatures in the last two decades are little different to the 1920s to 60s.

The only exceptions were 2010 on the west coast sites, which was an unusually warm year, and 2016 on the east coast at Tasilaq, another warm year there.

Noticeably, last year was actually colder than the 1981-2010 average at all of the west and south coast stations.


Climate4you_Update-March 2019

by Climate4you, April 2019


All diagrams in this report, along with any supplementary information, including links to data sources and previous issues of this newsletter, are freely available for download on www.climate4you.com

Yours sincerely,
Ole Humlum (Ole.Humlum@gmail.com)
Arctic Historical Evaluation and Research Organisation, Longyearbyen, Svalbard April 19, 2019.

.pdf

The big Arctic Sea-Ice shift of 2007: Ice refuses to melt

by Javier, April 23, 2019 in WUWT


I have maintained since 2015 that in the 2006-2007 season the Arctic underwent a cyclical phase shift, and the rapid sea-ice melting observed over the previous decades ended. A few scientists predicted or explained this shift based on their study of multi-decadal oscillations (see bibliography). They were ignored by mainstream climatology and the press because the “anthropogenic” melting of the Arctic is one of the main selling points of the climate scare. See for example:

Year after year the data supports my view over the desperate scaremongers like Tamino. With the passing of time it is more and more difficult to defend the idea that Arctic melting is continuing, so alarmists keep changing the metric. First it was September sea-ice extent (SIE), then September sea-ice volume, and now annual average SIE. However, the reference measurements are September minimum SIE and March maximum SIE.

This article is more than a biannual update on the Arctic ice situation, as I will focus specifically on showing evidence for the trend change that took place in 2007. As 12 years have passed since the shift, the best way is to compare the 2007-2019 period with the previous 1994-2006 period of equal length to display the striking differences between both periods.

Figure 1. Changes in September SIE for both periods as a percentage change over the first year of the period.

Solar variability manifestations in weather and climate characteristics

by Zherebtsov G.A. et al., April 2019 in J.Atm&SolarTerrestrialPhysics


Abstract

We discuss the issues of primary importance to understand the nature of climate changes in the 20th century and main physical processes responsible for these changes and present a physical model for the solar activity (SA) effect on climate characteristics. A key concept of this model is the heliogeophysical disturbance effect on the Earth climate system parameters driving the long-wave radiation flux moving away from the Earth out into space in high-latitude regions. We address the solar activity effect on the changes in the temperature of the atmosphere and of the World Ocean. The aa–index of the geomagnetic activity (GA) was used as an SA proxy index. We discuss the results of analyzing the regularities and peculiarities of the tropospheric and sea surface temperature (SST) responses to both separate heliogeophysical disturbances and long-term changes in solar and geomagnetic activity. The structure of the tropospheric and SST temperature responses was shown to feature a spatial time irregularity. We revealed the regions, where long-term SST changes are determined mainly by SA variations.

HAPPY EARTH DAY! WHEN WE CELEBRATE EVERY FAILED ALARMIST ECO-PREDICTION

by Nicolas Loris, April 22, 2019 in GWPF/BangorDailyNews


We should be thankful that the gloom-and-doom predictions made throughout the past several decades haven’t come true. Fear-mongering about explosive population growth, food crises and the imminent depletion of natural resources have been a staple of Earth Day events since 1970. And the common thread among them is that they’ve stirred up a lot more emotions than facts.

“By the year 2000, if present trends continue, we will be using up crude oil at such a rate … that there won’t be any more crude oil,” ecologist Kenneth Watt warned around the time of the first Earth Day event. “You’ll drive up to the pump and say, ‘Fill ’er up, buddy,’ and he’ll say, ‘I am very sorry, there isn’t any.’” Watt also warned of global cooling and nitrogen buildup rendering all of the planet’s land unusable.

Arctic Ice Gain Embarrasses Global Warming Scientists. 40-Year Meteorologist: “Don’t Be Surprised Over What Happens Next 10 -15 Years!

by P. Gosselin, April 21, 2019 in NoTricksZone


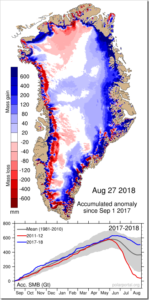
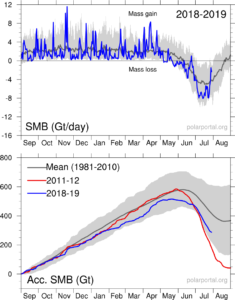
Yesterday I wrote here how some scientists misrepresent the observed data concerning Greenland ice melt in order to get the alarming results they want. There we see that Greenland has been melting, but recently much more slowly than what we are often led to believe.

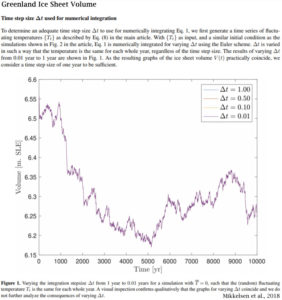
Looking at the latest Greenland ice volume data from the Danish Meteorological Institute (DMI), we see that currently the ice volume is below normal, but well within the range of the past 17 years:

Data source: Danish Meteorological Institute. Chart by Kirye.

Also Tony Heller at Real Science here plotted Arctic ice volume for the past 12 years in succession. Here’s how all the media-claimed rapid Arctic melting really looks

Isle de Jean Charles & Sea Level Rise

by P. Homewood, April 20, 2019 in NotaLotOfPeopleKKnowThat


The Isle de Jean Charles, Louisiana. It’s been largely submerged beneath the sea over the last 6 decades. The program gives the definite impression that the main reason for this inundation is sea level rise due to melting ice and thermal expansion of the oceans – driven by man-made climate change. Attenborough does mention oil extraction as a cause but his narrative is lost to the general tone of the messaging that this is a “climate catastrophe” and that the families driven from their homes in this part of Louisiana are some of the world’s first “climate refugees”. This is palpable bullshit.


https://tidesandcurrents.noaa.gov/sltrends/sltrends.html

An End… and a New Direction

by Tim Ball, April 20, 2019 in WUWT


I thought about making this my last article on climate for this or any other website except my own. I planned the action some time ago, but it was the recent headline in the Telegraph that triggered this penultimate move. It said, “Climate change is a risk investors can’t ignore: Black Rock latest to sound the alarm on environment.”

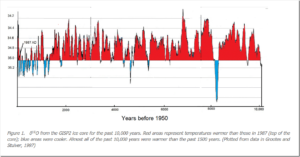
Climate change is not a risk factor. Current climate and climate changes are normal and well within the pattern of change over history, certainly the last 10,000 years. The world believes otherwise, despite efforts by me and others to make the correct information available.

This means that after 50 years (1968-2019) of trying to educate the public about the weather, global warming, and climate change I achieved little or no change in understanding, attitude, or most importantly, policy on the world stage. My attempts to counter the massive deception that began as human-caused global warming (AGW) and later shifted to human-caused climate change, fell short. The deception is now what people accept, although they don’t necessarily believe. Because of that it is now the underlying reason for all policy on energy and environment that are the mainstay of these business-world views, indeed all views.

Native American Wisdom on Polar bears and Kappiananngittuq:

by Jim Steele, April 19, 2019 in WUWT


In 2010 Nunavut’s Minister of Environment Daniel Shewchuk wrote, “Inuit hunters have a close relationship with the land and wildlife. They have observed that the overall population of polar bears in Nunavut is not declining as some suggest, but rather is thriving. No known environmental or other factors are currently posing a significant or immediate threat to polar bears overall. Furthermore, Inuit knowledge and science corroborate that the species can and will adapt to changing and severe climatic conditions, as it has done for centuries.”

The Inuit truly practice the concept of “it takes a village”. Hunters sit down in kappiananngittuq and respectfully share their observations of wildlife and their movements. Kappiananngittuq is the Inuit word for a “safe place to discuss”. Based on community discussions, Inuit have steadfastly claimed it is “The Time of the Most Polar Bears”. Overhunting has been one of the world’s greatest threats to wildlife. And the growing number of polar bears is testimony to wise hunting regulations now honored by the Inuit.

CLIMATE CHANGE AND THE TEN WARNING SIGNS FOR CULTS

by GWPF, April 18, 2019


Have you thought to yourself that the Climate Change movement seems more and more like a religious movement?


I have, so I researched how to identify a religious cult. Rick Ross, an expert on cults and intervention specialist,developed a list of ten warning signs for unsafe groups, which is published by the Cult Education Institute. So let’s take a look at all ten signs and compare:

CO2’s Influence Was 0.006 W/m² Per Decade During The Last Deglaciation. And This Melted Ice Sheets How?

by K. Richard, April 18, 2019 in NoTricksZone


According to the calculations of Dr. James Hansen, the radiative influence derived from the increase in CO2 during the last deglaciation was so negligible that it equated to “a third of energy required to power a honey bee in flight” (Ellis and Palmer, 2016).


Image Source: Ellis and Palmer, 2016

Vilifying People Who Question Global Warming Is Anti-Science

by Todd Royal, April 17, 2019 in ClimateChangeDispatch


When pollsters realized that the public and elected officials weren’t buying global warming as a concept or policy, in a brilliant political move, they came up with the phrase “climate change.”

This helped sell the theory of man-made global warming. Weather is politicized, and computer models are only predictions that have been used as pawns in elections and justifying increased government budgets.

The global warming/climate change (GWCC) narrative has made Al Gore a rich man peddling unrealized fear.

In January 2012, sixteen eminent scientists published an article in the Wall Street Journal, titled, “No Need to Panic About Global Warming.” If mankind is causing global warming, then how do you explain this?

Today’s CO2 concentrations worldwide average about 380 parts per million. This level of CO2 concentration is trivial compared with the concentrations during earlier geologic periods.

For example, 460 million years ago, during the Ordovician Period, CO2 concentrations were 4,400 ppm, and temperatures then were about the same as they are today. With such high levels of CO2 the Earth should have been boiling.

It seems more reasonable to be agnostic based upon this fact:

Biofuels: a long-standing illusion

by Prof. S. Furfari, April 4, 2019 in EuropeanScientist


The idea of replacing petroleum products with alternative fuels produced from agriculture dates back to the 1973 and 1979 oil crises. But apart from the development of bioethanol from cane sugar in Brazil, the idea had not come to fruition because it was not economically viable. It was the frenzy for some kind of sustainable development in the mid-2000s, combined with a perfect storm of realities, that led to the emergence of a political interest in biofuels.

El Niño Conditions Persist in the Pacific Ocean

by A. Watts, April 16, 2019 in WUWT


An El Niño that began to form last fall has matured and is now fully entrenched across the Pacific Ocean. Changes in sea surface temperatures (SSTs) brought about by an El Niño affect the atmosphere, resulting in distinctive changes in the rainfall pattern across the Pacific Basin. These changes show up as anomalies or deviations in NASA’s analysis of climatological rainfall.

As with a traditional El Niño, the effects from a Central Pacific El Niño can still spread to the U.S. Also, clearly visible in the NASA-generated monthly average rainfall was an area of heavy rain over the southeast coast of Africa associated with the passage of Cyclone Idai, which devastated the region with torrential flooding.

For more information about El Nino, visit: https://www.pmel.noaa.gov/elnino/definitions
Learn more about NASA’s Precipitation measurements: http://pmm.nasa.gov/trmm

40-Year Meteorologist Says Public “Being Fed Bill Of Goods” By Climate Alarmists On Hurricanes, Tornadoes

by P. Gosselin, April 14, 2019 in NoTricksZone


At the latest Saturday Summary at Weatherbell Analytics, Joe Bastardi, a well-known 40-year veteran of meteorology, looks at tornadoes and hurricanes.

Although many meteorologists and climatologists confirm that there is no data suggesting global warming is causing more frequent and intense tornado and hurricane activity, there is a small but influential alarmist group who claim otherwise. And it’s no surprise who the click-baiting media parrot at maximum volume.

Landfalling hurricanes downward trend

At the 5:45 mark, Joe presents a chart depicting the frequency of US landfalling hurricanes since 1900:


Week in review – science edition

by Judith Curry, April 14, 2019 in ClimateEtc.


A few things that caught my eye this past few weeks.

Why did the trend of loss accelerate after about 2000?” Meehl et al. (2018) offer an explanation.

Antarctica’s iceberg graveyard could reveal the ice sheet’s future. [link]

Latif: Decadal Atlantic Meridional Overturning Circulation slowing events in a climate model [link]

Koutsoyiannis: Extreme-oriented selection and fitting of probability distributions. [link]

Strengthened linkage between midlatitudes and Arctic in boreal winter [link]

Scientists discover evidence of long ocean memory [link]

Less ice in Arctic Ocean 6000-7000 years ago [link]

We now know how insects and bacteria control ice

by University of Utah, April 14, 2019 in WUWT


Proteins help organisms form or inhibit ice crystals

Contrary to what you may have been taught, water doesn’t always freeze to ice at 32 degrees F (zero degrees C). Knowing, or controlling, at what temperature water will freeze (starting with a process called nucleation) is critically important to answering questions such as whether or not there will be enough snow on the ski slopes or whether or not it will rain tomorrow.

Nature has come up with ways to control the formation of ice, though, and in a paper published today in the Journal of the American Chemical Society University of Utah professor Valeria Molinero and her colleagues show how key proteins produced in bacteria and insects can either promote or inhibit the formation of ice, based on their length and their ability to team up to form large ice-binding surfaces. The results have wide application, particularly in understanding precipitation in clouds.

“We’re now able to predict the temperature at which the bacterium is going to nucleate ice depending on how many ice-nucleating proteins it has,” Molinero says, “and we’re able to predict the temperature at which the antifreeze proteins, which are very small and typically don’t work at very low temperatures, can nucleate ice.”