There is frustration and reward when an article appears on the same topic of an article you are completing – in this case the Holocene. Such was the case this week with Andy May’s article “A Review of temperature reconstructions.” Andy points out the basic problems of reconstruction using proxy data for the most recent half of the Holocene – an issue central to historical climate and climate change studies. His paper did not alter my paper except as it reinforces some arguments.
This article examines the entire Holocene and illustrates the history that influenced the studies. There are two distinct parts to the studies, the pre and post Intergovernmental Panel on Climate Change (IPCC). The former is a genuine scientific struggle with issues of terminology and reconstruction, and the latter a scientific struggle to impose a political perspective regardless of the evidence. Because of the damage done to climatology by the proponents of anthropogenic global warming (AGW), both parts require explanation.
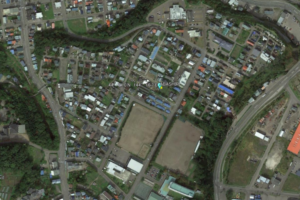
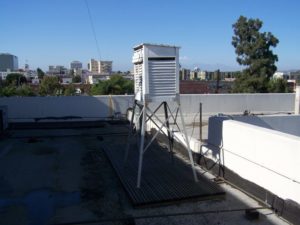
Aerial photos show that the 15 temperature observation stations the JMA is using to determine mean temperature anomalies are likely impacted far more by urbanization than the agency claims.
…
…
Abashiri is in the middle of buildings and streets.
It’s well known that climate models show increasing sensitivity over time: for a given forcing, the true long-term temperature increase (ECS) is higher than what you’d estimate if you simply extrapolated from the past (ECS_hist). In other words, the ECS-to-ECS_hist ratio is above 1. This article tries to work out why climate models behave like that; that is to say, the variable I’m trying to explain is the ECS-to-ECS_hist ratio.
Now, there’s probably too many hyphens and underscores in the text. So it will be more readable if I clarify that, every time I talk simply about ‘correlation’, I mean the correlation of thing X with the ECS-to-ECS_hist ratio. If other kind of correlation is mentioned, I’ll say so explicitly.
A conservative outlook on 21st century climate change
Summary: For the past decade anthropogenic emissions have slowed down, and continuation of current trends suggests a peak in emissions by 2050. Atmospheric CO2levels should reach 500 ppm but might stabilize soon afterwards, as sinks increase their CO2uptake. Solar activity is expected to continue increasing after the present minimum, as the millennial cycle works its way towards a late 21st century peak. The reduction in the rate of warming might continue until ~ 2035 followed by renewed warming, and temperature stabilization at about +1.5°C above pre-industrial. The pause in summer Arctic sea ice melting might also continue until ~ 2035. Renewed melting is probable afterwards, but it is unlikely that Arctic summers will become consistently ice free even by 2100.
by A. Bojanowski, August 4, 2018 in NoTricksZone/Der Spiegel
Geology major, science journalist Axel Bojanowski just penned a commentary at Spiegel Online on the recent hot weather hype we witnessed in the wake of Europe’s warm and unusually dry summer.
…
The title of his commentary: “Overheated – Forest Fires, Drought, Heat – Has The Climate Catastrophe Already Arrived? Time For A Cool Examination.”
The unusual timing of highly-productive summer plankton blooms off Greenland indicates a connection between increasing amounts of meltwater and nutrients in these coastal waters. Researchers now show that this connection exists, but is much more complex than widely supposed. Whether increasing meltwater has a positive or negative effect on summertime phytoplankton depends on the depth at which a glacier sits in the ocean.
…
“So, the study shows that further melting of Greenland’s glaciers only leads to stronger summer plankton blooms under very specific conditions, an effect that will ultimately end with very extensive further melting,” Hopwood summarizes the results of the study.
Wood density of European trees decreasing continuously since 1870
Trees are growing more rapidly due to climate change. This sounds like good news. After all, this means that trees are storing more carbon dioxide from the atmosphere in their wood and hence taking away the key ingredient in global warming. But is it that simple? A team analyzed wood samples from the oldest existing experimental areas spanning a period of 150 years — and reached a surprising conclusion.
…
But the most important finding for practical and political aspects is that the current climate-relevant carbon sequestration of the forests is being overestimated as long as it is calculated with established but outdated wood densities. “The accelerated growth is still resulting in surplus carbon sequestration,” says Pretzsch. “But scaling up for the forests of central Europe, the traditional estimate would be to high by about ten million metric tons of carbon per year.”
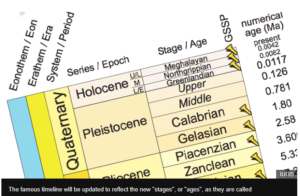
The global body tasked with naming geological eras, the International Commission on Stratigraphy, has rejected the proposed Anthropocene epoch, the controversial ‘geological’ epoch in which mankind allegedly dominates natural processes. The international commission has now rejected the proposal and has instead split the Holocene Epoch into three different geological ages, all of which were primarily shaped by natural, not human factors.
All around the world the climate druids are at work.
Show me the error bars
Once upon a time a scientist talked about thirty year trends and anachronistic things like “confidence intervals”. Now, thanks to the discovery of Unscience, any noisy, random short data is fair game to be declared undeniable climate change. Periods of flooding also qualify, as do periods of nice weather, though strangely no one mentions those. Where are the headlines? If climate change caused drought on the East Coast of Australia, it’s also causing average rain and good crops in Western Australia.
In terms of scientific data analysis we don’t get that many droughts or six-day-August-heatwaves to analyze. They’re complex phenomena caused by multiple factors and we only have short records. This makes them ideal to be oversold to hapless folk as a “sign” of climate change.
Somebody said economists try to predict the tide by measuring one wave. This puts them in the same league as climate scientists trying to predict the climate by measuring one variable, CO2. It is no surprise that an amalgam of the two, climate and economics, produces even worse results, but that is what happened early in the anthropogenic global warming (AGW) deception.
Paper Reviewed
Sun, X., Ren, G., Ren, Y., Fang, Y., Liu, Y., Xue, X. and Zhang, P. 2018. A remarkable climate warming hiatus over northeast China since 1998. Theoretical and Applied Climatology133: 579-594.
A prominent feature of all climate model projections is their prediction that temperatures should be rising in response to ever-increasing concentrations of greenhouse gases. However, for the past two decades global surface air temperatures have not warmed to the degree predicted by the models, which lack of warming has been a conundrum to the climate alarmist movement.
De tous temps les hommes se sont intéressés au climat et ont tenté de prévoir son évolution. Dès l’Antiquité il était connu que des caractéristiques géographiques comme la latitude mais aussi l’altitude ou le voisinage de vastes étendues d’eau avaient une grande influence sur le climat. Sur cette base les climatologues ont été amenés à distinguer différents types de climats tels que tropical, désertique, tempéré, polaire, etc. Ensuite, il est progressivement apparu que le climat est un système extrêmement complexe qui dépend de l’activité solaire ainsi que de la distance et de l’orientation de la Terre par rapport au Soleil, facteurs qui varient à des échelles de temps très différentes.
With wildfires engulfing over 620,000 acres of California, there’s been a concerted media campaign to single out man-made global warming as the primary force behind the deadly blazes.
But that’s not what the data suggests, according to University of Washington climate scientist Cliff Mass.
“So there is a lot of misinformation going around in the media, some environmental advocacy groups, and some politicians,” Mass wrote in the first of a series of blog posts analyzing the California wildfires.
by James E. Kamis, August 7, 2018 in ClimateChangeDisatch
In what amounts to dissension from National Aeronautics and Space Administration (NASA) climate change policy, a series of just-released studies by working-level scientists prove that geological and not atmospheric forces are responsible for melting of Earth’s polar ice sheets.
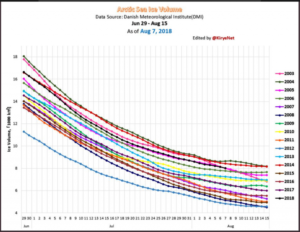
Using data from the Danish Meteorological Institute (DMI), Japanese skeptic blogger Kirye just tweeted how Arctic sea ice volume has surged to the 3rd highest level in 16 years.
…
Data source. Danish Meteorological Institute. Chart source: Kirye.
S’exprimer, sans recul, sur une canicule localisée à l’échelle du climat mondial constitue une erreur déontologique.
Il est regrettable que certains utilisent la vague de chaleur actuelle — qui au demeurant n’a rien d’anormal — afin de faire de nouveau miroiter la catastrophe climatique annoncée depuis 1992.
One of the main difficulties with tornado records is that a tornado, or evidence of a tornado must have been observed. Unlike rainfall or temperature, which may be measured by a fixed instrument, tornadoes are short-lived and very unpredictable. If a tornado occurs in a place with few or no people, it is not likely to be documented. Many significant tornadoes may not make it into the historical record since Tornado Alley was very sparsely populated during the 20th century.
Much early work on tornado climatology in the United States was done by John Park Finley in his book Tornadoes, published in 1887. While some of Finley’s safety guidelines have since been refuted as dangerous practices, the book remains a seminal work in tornado research. The University of Oklahoma created a PDF copy of the book and made it accessible at John Finley’s Tornadoes(link is external)
by P. Homewood, August 7, 2018 in NotaLotofPeopleKnowThat
Climate change: ‘Hothouse Earth’ risks even if CO2 emissions slashed
It may sound like the title of a low budget sci-fi movie, but for planetary scientists, “Hothouse Earth” is a deadly serious concept.
Researchers believe we could soon cross a threshold leading to boiling hot temperatures and towering seas in the centuries to come.
Even if countries succeed in meeting their CO2 targets, we could still lurch on to this “irreversible pathway”.
Their study shows it could happen if global temperatures rise by 2C.
…
The utterly corrupt body of climate science has been getting ever more desperate to scare people about climate change and thereby submit to their radical anti capitalist agenda.
People are not falling for it, so we are now being subjected to ever more absurd announcements like this.
During the 1930s, when the atmospheric CO2 concentration was about 100 ppm lower than today (310 ppm vs. 410 ppm), United States heat waves were just as if not more common than recent decades.
Recently there has been much ado about heat waves and the hottest-ever-recorded-temperatures making their rounds in Northern Hemisphere summer.
Yet scientists have determined that heat waves are largely driven by natural variability, not anthropogenic CO2 emissions.
But while Scripps is trying to tie the record-high ocean reading to the broader wave of media coverage on global heat waves, there are a few caveats to note about what the scientists found.
First, these measurements are taken from a pier that’s near the shoreline, which would not necessarily make it representative of the entire Pacific Ocean, and therefore easily influenced by local weather events.
The “anomalously warm temperatures for the past week” that Scripps researchers observed at their pier somewhat mirror the temperature pattern in 1931, and indeed, the daily records broken in the past week have been very close to readings from 87 years ago.
There is an upward trend in temperature readings from Scripps’ pier, but the trend seems to also broadly coincide with the flipping of a natural ocean cycle, the Pacific Decadal Oscillation, to its warm phase. That flip occurred around 1976.
Despite all the hysterical “heat wave” and drought reports being put out to the public by the media, the Northern Hemisphere as a whole is in fact not at all that much warmer than the mean since 2000.
According to Dr. Ryan Maue, northern hemisphere temperature anomaly was zero on July 30 and the northern hemisphere land surface anomaly was actually -0.20°C.
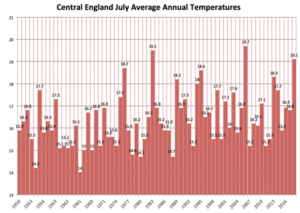
It has been for northern Europe a hot summer. Is it climate change as the media would like to have us believe? Or, is it something much simpler? For example, ocean patterns. Off the coast of Africa, water was coldest in the entire record back to 1950. A temperature change in one place of the oceans, means a change elsewhere also.
The UK July ranked 3rd warmest since 1950 in the very long term (starting 1659) temperature data-base from Central England.
…
La géologie, une science plus que passionnante … et diverse