Archives de catégorie : unclassified

EIA: U.S. CO2 Emissions Dropped 11% In 2020; No Change In Rising Atmospheric CO2

by A. Watts, Apr 16, 2021 in ClimateChangeDispatch


Climate change action proponents regularly tell us we have to reduce our carbon dioxide (CO2) emissions to prevent “climate change”, even to the point of curtailing industry, travel, and food consumption.

Fortunately, a real-world test of just those very things happened in 2020 due to the COVID-19 related lockdowns.

In a report released April 12th by the U.S. Energy Information Administration (EIA) the Monthly Energy Review, they report that energy-related CO2 emissions decreased by 11% in the United States in 2020 primarily because of the effects of the COVID-19 pandemic and related restrictions.

Furthermore, U.S. energy-related CO2 emissions fell in every end-use (consumer) sector for the first time since 2012. The EIA notes:

“CO2 emissions associated with energy use fell by 12% in the commercial sector in 2020. Part of this drop in emissions was due to pandemic restrictions.

“Because electricity is a large source of energy for the commercial sector, the declining carbon intensity of electric power also contributed to declining CO2 emissions from commercial activity. Emissions from commercial electricity use fell by 13%. Commercial petroleum and natural gas emissions fell by 13% and 11%, respectively.

“Within the U.S. power sector, emissions from coal declined the most, by almost a fifth, at 19%. Natural gas-related CO2 emissions rose by 3%. Also of note in 2020; fossil fuel generation declined, while power generation from renewables from wind and solar continued to grow.”

Climate Change, Energy and the Environment Lectures

by Popular Technology.net Aug 21, 2016


The following lectures from the Prager University Foundation cover climate change, energy and the environment. The Prager University Foundation, a 501(c)(3) non-profit organization has created an online resource of concise five minute lectures on environmental science topics presented by scientific experts and professionals. These offer fresh perspectives supported by fact based reasoning on contentious issues to anyone with an open mind.

A world of new perspectives, five minutes at a time.” – Prager University Foundation

See the videos

UNPRECEDENTED COLD INVADES EUROPE: “EYELID FREEZING NIGHT BREAKS RECORDS”

by Cap Allon, Apr 29, 2021 in Electroverse


This year’s punishing winter has shown few signs of abating, even as May fast-approaches.

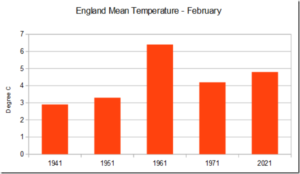
Across the European continent, the majority of nations are suffering their coldest April’s in decades–in around 100 years in Germany and the UK. This climatic reality (aka cooling) is in response to the historically low solar activity we’re been experiencing, as a decrease in output from the Sun weakens Earth’s jet streams and increases their tendency to flow in more of a weak and wavy manor — this “meridional” flow, as it’s known, increases the prevalence of Arctic outbreaks and “blocking” phenomenons.

The year 2021 is also further ‘uncorrelating’ the link between global temperatures and rising CO2 emissions. For decades, the agenda-driving doomsayers have decreed that our planet’s average temp will rise on an endless march upward unless crippling economic and social reforms were immediately implemented (recently renamed “the Great Reset”) — well, does this (chart linked below) look like catastrophic global warming to you?

REVEALED: Al Gore’s real climate catastrophe

by Ian Plimmer & John Ruddick, Apr 29, 2021 in SpectatorAustralia


Next month is the thirtieth anniversary of the most entertaining and damning chapter in Al Gore’s career.

By the mid-nineteenth century, our knowledge of atmospheric chemistry was sufficiently advanced for a few sharp minds to ponder whether an increase in carbon dioxide might increase global temperature.  The speculation remained entirely theoretical until 1957 when an international collaboration of top geophysicists — including the Soviets — used buoys, weather balloons and so forth to collect data.  The undertaking was led by Dr Roger Revelle then based at California’s Scripps Institute of Oceanography.  Today’s global warming debate is hyper-partisan but all agree Revelle’s standing is impeccable.

Before this research, many assumed the ocean was absorbing most of the increase in carbon dioxide caused by industrialisation.  Revelle’s data, however, indicated only half was. So what was happening to the other half?  Would the planet soon overheat?

Extremest Weather 2020

by Ralph Alexander, April 2021 in GWPF


Contents

About the author iii Executive summary v 1. Introduction 1 2. Natural disaster analysis 2 3. Heatwave 6 4. Cold extremes 12 5. Drought 14 6. Precipitation and floods 16 7. Hurricanes 19 8. Tornadoes 23 9. Wildfires 26 10. Conclusions 31 Notes 33 Review process 38 About the Global Warming Policy Foundation 38

About the author

Retired physicist Dr. Ralph B. Alexander is the author of Global Warming False Alarm and Science Un- der Attack: The Age of Unreason. With a PhD in physics from the University of Oxford, he is also the author of numerous scientific papers and reports on complex technical issues. His thesis research in the interdisciplinary area of ion-solid interactions reflected his interest in a wide range of scien- tific topics.

Dr Alexander has been a researcher at major laboratories in Europe and Australia, a professor at Wayne State University in Detroit, the co-founder of an entrepreneurial materials company, and a market analyst in environmentally friendly materials for a small consulting firm.

Sea Level and the Jersey Shore

by Kip  Hansen, March 22, 2021 in WUWT


Dr. Judith Curry has been writing about Sea Levels and New Jersey [and here], spurred on by a request for an evaluation of the topic from the New Jersey Business & Industry Association(NJBIA).  The NJBIA is concerned because a study by a team of sea level researchers at Rutgers University has called for “draconian policies unsupported by science” that would “harm our economy today” by overreacting to “legitimate concerns about climate change, sea level rise, and flooding”.   Dr. Curry’s full report is titled: “Assessment of projected sea level rise scenarios for the New Jersey Coast”.

Dr. Curry’s CFAN report contains this summary:

The summary conclusions of the CFAN Review are:

—  The sea level projections provided by the Rutgers Report are substantially higher than those provided by the IPCC, which is generally regarded as the authoritative source for policy making. The sea level rise projections provided in the Rutgers Report, if taken at face value, could lead to premature decisions related to coastal adaptation that are unnecessarily expensive and disruptive.

—  Scenarios out to 2050 for sea level rise and hurricane activity should account for scenarios of variability in multi-decadal ocean circulation patterns.

—  Best practices in adapting to sea level rise use a framework suitable for decision making under deep uncertainty. The general approach of Dynamic Adaptive Policy Pathways is recommended for sea level rise adaptation on the New Jersey coast.

I wrote a piece here at WUWT a year ago, titled “Atlantic City:   I’ll meet you tonite…..”, prompted by the Governor of New Jersey’s executive order stating that  “New Jersey has set a goal of producing 100 percent clean energy by 2050.” and  “New Jersey will become the first state to require that builders take into account the impact of climate change, including rising sea levels, in order to win government approval for projects.”  The sea level rise part of this executive order was based on an earlier draft of  the same  study by researchers at Rutgers University.

End of Snow? Finland Thinks Their Winter Snow Might Not Melt This Summer

by Eric Worall, March 22, 2021 in WUWT


Finland thinks that piles of snow accumulated from road clearing this year are so large, some of the snow will still be frozen when winter returns.

In Finnish capital region, snow piles built up this winter may not melt during summer

FINLAND  15 MARCH 2021

THE CAPITAL REGION of Finland has received so much snow this winter that the metres-high piles hauled to designated snow dump areas may not melt during the course of the summer, reports Helsingin Sanomat.

In Uusimaa, for example, the amount of snow was 1.7 times higher than last year in January, according to Foreca.

Helsingin Sanomat on Friday wrote that the piles of snow stand almost as high as 20 metres at the dump area in Herttoniemi, eastern Helsinki. In Maununneva, a north-western neighbourhood of the city, lorries have dumped roughly 16,000 loads of snow at the dump area, revealed Tero Koppinen, a production manager at Helsinki City Construction Services (Stara).

The snow ploughed from roads forms a large structure, nicknamed by the locals as the Alps, also at the only snow dump area in Espoo, in Vanttila.

Read more: https://www.helsinkitimes.fi/finland/finland-news/domestic/18867-snow-piles-built-up-this-winter-may-not-melt-during-summer-in-finnish-capital-region.html

The Fins mostly seem to be treating this as a joke, maybe a chance to cool off on warm Summer days. And most likely this event will have no long term consequences.

But history teaches that when ice ages strike, they can strike abruptly, with very little warning.

12,800 years ago, the world abruptly froze. Temperatures plunged back to ice age conditions, and stayed cold for over 1000 years.

Michael Mann “Hockey Stick” Update: Now Definitively Established To Be Fraud

by F. Menton, Aug 26, 2021 in ManhattanContrarian


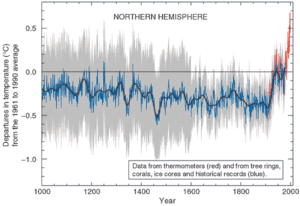
The Michael Mann “Hockey Stick” is suddenly back in the news. It’s been so long since we have heard from it, do you even remember what it is?

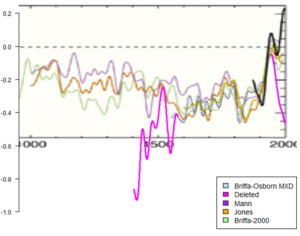
The “Hockey Stick” is the graph that took the world of climate science by storm back in 1998. That’s when Mann and co-authors Raymond Bradley and Malcolm Hughes published in Nature their seminal paper “Global-scale temperature patterns and climate forcing over the past six centuries.” A subsequent 1999 update by the same authors, also in Nature (“Northern Hemisphere Temperatures During the Past Millennium: Inferences, Uncertainties, and Limitations”) extended their reconstructions of “temperature patterns and climate forcing” back another 400 years to about the year 1000. The authors claimed (in the first paragraph of the 1998 article) to “take a new statistical approach to reconstructing global patterns of annual temperature . . . , based on the calibration of multiproxy data networks by the dominant patterns of temperature variability in the instrumental record.” The claimed “new statistical approach,” when applied to a group of temperature “proxies” that included tree ring samples and lake bed sediments, yielded a graph — quickly labeled the “Hockey Stick” — that was the perfect icon to sell global warming fear to the public. The graph showed world temperatures essentially flat or slightly declining for 900+ years (the shaft of the hockey stick), and then shooting up dramatically during the 20th century era of human carbon dioxide emissions (the blade of the stick).

UAH Global Temperature Update for February 2021: +0.20 deg. C

by Roy Spencer, March. 3rd, 2021 in Global Warming


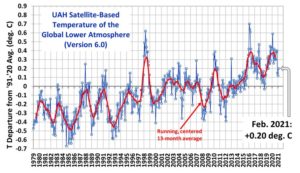
The Version 6.0 global average lower tropospheric temperature (LT) anomaly for February, 2021 was +0.20 deg. C, up from the January, 2021 value of +0.12 deg. C.

REMINDER: We have changed the 30-year averaging period from which we compute anomalies to 1991-2020, from the old period 1981-2010. This change does not affect the temperature trends.

The linear warming trend since January, 1979 remains at +0.14 C/decade (+0.12 C/decade over the global-averaged oceans, and +0.18 C/decade over global-averaged land).

Various regional LT departures from the 30-year (1991-2020) average for the last 14 months are:

CMIP6 and AR6, a preview

by Andy May, Feb 11, 2021 in WUWT


The new IPCC report, abbreviated “AR6,” is due to come out between April 2021 (the Physical Science Basis) and June of 2022 (the Synthesis Report). I’ve purchased some very strong hip waders to prepare for the events. For those who don’t already know, sturdy hip waders are required when wading into sewage. I’ve also taken a quick look at the CMIP6 model output that has been posted to the KNMI Climate Explorer to date. I thought I’d share some of what I found.

Delingpole: Study Disputes That Earth Is in a ‘Climate Emergency’

by P. Homewood, Feb 9, 2021 in NotaLotofPeopleKnowThat


There is no “climate emergency”, according to a study for the Global Warming Policy Foundation by independent scientist Dr Indur Goklany.

Goklany concludes:

While climate may have changed for the warmer:

• Most extreme weather phenomena have not become more extreme, more deadly, or more destructive

• Empirical evidence directly contradicts claims that increased carbon dioxide has reduced human wellbeing. In fact, human wellbeing has never been higher

• Whatever detrimental effects warming and higher carbon dioxide may have had on terrestrial species and ecosystems, they have been swamped by the contribution of fossil fuels to increased biological productivity. This has halted, and turned around, reductions in habitat loss

The report will make hugely depressing reading for all the prominent environmental activists — from the Pope and Doom Goblin Greta Thunberg to the Great Reset’s Klaus Schwab — who have been pushing the “climate emergency” narrative. It is an article of faith for the globalist elite and their useful idiots in the media, in politics, in business, and the entertainment that the world is on course for climate disaster which only radical and costly international action can prevent.

Continue reading “Delingpole: Study Disputes That Earth Is in a ‘Climate Emergency’”

Ocean forcing drives glacier retreat in Greenland

by M. Wood et al., Jan 01, 2021 in AAAS OPEN ACCESS


INTRODUCTION

The Greenland Ice Sheet has contributed substantially to sea-level rise over the past few decades. Since 1972, approximately two-thirds of the ice sheet’s contribution to sea-level rise resulted from increased glacier flux with the remaining one-third from anomalous surface melt (1). Before 2000, anomalous ice discharge was the dominant driver of mass loss, but in recent years, increasingly negative surface mass balance anomalies have contributed to a larger proportion of the total mass loss from the ice sheet (1). The acceleration in mass flux has been partially attributed to a warming of subsurface waters around Greenland near the end of the 1990s (2, 3) and increased runoff, resulting in enhanced water mixing and melt at glacier margins, destabilization of terminus regions (4, 5), ice front retreat (6, 7), and, in most cases, accelerated ice flow (8). The increase in flow speed, combined with enhanced surface melt, results in increased glacier thinning, which is conducive to further retreat (9). Other processes may have additionally contributed to the glacier retreat, e.g., increases in basal lubrication, melting of the ice mélange in front of glaciers, or weakening of glacier shear margins, but quantitative evidence about their impact has been limited (1012).

The warming of subsurface waters at the turn of the 21st century was caused by the spreading of ocean heat from the subpolar gyre during a transition in the North Atlantic Oscillation (NAO) from a high positive phase to a low-to-negative phase (3). In this shift, the North Atlantic subpolar gyre expanded, enhancing ocean heat fluxes through the coastal Irminger and West Greenland currents, yielding warmer subsurface waters on the continental shelf of all seven major basins of Greenland (Fig. 1). Since 2010, the NAO has transitioned back to a more positive phase, yielding a relative cooling of the ocean waters, however, not sufficiently to bring back ocean heat fluxes to the levels of the 1990s (13).

Study Shows Arctic Sea Ice Reached Lowest Point On Modern Record… In The 1940s, Not Today!

by C. Rotter, Jan 24, 2021 in WUWT


Regular NoTricksZone author Kenneth Richards notes on Twitter

Apparently Arctic sea ice volume was as low in the 1940s as it has been in the 2000s.

And the highest sea ice volume of the last 100 years was about 1979 – the year the Arctic sea ice record begins.


Guillian Van Achter1, Leandro Ponsoni1, François Massonnet1, Thierry Fichefet1, and Vincent Legat2

  • 1Georges Lemaitre Center for Earth and Climate Research, Earth and Life Institute, Université Catholique de Louvain, Louvain-la-Neuve, Belgium
  • 2Institute of Mechanics, Materials and Civil Engineering, Applied Mechanics and Mathematics, Université Catholique de Louvain, Louvain-la-Neuve, Belgium

Correspondence: Guillian Van Achter (guillian.vanachter@uclouvain.be) Received: 04 Dec 2019 – Discussion started: 10 Dec 2019 – Revised: 17 Jul 2020 – Accepted: 09 Sep 2020 – Published: 21 Oct 2020

Abstract

We use model simulations from the CESM1-CAM5-BGC-LE dataset to characterise the Arctic sea ice thickness internal variability both spatially and temporally. These properties, and their stationarity, are investigated in three different contexts: (1) constant pre-industrial, (2) historical and (3) projected conditions. Spatial modes of variability show highly stationary patterns regardless of the forcing and mean state. A temporal analysis reveals two peaks of significant variability, and despite a non-stationarity on short timescales, they remain more or less stable until the first half of the 21st century, where they start to change once summer ice-free events occur, after 2050.

How to cite. Van Achter, G., Ponsoni, L., Massonnet, F., Fichefet, T., and Legat, V.: Brief communication: Arctic sea ice thickness internal variability and its changes under historical and anthropogenic forcing, The Cryosphere, 14, 3479–3486, https://doi.org/10.5194/tc-14-3479-2020, 2020.1

The Natural Warming Of The Global Oceans-Bob Tisdale

by P. Homewood, Jan 18, 3021 in NotaLotofPeopleknowThat


https://youtu.be/lmjaNO5DD_Q

Many of you will be familiar with the work of Bob Tisdale over the years, concerning the mechanism of ENSO (ie El Ninos and La Ninas) and its effects on climate.

His seminal series of videos, recorded in 2012 is still on YouTube, and is still highly relevant.

Above is Part 1, which is worth sticking with all the way through, but otherwise the first 8 minutes is definitely worth a watch. Nothing has effectively changed since 2012, and Bob’s conclusions are still relevant and valid.

As well as explaining what exactly drives El Ninos and La Ninas, he makes some significant points:

  1. Worldwide sea surface temperature trends since 1980 show no correlation with GHGs (see chart below)

  2. Instead they exhibit a series of step changes up, which follow the major El Nino events of 1982/83, 1987/88 and 1997/98

  3. Contrary to popular belief, global SSTs do not drop during La Nina episodes. This is because El Ninos transfer a vast amount of warm, subsurface water to the surface, where it remains during La Nina.

  4. Some of this warm water in the East Pacific finds its way into the West Pacific and Indian Oceans. But through a process called teleconnection, SSTs is the Atlantic, where there is no direct connection, also rise and exhibit the same step changes.

  5. Between major El Nino events, SSTs outside the East Pacific do not rise.

  6. In the East Pacific, there has been no trend increase in SST at all since 1980.


    ….

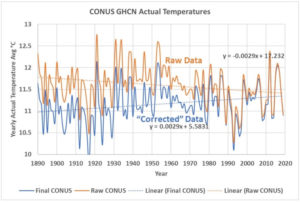
The U.S. National Temperature Index, is it based on data? Or corrections?

by Andy May, Nov 24, 2020 in WUWT


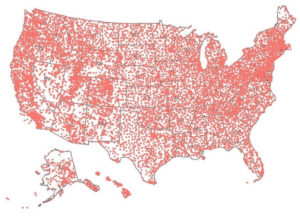
The United States has a very dense population of weather stations, data from them is collected and processed by NOAA/NCEI to compute the National Temperature Index. The index is an average temperature for the nation and used to show if the U.S. is warming. The data is stored by NOAA/NCEI in their GHCN or “Global Historical Climatology Network” database. GHCN-Daily contains the quality-controlled raw data, which is subsequently corrected and then used to populate GHCN-Monthly, a database of monthly averages, both raw and final. I downloaded version 4.0.1 of the GHCN-Monthly database on October 10, 2020. At that time, it had 27,519 stations globally and 12,514 (45%) of them were in the United States, including Alaska and Hawaii. Of the 12,514 U.S. stations, 11,969 of them are in “CONUS,” the conterminous lower 48 states. The current station coverage is shown in Figure 1.

Figure 1. The GHCN weather station coverage in the United States is very good, except for northern Alaska. There are two stations in the western Pacific that are not shown.

igure 4. The orange line is the uncorrected monthly mean temperature, which is “qcu” in NOAA terminology. The blue line is corrected, or NOAA’s “qcf.”

Browse: Home / 2020 / November / 20 / “Sinking” Maldives Clear Forests, Pave Beaches, To Construct Four New Airports For Future Tourism! “Sinking” Maldives Clear Forests, Pave Beaches, To Construct Four New Airports For Future Tourism!

by P. Gosselin, Nov 20, 2020 in NoTricksZone


Despite all the money-generating gloomy predictions of sinking islands, we reported in 2013 on how the Maldives was planning to build 30 new luxury hotels for future tourists.

The resort island of Landaa Giraavaru (Baa atoll), photo by: Frédéric DucarmeCC BY-SA 4.0.

Underwater in 7 years?

We recall how in 2012, the former President of the Maldives Islands, Mohamed, Nasheed said: “If carbon emissions continue at the rate they are climbing today, my country will be underwater in seven years.”

4 new airports!

Well, today the islands have not gone underwater and remains popular with tourists like never before. And to help with the job of ferrying the 1.7 million (2019) tourists to and from the resort islands, the Maldives have recently opened 4 new airports, according to German site Aero here!

The Guardian: Joe Biden’s $1.7 Trillion Investment Could Reduce Global Warming by 0.1C

by E. Worall, Nov 8, 2020 in WUWT


The Guardian has inadvertently revealed the utter futility of throwing trillions of dollars of borrowed government money into the bottomless renewable energy pit.


Hey I can play this game too – if I get $1700 of that cash, I promise to cut back on eating Chilli beef. Paying a billion people to eat less chilli beef would likely have a comparable impact on global warming to spending the money on renewables. The EPA estimates CH4 accounts for 10% of observed global warming. The study I linked estimates human activity like raising beef cattle and eating chilli beans is responsible for up to 40% of detected CH4 emissions.

Alternatively the cash could be used to give all the cattle in the world that special seaweed supplement the CSIRO discovered, which is supposed to cut back on intestinal methane production.

To put this level of expenditure into perspective, the cost of launching a 0.03C manned mission to Proxima Centauri using technology developed in the 1950s has been estimated at around $2 trillion. I’m not saying that building a starship is a reasonable use of $2 trillion of taxpayer’s money, but the first step in mankind’s expansion throughout the galaxy would surely be a lot more fun than spending all that money on reducing global temperature by an amount which cannot even be directly measured.

And of course, the obvious point – if it costs $1.7 trillion to reduce global warming by 0.1C, we now have a Guardian provided method of estimating the cost of eliminating our alleged impact on the global climate, reducing global warming by 1.0C: 1.7 x 1.0C / 0.1C = $17 trillion.

EU report about vanishing beaches was alarmist and wrong, scientists say

by Ben Webster, Oct 27  in TheTimes


Sandy beaches are much less vulnerable to rising seas than was claimed in a recent European Commission study which caused “unnecessary alarm”, research has found.

Beaches will survive by migrating landwards as the sea level rises as long as they are given space to move and not impeded by sea walls and other structures on the coast, the research

The new findings contradict claims made in March in a study by the commission’s joint research centre, which supplies scientific evidence to guide EU policy.


See also:  Satellite Data: 75% Of The World’s Beaches Are Stable Or Growing

Analysis of satellite derived shoreline data indicates that 24% of the world’s sandy beaches are eroding at rates exceeding 0.5 m/yr, while 28% are accreting and 48% are stable.


De Telegraaf Misled By UN Disaster Report Researcher

by P. Homewood, Oct 20, 2020 in NotaLotofPeopleKnowThat


You will all recall the latest UN report, which claimed there had been a massive rise in “reported disasters” in the last two decades, compared to the previous two.

The Dutch newspaper, De Telegraaf, published an article in response complaining that the UN were not comparing like with like, because many smaller disasters were simply never recorded in the past. They also published this reply from Joris van Loenhout, researcher at the Belgian Centre  for  Research on the Epidemiology of Disasters  (CRED):

“From about 1960-1970 onward, the completeness of the data is much greater, and the share of missing disasters much smaller. We are constantly working to improve completeness, and this is also happening for previous years and decades. For this reason, statements made in 2004 and 2006 are now somewhat outdated, as the completeness of the database has since improved,”

 I have now had time to analyse CRED’s database, EM-DAT, and have the figures to show that Loenhout has not been telling the truth.


In their 2004 report, “Thirty Years of Natural Disasters”, CRED included this table of the number of natural disasters:

Claim: The deep sea is slowly warming

by American Geophysical Union, Oct 13, 2020 in WUWT


WASHINGTON–New research reveals temperatures in the deep sea fluctuate more than scientists previously thought and a warming trend is now detectable at the bottom of the ocean.

In a new study in AGU’s journal Geophysical Research Letters, researchers analyzed a decade of hourly temperature recordings from moorings anchored at four depths in the Atlantic Ocean’s Argentine Basin off the coast of Uruguay. The depths represent a range around the average ocean depth of 3,682 meters (12,080 feet), with the shallowest at 1,360 meters (4,460 feet) and the deepest at 4,757 meters (15,600 feet).

They found all sites exhibited a warming trend of 0.02 to 0.04 degrees Celsius per decade between 2009 and 2019 – a significant warming trend in the deep sea where temperature fluctuations are typically measured in thousandths of a degree. According to the study authors, this increase is consistent with warming trends in the shallow ocean associated with anthropogenic climate change, but more research is needed to understand what is driving rising temperatures in the deep ocean.

“In years past, everybody used to assume the deep ocean was quiescent. There was no motion. There were no changes,” said Chris Meinen, an oceanographer at the NOAA Atlantic Oceanographic and Meteorological Laboratory and lead author of the new study. “But each time we go look we find that the ocean is more complex than we thought.”The challenge of measuring the deep

Researchers today are monitoring the top 2,000 meters (6,560 feet) of the ocean more closely than ever before, in large part due to an international program called the Global Ocean Observing System. Devices called Argo floats that sink and rise in the upper ocean, bobbing along in ocean currents, provide a rich trove of continuous data on temperature and salinity.

ARGENTINA HOLDS 8C TO 16C BELOW AVERAGE AS 2 FEET OF SNOW BURIES USHUAIA PROVINCE

by Cap Allon, Oct 4, 2020 in Electroverse


The out-of-season cold and snow currently blasting BOTH HEMISPHERES is intensifying: North America, western/northern Europe, central/eastern Asia, and practically ALL of Australia have now been joined by Argentina.

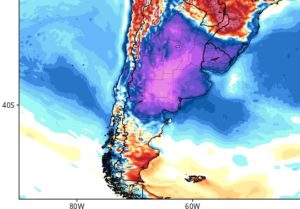
The South American nation of Argentina measures 2,175 miles long and lies between 21°S and 55°S. Despite its impressive latitude spanning length, the country has been completely engulfed by a powerful Antarctic blast.

Looking at the latest GFS run (shown below), Argentina is set to suffer temperature departures as much as 16C below the seasonal average on Sunday, Oct 4:

FIRE

by J. Curry, Sep 15, 2020 in WUWT


Subtitle: our failure to live in harmony with nature.

I’m taking a breather today from nonstop hurricane stuff. Well, ‘breather’ may not be quite the right word.

As I’m writing this, I’m looking out into the smoke from the California fires that are blowing into Reno (not to mention much of the rest of the U.S.).  Schools in Reno are supposed to be open (they have a good COVID protocol), but have been closed more than half the time for the past month owing to bad air quality from the fires.

The mantra from global warming activists that manmade global warming is causing the fires, and therefore fossil fuels must be eliminated,  is rather tiresome, not to mention misses the most important factors.  More importantly, even if global warming is having some fractional impact on the wildfires, reducing fossil fuels would fractionally impact the fires but only a time scale of many decades hence.

No Fuel, No Fire

by Mike Jonas, August 25, 2020 in WUWT


With wildfires devastating California, it may be worth while seeing if lessons can be learned from Australia. Connections between American and Australian firefighters go back many years, with each helping the other from time to time. There were devastating bushfires in Australia last summer, and, tragically, three Americans who had come to help were killed when their water tanker plane crashed. It’s now Australia’s turn to help California, and let us all hope there is a better outcome.

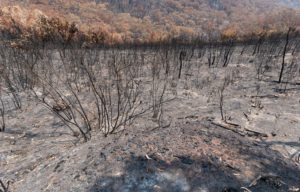
Gum trees burnt in the bushfires in The Blue Mountains in Australia

Submissions to Enquiries

Australia’s federal enquiry into the bushfires is not due to report until 28 October 2020 but the NSW [New South Wales] state enquiry report was published today. There were nearly 2,000 public submissions. Before I go into the report’s recommendations, it may be worth looking at a couple of the public submissions in order to understand the extreme level of public frustration with green tape and the way that the fire hazard has been allowed to grow ever larger over the years.