Archives de catégorie : unclassified

David Attenborough gets a namesake: the oldest known relative of living animals

by T. Joose,  July 25, 2022, in Science


If you visited the oceans more than 500 million years ago, you’d find yourself in an alien world. Beings with quilted folds of soft tissue sat on the seabed like rugs, and life forms that looked like fronded plants but were actually animals made anchor on the ocean floor. But one organism might be somewhat familiar: a stalked, cuplike creature with waving tentacles resembling those of a jellyfish. The newly described fossil of this organism, named Auroralumina attenboroughiiafter naturalist and broadcaster David Attenborough, is between 556 million and 562 million years old and may be the oldest example of an evolutionary group still living today.

When co-author and University of Oxford paleobiologist Frances Dunn saw a cast of the fossil, she says, “It was instantly clear that this was really special and really rare.” With other fossils from the Ediacaran period, between 635 million and 541 million years ago, her first impression often is “What is this? How can I relate this to anything that’s alive today?” But with this specimen, she thought, “I know what this is.”

Classical scientific wisdom places the origin of modern animals about 539 million years ago during what’s called the Cambrian explosion. At this time, creatures with specialized tissues, organs, guts, and symmetrical left and right sides—all traits we recognize in the animals of today—began popping up.

The heatwave green hysteria is out of control

by P. Homewood, July 18, 2022 in NotaLotofPdeopleKnowThat


If you find yourself wondering over the next few days why it is so swelteringly hot, I have an answer for you. It’s because of rich people. It’s because of those wealthy elites with all their gas-guzzling vehicles and reckless holidaymaking. It’s their fault you’re sweating on the Tube.
This infantile claim really is being made, and by supposedly serious politicians. Labour’s Richard Burgon, over on his Instagram account, is wringing his no doubt sweaty hands over the filthy rich folk who apparently landed us in this weather apocalypse.
‘As we face 40C temperatures and the first ever Red Extreme Heat Warning, remember this climate crisis is driven by the wealthy’, he cries. His stern words are accompanied, naturally, by that Met Office map showing half of Britain coloured dark red – the hellish hue that has been chosen to illustrate how dire our predicament has allegedly become.
Is anyone else tiring of all this green hysteria over the heatwave? There is something medieval about it. There is something creepily pre-modern in the idea that sinful mankind has brought heat and fire and floods upon himself with his wicked, hubristic behaviour. What next – plagues of locusts as a punishment for our failure to recycle?

Updated Atmospheric CO2 Concentration Forecast Through 2050 and Beyond

by R. Spencer, July 18, 2022 in WUWT


Summary

The simple CO2 budget model I introduced in 2019 is updated with the latest Mauna Loa measurements of atmospheric CO2 and with new Energy Information Administration estimates of global CO2 emissions through 2050. The model suggests that atmospheric CO2 will barely double pre-industrial levels by 2100, with a total radiative forcing of the climate system well below the most extreme scenario (RCP8.5) used in alarmist literature (and the U.S. national climate assessment), with the closest match to RCP4.5. The model also clearly show the CO2 reducing effect of the Mt. Pinatubo eruption of 1991.

Europe at risk of civil unrest unless it returns to fossil fuels, EU warns

by Climate Depot, July 11, 2022


1) Europe at risk of civil unrest unless it returns to fossil fuels, EU warns
The Guardian 8 July 20222) Rising social unrest over energy costs & food shortages threatens global stability
David Blackmon, Forbes, 11 July 2022

3) Farmers ‘freedom convoy’ takes aim at strict Dutch Net Zero regulations

The Daily Telegraph, 9 July 20224) Dutch farmer protests against emissions cuts spread across EU
Farmers Weekly, 9 July 2022

5) Green Tories fear next party leader could ditch Net Zero strategy

The Observer, 10 July 20226) Andrew Orlowski: Boris Johnson, the Net Zero zealot

7) Lifeline for millions in Red Wall as fracking return could provide ‘cheap or free gas’
Daily Express, 8 July 20228) Europe’s rush to buy Africa’s natural gas draws cries of hypocrisy
Bloomberg, 10 July 2022

9) ‘Complete Collapse’: How ESG and green extremism destroyed Sri Lanka’s economy
The Daily Caller, 6 July 2022

10) If you want to know how Sri Lanka’s president destroyed his country read his COP26 speech
High Commission of the Democratic Socialist Republic of Sri Lanka in the United Kingdom, 1 November 2021

Europe is in danger of highly damaging “very, very strong conflict and strife” this winter over high energy prices, and should make a short-term return to fossil fuels to head off the threat of civil unrest, the vice-president of the European Commission has warned.

Frans Timmermans, the second most senior official in the EU, said the threat of unrest this winter, a deliberate outcome of Vladimir Putin’s invasion of Ukraine, must take precedence over the climate crisis.

He said: “If our society descends into very, very strong conflict and strife because there is no energy, we’re certainly not going to make our [climate] goals. We’re certainly not going to get where we need to get if the lack of energy leads to strong disruption in our societies, and we need to make sure people are not in the cold in the coming winter.

“We need to make sure we keep our industry, as much as possible, functioning because the one thing that could help Putin is divisions in our society.”

People suffering from the cold this winter because they cannot afford heating would also be disastrous for solving the climate crisis, Timmermans argued in an interview with the Guardian in Brussels.

“I’ve been in politics long enough, over 30 years, to understand that people worry most about the immediate crisis and not about the long-term crisis And if we don’t address the immediate crisis, we will certainly be off-track with the long-term crisis,” he said.

Inconvenient truth for globalists: Arctic ice at 30-year high

by A. Moore, May 25, 2022 in Wind


The World Economic Forum and the globalist movement it helps lead have used the “climate crisis” and the COVID-19 pandemic as pretexts for measures to redistribute the wealth of nations.

But this week, as WEF convenes is annual conference in Davos, Switzerland, the Arctic sea ice expanse so far this month is at a 30-year high, according to data from intergovernmental European Organization for the Exploitation of Meteorological Satellites, points out climate-change skeptic Tony Heller.

EUMETSAT, as the organization is known,  was created through an international convention signed by 30 European nations.

The extent of Arctic ice during the warmer months long has been a metric for climate-change alarmists. In 2007, Al Gore began warning the world that scientists were predicting that by 2013, the Arctic would be ice-free during the summer.

Understanding Abrupt Climate Change in the Late Quaternary

by R.S. Bradley & H.F. Diaz, Nov18,  2021 in Eos


Between about 75,000 and 10,000 years ago, there was a series of sudden and dramatic changes in rainfall patterns in tropical regions likely triggered by changes in ocean water circulation. A recent article in Reviews of Geophysics examines the evidence of these “Tropical Hydroclimatic Events” and explores the potential causes. Here, one of the authors explains more about these abrupt climate change events of the past and suggests how it can inform our understanding of potential future climate change.

What are “Tropical Hydroclimatic Events” (THEs)? When and where did they occur?

When we look back at past climate variations in continental regions of the Tropics and sub-Tropics (~30ºN-30ºS), it is abundantly clear that there were times when climate abruptly changed, causing some areas that were formerly wet to become quite dry, and areas that were formerly dry to become much wetter, disrupting plant and animal communities, as well as people living in the region. We call those changes “Tropical Hydroclimatic Events (THEs).” The changes affected vast areas (and lasted for centuries in some cases_ before the climate shifted back to the former conditions. There were at least half a dozen of these THEs between about 10,000 and 75,000 years ago.

NEW STUDY: “Part Of North Atlantic Is Cooling”…”Natural Fluctuations Have Been Primary Reason”

by P. Gosselin, Apr 30, 2022 in NoTricksZone


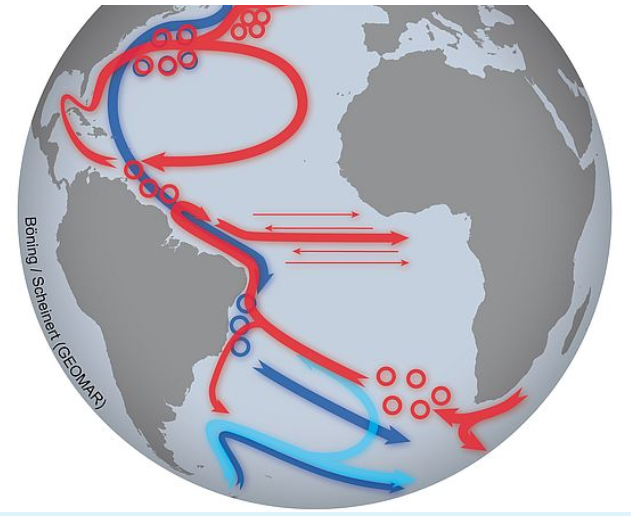
New studies on the Atlantic current system assess the threshold between natural fluctuations and a climate change-driven evolution

25 April, 2022/Kiel, Germany. With a new publication in the scientific journal Nature Climate Change, researchers from Kiel once again contribute to the understanding of changes in the Atlantic Meridional Overturning Circulation (AMOC) – also known as the “Gulf Stream System”. It is important both for the global climate as well as for climate events in Europe. The authors focus on the question whether human-induced climate change is already slowing down this oceanic circulation. According to the new study, natural variations are still dominant. Improved observation systems could help detect human influences on the current system at an early stage.

Is the Atlantic Meridional Overturning Circulation (AMOC) slowing down? Is this system of ocean currents, which is so important for our climate, likely to come to a halt in the future? Are the observed variations a natural phenomenon or are they already caused by human-induced climate change? Researchers from various scientific disciplines use a wide range of methods to better understand the gigantic oceanic circulation.

“The AMOC provides Europe with a mild climate and determines seasonal rainfall patterns in many countries around the Atlantic. If it weakens over the long term, this will also affect our weather and climate. Other consequences could be a faster rise in sea levels at some coasts or a reduction in the ocean’s ability to take up carbon dioxide and mitigate climate change”, Professor Dr. Mojib Latif, Head of the Research Unit: Marine Meteorology at GEOMAR Helmholtz Centre for Ocean Research Kiel, explains. “We depend on the AMOC in many ways – but so far, we can only guess how it will develop, and whether and how strongly we humans ourselves will push it towards a tipping point where an unstoppable collapse will take its course.”

Using observational data, statistical analyses and model calculations, a team led by Professor Latif has therefore examined changes in the current system over the past one hundred years in greater detail. The results have now been published in the scientific journal Nature Climate Change. According to the researchers, part of the North Atlantic is cooling – a striking contrast to the majority of ocean regions. All evaluations indicate that since the beginning of the 20th century, natural fluctuations have been the primary reason for this cooling. Nonetheless, the studies indicate that the AMOC has started to slow down in recent decades.

Tokyo Sees Coldest February In 34 Years…Mean February Temperature Trend Has Not Risen Since 1987!

by P. Gosselin, Mar 4, 2022 in NoTricksZone


The February and winter 2021/22, untampered JMA mean temperature data are in for Tokyo and its Hachijojima island

Tokyo

Here’s the latest plot of February mean temperatures for Tokyo, since 1987

Over the past 34 years, February mean temperatures in Tokyo have been steady, i.e. no warming. After the past 2 Februarys came in rather balmy, this most recent February has been the coldest since 1988!

Hachijojima

Moving away from the urban Tokyo and over to the city’s rural Pacific island of Hachijojima, some 275 km off the Japan mainland, we plot the latest February data going back to 1987


Here as well there’s been no warming in February since 1987. In contradiction to the predictions of warming, the island has in fact cooled off bit, according to the data from the Japan Meteorological Agency (JMA).

The past February has been among the coolest since 1987.


Ireland, Sweden Show No January Warming Since 1988. Antarctic Sea Ice Extent Now More Than 40 Years Stable!

by P. Gosselin, Feb 15, 2022 in NoTricksZone


The January mean temperature data from the Japan Meteorological Agency (JMA )are now available for Sweden and Ireland. Also below we look at Antarctic sea ice extent.

We begin by looking at the trends from 5 stations in Sweden, for which the JMA has enough data to allow adequate plotting. since 1988:

Evidence that Clouds Actively Regulate the Temperature

by W. Eschenbach, Oct 6, 2013 in WUWT


I have put forth the idea for some time now that one of the main climate thermoregulatory mechanisms is a temperature-controlled sharp increase in albedo in the tropical regions. I have explained that this occurs in a stepwise fashion when cumulus clouds first emerge, and that the albedo is further increased when some of the cumulus clouds evolve into thunderstorms.

I’ve demonstrated this with actual observations in a couple of ways. I first showed it by means of average photographs of the “view from the sun” here. I’ve also shown this occurring on a daily basis in the TAO data. So I thought, I should look in the CERES data for evidence of this putative phenomenon that I claim occurs, whereby the albedo is actively controlling the thermal input to the climate system.

Mostly, this thermoregulation appears to be happening over the ocean. And I generally dislike averages, I avoid them when I can.  So … I had the idea of making a scatterplot of the total amount of reflected solar energy, versus the sea surface temperature, on a gridcell-by-gridcell basis. No averaging required. I thought well, if I’m correct, I should see the increased reflection of solar energy required by my hypothesis in the scatterplots. Figure 1 shows those results for four individual months in one meteorological year. (The year-to-year variations are surprisingly small, so these months are quite representative.)

Solar Update

by D. Archibald, Feb 2, 2022 in WentwothReport


Reports from the current Northern Hemisphere winter include plenty of low temperature records broken, frozen seas off Greece, etc., suggesting that the world is cooling. A correspondent in Missouri writes:

Nearly 800 chill hours here so far … cold forecast for the next 2 weeks. Will hit 1000 easily. The average when we moved here not quite 20 years ago was 5-600 … for the entire winter. (Chill hours refer to the total amount of time a fruit tree needs to be exposed to cold winter temperatures to allow them break dormancy so they will flower and set fruit normally.)

So that is good news for Missouri — they will now be able to grow things like peaches with a high chill hour requirement for fruiting. Confirmation of colder Northern Hemisphere winters is provided by the snow mass trend by the Finnish Meteorlogical Institute:

World Atmospheric CO2, Its 14C Specific Activity, Non-fossil Component, Anthropogenic Fossil Component, and Emissions (1750–2018

by Kenneth et al. 2022, Feb 2022 in HealthPhysics


Abstract

After 1750 and the onset of the industrial revolution, the anthropogenic fossil component and the non-fossil component in the total atmospheric CO2 concentration, C(t), began to increase. Despite the lack of knowledge of these two components, claims that all or most of the increase in C(t)since 1800 has been due to the anthropogenic fossil component have continued since they began in 1960 with “Keeling Curve: Increase in CO2from burning fossil fuel.” Data and plots of annual anthropogenic fossil CO2 emissions and concentrations, C(t), published by the Energy Information Administration, are expanded in this paper. Additions include annual mean values in 1750 through 2018 of the 14C specific activity, concentrations of the two components, and their changes from values in 1750. The specific activity of 14C in the atmosphere gets reduced by a dilution effect when fossil CO2, which is devoid of 14C, enters the atmosphere. We have used the results of this effect to quantify the two components. All results covering the period from 1750 through 2018 are listed in a table and plotted in figures. These results negate claims that the increase in C(t) since 1800 has been dominated by the increase of the anthropogenic fossil component. We determined that in 2018, atmospheric anthropogenic fossil CO2 represented 23% of the total emissions since 1750 with the remaining 77% in the exchange reservoirs. Our results show that the percentage of the total CO2 due to the use of fossil fuels from 1750 to 2018 increased from 0% in 1750 to 12% in 2018, much too low to be the cause of global warming.

COP 26: Planet saved, now what?

by D. Wojick, Nov 11, 2021 in CFact


A hugely funny thing happened on the outskirts of COP 26. The press seems to have missed this huge news, but the Paris Accord’s goal of keeping global warming below 2 degrees has now been met. Well okay, it has just been promised by politicians. But if you take political promises seriously, as they do in COP-world, the end is here.

Specifically, several independent green analyses find that the various commitments made at COP 26 would limit global warming to just 1.8 or so degrees. The Paris target is “less than 2 degrees” so there you have it. Target met!

Where are the green headlines screaming “Planet saved”? Where are the green marches of celebration instead of protest?

The funny part is that this paper success raises big problems for the climate activist movement. All that remains is to makes sure the promises are kept. But these promises are for dates that range from from 2030 to way out in 2060 or 2070. There is almost nothing to do now as far as implementation is concerned. What are all these activists to do?

There are some technical things that need doing, at some point. In particular these big promises are not part of the actual COP. The COP is the Conference of the Parties to the UN Framework Convention on Climate Change, which includes over 200 countries, each of which has a veto.

None of these grand promises, even those made by over 100 countries like the methane reduction goal for 2030, are part of the official COP. In fact the thousands of national COP negotiators are reportedly “sour” because the grand announcements got all the press.

The actions of the COP are highly formal. What has to happen now is that all of these promises get incorporated into the official Nationally Determined Contribution (NDC) for each country that is a member of the Paris Accord. Even here the next round of updated NDCs is not due until 2025. So in a very real sense there is nothing urgent to do now, even though the Planet is saved (on paper).

Some of the global activists might simply reject the finding that the Paris target has been reached. This may be tough because one of these Earth saving analyses was done by the prestigious (to alarmists) International Energy Agency. IEA got a low 1.8 degrees of warming if all the agreements and public promises are met by every country.

Die hard alarmists might argue that the target is 1.5 degrees, not 1.8. But China has said officially that 1.5 is not the Paris Accord target and if people want it the entire Accord will have to be renegotiated.

There are some relatively immediate issues on the COP table that relate to these promises. One is finally establishing the global emissions trading system. Many of the “rich” country NDCs depend on trading in order to get to so-called net zero emissions. They need to buy indulgences for their air transport and shipping, which cannot be electrified.

Then there is the huge unresolved issue called finance. Many of the developing country NDCs are contingent on the rich countries paying the huge cost of getting to net zero, or even for hitting lesser targets like the 30% methane cut by 2030. The supposedly agreed on funding of $100 billion a year from 2020 through 2024 has yet to appear. Developing countries, led by an alliance of African leaders, is calling for a trillion a year beginning 2025, but that target too is a long way off.

Where does the climate alarmist movement go from here? Greta Thunberg in her new newly profane persona has asked of COP 26 “What the F are they doing in there.” The COPers can now answer “Saving the planet, what are you doing out there.”

Of course it is all just political promises. Many are economically impossible, some physically so. At this point that is not the point. The alarmist movement has the serious problem of apparent success. How they handle it will be fun to watch.

Another Round Of Anti-Science From The IPCC (With A NEW Hockey Stick!)

by F. Menton, Aug 16, 2021 in ClimateChangeDispatch


What with the ongoing catastrophe in Afghanistan and the earthquake in Haiti, among other news, you may have failed to notice that the UN IPCC came out on Monday with substantial parts of its long-awaited Sixth Assessment Report on the state of the world’s climate.

This is the first such assessment issued by the IPCC since 2014. The most important piece is the so-called “Summary for Policymakers,” (SPM), a 41-page section that is the only part that anyone ever reads.

The IPCC attempts to cloak itself in the mantle of “science,” but its real mission is to attempt to scare the bejeezus out of everyone to get the world to cede more power to the UN.

Beginning with its Third Assessment Report in 2001, the lead technician for the IPCC to generate fear has been the iconic “hockey stick” graph, supposedly showing that world temperatures have suddenly shot up dramatically in the last 100 or so years, purportedly due to human influences.

The 2001 Third Assessment Report thus prominently featured the famous Hockey Stick graph, derived from the work of Michael Mann and other authors. Here is that graph from the 2001 Report:


McIntyre comments:

They took “hide the decline” to extremes that had never been contemplated by prior practitioners of this dark art. Rather than hiding the decline in the final product, they did so for individual trees: as explained in the underlying article, they excluded the “divergent portions” of individual trees that had the temerity to have decreasing growth in recent years. Even Briffa would never have contemplated such woke radical measures.

Decide on your desired conclusion and then just exclude any data that refuses to go along. This is the “science” on which our world leaders are off spending multiple trillions of taxpayer dollars.

Le Nouveau Testament du GIEC est enfin disponible !

by ScienceClimatEnergie, 10 août 2021


En ce lundi 9 août 2021, le dernier rapport du groupe I du GIEC, l’AR6, est enfin disponible sur le site internet de l’organisation internationale (ici). Il s’intitule : « Climate Change 2021: the Physical Science Basis » et est, bien entendu, hyper alarmiste, du moins dans son résumé pour décideurs (SPM). Ne manquez pas de lire la présentation de ce nouveau rapport par le GIEC lui-même.

L’arrivée de ce nouveau bébé a été célébrée en grande pompe par tous les médias, comme par exemple le site alarmiste RTL-info, qui a réussi à publier 8 articles différents sur le sujet en une seule journée[1]. Ces articles comprennent bien entendu une interview de J.P. Van Yperseleet de Greta Thunberg. L’alarmisme climatique ferait-il grimper les recettes publicitaires?

Ce nouveau rapport AR6 sera bien entendu analysé en détail par l’équipe SCE et nous ne manquerons pas de vous faire part de nos observations. Nous vous proposons déjà deux remarques importantes.

Remarque 1.

Le nouveau rapport du GIEC (AR6) fait 3949 pages (et la majorité des figures ne sont pas encore disponibles). Si vous lisez 10 à 11 pages par jour vous mettrez exactement un an pour le finir. Il faut bien entendu avoir une certaine base scientifique et savoir lire l’anglais sinon vous aurez beaucoup de mal à comprendre quoi que ce soit… Qui va donc lire ce rapport dans son entièreté? Très peu de monde, et certainement pas les décideurs qui n’ont généralement pas le temps. Un résumé de 41 pages (le SPM) leur est donc destiné. Toutes les nuances et les incertitudes du rapport de 3949 pages seront donc gommées dans le résumé de 41 pages, comme nous vous l’avions démontré pour l’AR5 (ici).


Continuer la lecture de Le Nouveau Testament du GIEC est enfin disponible !

IPCC AR6 Focusses On “Absurd”, “Fairy Tale” Scenarios, Ignores Hundreds Of Publications, Major Factors

by F. Vahrenholt, Aug 11, 2021 in NoTricksZone


Now we look at the new IPCC report.

The new IPCC report: climate change 2021 – widespread, rapid, worsening climate change

The new IPCC 6th Assessment Report published on Monday, August 9th, makes a clear statement in the title of its “Summary for Policymakers”: Climate change is continuing to spread rapidly at an accelerated pace.

What are the main changes compared to the 5th Assessment Report of 2013?

1. Global warming from 1850 to the present is reported to have been 1.07 °C. The warming from 2011 to 2020 increased by 0.19°C since the last reporting period from 2003 to 2012.

2. There are new models (CMIP6), but some of them produced completely implausible results (Science, Paul Voosen: U.N. Climate Panel confronts implausibly hot forecasts of future warming). Since CO2’s influence was assumed to be too strong, the backward modelling of the temperature development of the last millennia of some models led to unrealistically cold temperatures. Looking into the future, many models ran too hot. Even Gavin Schmidt of the NASA GISS Institute, who is close to the IPCC, stated: “insanely scary – and wrong”.

As a result, the models relied on by the IPCC were constrained. Nevertheless, the holy grail of climate research, the climate sensitivity ECS (temperature increase with doubling of CO2) was raised. Until now, the IPCC calculated a temperature increase range of 1.5° to 4.5° Celsius with a doubling of the CO2 concentration from 280 ppm (1850) to 560 ppm in the future. Against the background of the new models, the IPCC now gives a temperature range of 2° to 5°C, with a narrower confidence interval of 2.5°C to 4°C. They even venture so far as to assign a mean value for climate sensitivity of 3°C for a doubling of CO2.

Entire Holocene warmth gets airbrushed

3. Surprisingly, the IPCC has deleted the Medieval Warm Period (MWP) from 900 to 1200 from the climate report and thus from humanity’s climate memory. The first graph in the report, SPM.1, shows the temperature curve for the last 2000 years. From year 1 onwards, the curve shows a steadily decreasing trend until 1850, after which the temperature rises sharply until today. A new hockey stick has been created. So the IPCC can claim that it has never been as warm as it is today for 125,000 years.

Numerous scientific publications (I was involved in five of them) document that the Medieval Warm Period was about as warm as today (as described in the 5th State of the Climate Report).

But now even the period of 6500 to 8500 years ago is also rewritten as cold. That was the time when hippos roamed the Sahara and shortly afterwards, Ötzi wandered over the Ötztal Alps. Dozens of publications had proven that the temperatures at that time were 3 degrees higher than today. All no longer true. (see “Unwanted truths”, p.34 to p.54). In the last IPCC report of 2013 it was still stated: “On a continental scale, temperature reconstructions of the medieval climate anomaly (years 950 to 1250 show with high confidence intervals of decades that were as warm in some regions as in the late 20th century.

Global Warming Stalls Again – Back To Levels Seen 20 Years Ago

by P. Gosselin & Kirye, July 6, 2021 in ClimateChangeDispatch


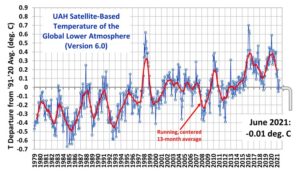
Before we begin, Dr. Roy Spencer just published that Version 6 of the University of Alabama-Huntsville satellite-based global average lower tropospheric temperature (LT) anomaly for June 2021 was -0.01 deg. C, down from the May 2021 value of +0.08 deg. C.

As Dr. Spencer’s chart above shows, temperatures are back within the range seen 20 years ago. The hiatus in global temperature rise appears to have resumed.

June cooling in Tokyo


Source: JMA

Read more at No Tricks Zone

Unusually strong cold weather outbreak spreads from Antarctica into central South America, bringing early winter temperature records and first snowfall after decades

by A. Flis, July 4, 2021 in SevereWeatherEurope


Winter in the Southern Hemisphere has brought an unusual cold weather outbreak from Antarctica into South America. Low-temperature records were broken, with snowfall returning to parts of south Brazil after decades.

The source of the cold air was Antarctica, which is quite colder than normal this season. As you will also see, the Southern Hemisphere is also colder than normal, bringing down the 2021 global temperatures to the lowest in the past 6 years. All that, while record heatwaves are raging across the United States and Canada.

Greenland Ice Core CO2 during the past 1,000 years


by R. Hannon, July 2, 2021 in WUWT


Introduction
This post compares CO2 ice core measurements from Greenland to those from Antarctica over the last millennium. Paleoclimate studies typically use only Antarctic ice cores to evaluate past CO2 fluctuations. This is because the entire Greenland CO2 datasets were deemed unreliable due to chemical reactions with impurities in the ice and therefore have not been used in studies since the late 1990’s. This post will demonstrate that CO2 data from Greenland ice cores have scientific value and respond to key paleoclimate events such as the Little Ice Age and Medieval Warm Period.

Antarctic Ice Core CO2 Trends
Antarctic ice CO2 data is readily available and has been studied extensively (Bauska, 2015, Ahn, 2012, Siegenthaler, 2005 and Rubino, 2019). Most of the focus of recent studies has been on high snow accumulation sites which tend to have higher resolution and less smoothing of the trapped gas age in ice bubbles due to the firn to ice transition. Gas age width and resolution ranges from 10 years in Law Dome ice cores to 65 years in Dronning Maud Land DML. Figure 1 shows CO2 data from Antarctic high-resolution ice cores over the past millennium.

Ahn et al, 2012, compiled CO2 records from the West Antarctic Ice Sheet (WAIS) and compared them to other key datasets such as Dronning Maud Land (DML), and Law Dome. Their study recognizes and discusses elevated CO2 during the Medieval Warm Period (MWP) at 1000 AD, decrease of CO2 around 1600 AD during the Little Ice Age (LIA) and the subsequent rapid increase beginning around 1850 AD.

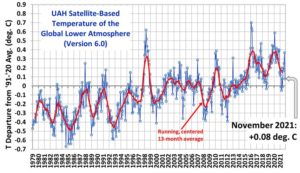
UAH Global Temperature Update for May 2021: +0.08 deg. C

by R. Spencer, June 1st, 2021 in GlobalWarming


The Version 6.0 global average lower tropospheric temperature (LT) anomaly for May, 2021 was +0.08 deg. C, up from the April, 2021 value of -0.05 deg. C.

REMINDER: We have changed the 30-year averaging period from which we compute anomalies to 1991-2020, from the old period 1981-2010. This change does not affect the temperature trends.

The linear warming trend since January, 1979 remains at +0.14 C/decade (+0.12 C/decade over the global-averaged oceans, and +0.18 C/decade over global-averaged land).

Wandering polar bears are the new starving polar bears, falsely blamed on climate change

by Polar Bear Science, May 15 , 2021


Back in 2017, we famously had National Geographic falsely blaming a starving polar bear on climate change but since then we have been inundated (relatively speaking) with stories of ‘wandering’ bears sighted far from Arctic coastlines. These wandering bears are oddities to be sure but are not in any way an indicator of melting Arctic sea ice or lost habitat, as The Times (UK) has claimed in this latest example (Polar bear treks 1,500 miles south as Arctic hunting zone melts away).

Greta Hasn’t Seen April Warming In Her Life. Global Surface Temperatures Plummet 0.75°C Since 2016

by P. Gosselin, May 14, 2021 in NoTricksZone


The April, 2021, mean temperature data collected by the Japan Meteorological Agency (JMA) has been tabulated and are ready to be added to our monthly plots.

Today we look at the April mean temperature trends for stations which the JMA has sufficient data and which are located in northern countries. Global warming is thought to be first visible at the far northern and Arctic regions.