Archives par mot-clé : Arctic

ASTONISHING, RECORD-BREAKING GAINS CONTINUE ACROSS THE GREENLAND ICE SHEET — MSM SILENT

by Cap Allon, June 11, 2020 in Electroverse


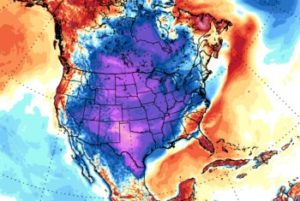
The month of June is breaking records across the Greenland ice sheet, and not records for warmth and melt –as the mainstream media have trained you to expect– but new benchmarks for COLD and GAINS.

The SMB gains occurring right now across Greenland are truly astonishing.

Data-driven FACTS reveal vast regions to the south have been GAINING RECORD/NEAR-RECORD LEVELS of snow & ice all month.

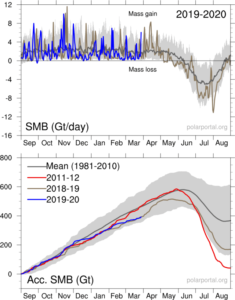
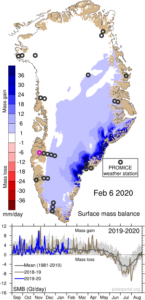
Never before in June has the Greenland ice sheet grown by more than 4 Gigatons in a single day (since 1981 when DMI records began), but now the past week has gone and delivered two such days — June 3, and now yesterday, June 10.

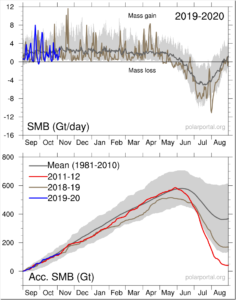
In fact, yesterday’s gains actually neared 5 Gts — you can see from the chart below how anomalous that gain is for the time of year:


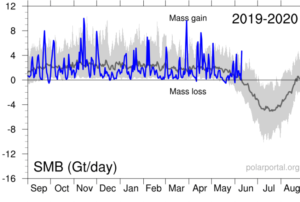
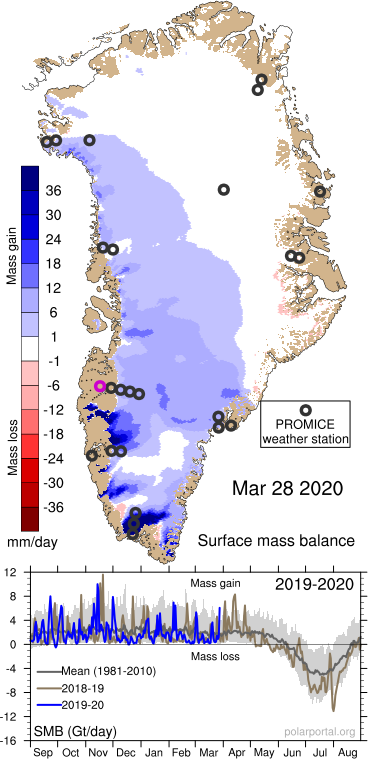
Blue line (Gt/day): total daily contribution to the SMB from the entire ice sheet. Grey line: mean value from 1981-2010 (DMI).

New Study: Arctic Waters Were 4°C Warmer Than Today And Nearly Sea-Ice Free Year-Round ~4100 Years Ago

by Brice et al., May 28, 2020 in NoTricksZone


Today, the region north of Svalbard is encrusted with sea ice for all but a few weeks per year and summer sea surface temperatures (SSTs) hover near 0°C.  Scientists (Brice et al., 2020) have determined this same region had sea ice-free conditions last about 10 months per year while SSTs reached 4°C just ~4100 years ago.

In early September, 2019, Arctic explorers once again needed to be rescued from the “disappearing” sea ice that had captured their ship in central Svalbard. This region is presently free of sea ice for only a few weeks per year (late August).

Image Source: electroverse.net

The Yin and Yang of Holocene Polar Regions Andy May / 1 day ago May 27, 2020

by R. Hannon/A. May, May 27, 2020 in WUWT


Introduction

The Arctic and Antarctic regions are different and yet similar in many ways. The Arctic has ocean surrounded by land and the Antarctic is a continent surrounded by water. Both are cold, glaciated and located at Earth’s poles some 11,000 miles apart. While sea ice has been retreating in the Arctic, it has been relatively stable in the Antarctic. This post examines surface temperature trends, solar insolation, and CO2 at the polar Arctic and Antarctic regions during the Holocene interglacial period.


Continuer la lecture de The Yin and Yang of Holocene Polar Regions Andy May / 1 day ago May 27, 2020

Arctique géologique 1/2

by Préat A. & Van Vliet-Lanoë B., 22 mai 2020 in ScienceClimatEnergie


A la grande différence de l’Antarctique, l’Arctique est un océan entouré de plateaux continentaux (Fig. 2). L’océan ou bassin arctique est actuellement constitué par un double bassin, séparé une crête très importante, la ride Lomonosov : le sous-bassin canadien à croûte continentale amincie (3 600 m)  et le sous-bassin eurasiatique à croûte océanique mince, de loin le plus profond (5000 m entre la crête Lomonosov et la ride océanique active de Gakkel). Il est entouré comme le long de l’Atlantique Nord par une plateforme continentale ennoyée, constituée de croûte continentale.  Le bassin arctique  d’abord marin et connecté au Proto-Atlantique au début du Jurassique (voir plus loin), est isolé depuis le Jurassique moyen et essentiellement de nature lacustre, modifiant le régime thermique océanique, amenant un contexte voisin du Glaciaire au Crétacé inférieur (au Valanginien in Dromart et al. 2003 ; Korte et al. 2015 ; Piskarev et al. 2018). Il ne se ré-ouvrira sur le bassin atlantique qu’à partir de l’Eocène, via l’ouverture du détroit de Fram. D’autre part le pôle  magnétique terrestre (Nord) est resté sur le bassin arctique depuis le début du Jurassique, donc en position de déficit énergétique lié à l’obliquité de l’orbite terrestre.

Fig. 2  Image Gebco Arctique : L’océan ou bassin arctique est actuellement constitué par un double bassin, séparé une crête très importante, la ride Lomonossov (voir texte).

GREENLAND HAS GAINED 27+ GIGATONS OF SNOW AND ICE OVER THE PAST 5 DAYS ALONE — MSM SILENT

by Cap Allon, April, 2020 in Electroverse


Despite decades of doom-and-gloom prophecies, Greenland’s Ice Sheet is currently GAINING monster amounts of “mass” — 27 gigatons over the past 5 days alone (April 14 – 18, 2020).

Crucial to the survival of a glacier is its surface mass balance (SMB)–the difference between accumulation and ablation (sublimation and melting). Changes in mass balance control a glacier’s long-term behavior, and are its most sensitive climate indicators (wikipedia.org).

On the back of substantial SMB gains over the past few years, the Greenland ice sheet looks set to continue that trend in 2019-20. From April 14 through April 18, 2020, the world’s largest island added a monster 27+ gigatons to its ice sheet. According to climate alarmists, this simply shouldn’t be happening in a warming world. In fact, it might as well not be happening as developments like these NEVER receive MSM attention, meaning alarmists are NEVER privy to the full and unalarming picture…

‘Arctic April’ Grips N. America Breaking Hundreds Of Cold Records

by Cap Allon, April 16, 2020 in ClimateChangeDispatch


Record cold and snowfall hit many parts of North America over the Easter weekend, continuing what has so far been a largely Arctic April.

Records were toppled across many U.S. states, with Montana, Iowa, South Dakota, and Colorado seemingly worst hit.

A winter storm system moved through Iowa on Sunday delivering between three inches and a foot to the majority of locations — several northern Iowa towns saw all-time records tumble:

The 3.7 inches that fell at Sioux Gateway Airport broke the record for April 12th; it also made it the second-highest Easter snowfall ever behind the 4.7 inches during Easter 1929.

The town of Ringsted in Emmet County (also Iowa) came in with a record-busting 11 inches.

Robert “Lightning” Petersen was the man to log the accumulation — he uses his back yard measuring equipment to keep track of snow and rainfall. He works in concert with the National Weather Service out of Johnston.

El Nino & Arctic Warming In the 1930s

by P. Homewood, April 5, 2020 in NotaLotofPeopleKnowThat


Just following up on Joe Bastardi’s article yesterday about El Ninos and Arctic warming, it is worth looking at longer term trends.

Below is the chart of the MEI, with red indicating El Ninos and blue La Ninas.:

Extended Multivariate ENSO Index

https://www.esrl.noaa.gov/psd/enso/mei.ext/

As we can see, the period 1925 to 1945 was dominated by powerful El Ninos. This of course was also the time of great warming in the Arctic, known as “The Warming in The North”, when temperatures across much of the Arctic were as high as they are now.

During the 1950s, a much colder climate took over in the Arctic, until it became warmer again in the 90s. This was also a period when La Ninas dominated.

Coincidence?

The climate in the Arctic is also very well correlated with the Atlantic Multidecadal Oscillation (AMO):

Continuer la lecture de El Nino & Arctic Warming In the 1930s

GREENLAND’S SMB GAINED 6 GIGATONS YESTERDAY + NORTHERN HEMISPHERE SNOW MASS SITTING AT 500 GIGAGTONS ABOVE THE NORM

by Cap Allon, March 29, 2020 in Electroverse


Despite decades of doom-and-gloom prophecies, Greenland’s Ice Sheet is currently GAINING monster amounts of “mass”— 6 gigatons yesterday alone (March 28, 2020).

Crucial to the survival of a glacier is its surface mass balance (SMB)–the difference between accumulation and ablation (sublimation and melting). Changes in mass balance control a glacier’s long-term behavior, and are its most sensitive climate indicators (wikipedia.org).

On the back of substantial SMB gains over the past few years, the Greenland ice sheet looks set to continue that trend in 2019-20. On March 28, 2020, the world’s largest island added a monster 6 gigatons to its ice sheet. According to climate alarmists, this simply shouldn’t be happening in a warming world. In fact, it might as well not be happening–developments like this NEVER receive MSM attention, meaning alarmists are NEVER privy to the full and unalarming picture…

polarportal.dk/

In addition, Total Snow Mass for the Northern Hemisphere continues to track WELL-above average with the latest data point (March 27) seeing NH snow at a staggering 500+ gigatons above the norm—another real-world reality we were told should be an impossibility by now: IPCC 2001: “Milder winter temperatures will decrease heavy snowstorms…”

Continuer la lecture de GREENLAND’S SMB GAINED 6 GIGATONS YESTERDAY + NORTHERN HEMISPHERE SNOW MASS SITTING AT 500 GIGAGTONS ABOVE THE NORM

Les glaces terrestres, la cryosphère (2/3)

by J.C. Maurin, 27 mars 2020 in ScienceClimatEnergie


Partie 2/3 : Lecture critique du chapitre cryosphère de l’AR5

par J.C. Maurin, Professeur agrégé de physique

Cette deuxième partie de l’article examine la composition du chapitre 4 du 5ème rapport du GIEC (AR5) [1].
Dans ce chapitre, qui concerne les différentes composantes de la cryosphère, les banquises [2] et glaciers [3] sont particulièrement mises en avant par les rédacteurs du GIEC.
A propos de ces 2 composantes mineures (0,65 % du volume de la cryosphère), l’article développe certains éléments d’appréciation que les rédacteurs de l’AR5 n’ont pas mis en exergue.

Continuer la lecture de Les glaces terrestres, la cryosphère (2/3)

Absence of evidence for greenhouse warming over the Arctic Ocean-Mark Serreze 1990

by P. Homewood, March 23, 2020 in NotaLotofPeopleKnowThat


We are familiar with the incessant claims that the Arctic is one of the fastest warming regions on Earth, and that this is due to the polar amplification effect of greenhouse gases.

But scientists back in the 1990s found that this theory did not stack up then:

Abstract

ATMOSPHERIC general circulation models predict enhanced greenhouse warming at high latitudes1owing to positive feedbacks between air temperature, ice extent and surface albedo2–4. Previous analyses of Arctic temperature trends have been restricted to land-based measurements on the periphery of the Arctic Ocean5,6. Here we present temperatures measured in the lower troposphere over the Arctic Ocean during the period 1950–90. We have analysed more than 27,000 temperature profiles, measured by radiosonde at Russian drifting ice stations and by dropsonde from US ‘Ptarmigan’ weather reconnaissance aircraft, for trends as a function of season and altitude. Most of the trends are not statistically significant. In particular, we do not observe the large surface warming trends predicted by models; indeed, we detect significant surface cooling trends over the western Arctic Ocean during winter and autumn. This discrepancy suggests that present climate models do not adequately incorporate the physical processes that affect the polar regions.

https://www.nature.com/articles/361335a0

The cooling between 1950 and 1990 is very evident at a whole range of land sites on the fringes of the Arctic, ranging from Greenland right through to eastern Siberia.

Les glaces terrestres, la cryosphère (1/3)

by J.C. Maurin, 13 mars 2020 in ScienceClimatEnergie


On désigne par cryosphère l’ensemble des glaces terrestres. Son évolution, lors des dernières décennies, est souvent présentée comme préoccupante: il en résulterait une forte hausse des niveaux marins et un changement d’albédo et donc du bilan énergétique de la Terre. Cette première partie de l’article présentera quelques ordres de grandeurs pour les glaces terrestres.
On utilisera principalement les données du chapitre 4 du rapport AR5 WG1 (5th Assessment Report, Working Group 1) qui a été publié en 2013 par l’organisme intergouvernemental GIEC.


4. Conclusions

  • La cryosphère c’est en premier lieu les zones proches du pôle Sud : banquises et glaciers ne représentent ensemble que 0,7% du volume de la cryosphère alors que la seule partie Est de l’Antarctique, bien moins connue, représente plus de 75% de la cryosphère, soit 107 fois plus.
  • La simple correction du volume de glace en Antarctique, entre les rapports du GIEC AR4 (2007) et AR5 (2013), est 4 fois plus grande que le volume (Banquises + Glaciers).
  • Les variations actuelles de la cryosphère restent négligeables si on les compare à celles du passé : l’ensemble des glaces terrestres, il y a 20 millénaires, devait avoir un volume au moins double du volume actuel. En effet, la fonte des glaces (entre -18 ka et -8 ka) fait monter le niveau des océans de ≈ 120 m  contre 66 m SLE (Sea Level Equivalent à la Figure 1).

La deuxième partie de l’article (2/3) commentera les choix rédactionnels du GIEC pour le chapitre 4 de l’AR5 et donnera des ordres de grandeurs complémentaires pour les banquises et les glaciers.

Arctic Meltdown Latest

by P. Homewood, March 3, 2020 in NotaLotofPeopleKnowThat


Arctic sea ice extent continues to run well ahead of the last few years, as it has done for most of this year so far, and continues to grow at a time of year when it normally begins to stabilise and recede.

Average extent in February was the highest since 2013, and stands greater than 2005 and 2006:

http://ocean.dmi.dk/arctic/icecover_30y.uk.php

Why are polar bears going extinct? (Spoiler: They’re not)

by S. Crockford, February 24, 2020 in WUWT


Google says many people ask this question so here is the correct answer: polar bears are not going extinct. If you have been told that, you have misunderstood or have been misinformed. Polar bears are well-distributed across their available habitat and population numbers are high (officially 22,000-31,000 at 2015 but likely closer to 26,000-58,000 at 2018): these are features of a healthy, thriving species. ‘Why are polar bears going extinct?’ contains a false premise – there is no need to ask ‘why’ when the ‘polar bears [are] going extinct’ part is not true.1

mother-with-cubs-russia_shutterstock_71694292_web-size-e1582489285608

It is true that in 2007, it was predicted that polar bear numbers would plummet when summer sea ice declined to 42% of 1979 levels for 8 out of 10 years (anticipated to occur by 2050) and extinct or nearly so by 2100 (Amstrup et al. 2007). However, summer sea ice has been at ‘mid-century-like’ levels since 2007 (with year to year variation, see NOAA ice chart below) yet polar bear numbers have increased since 2005. The anticipated disaster did not occur but many people still believe it did because the media and some researchers still give that impression.

Study: Computer Models Overestimate Observed Arctic Warming

by Craig Idso, February 26, 2020 in ClimateChageDispatch


Paper Reviewed:
Huang, J., Ou, T., Chen, D., Lun, Y. and Zhao, Z. 2019. The amplified Arctic warming in recent decades may have been overestimated by CMIP5 models. Geophysical Research Letters 46: 13,338-12,345.

Policies aimed at protecting humanity and the environment from the potential effects of CO2-induced global warming rely almost entirely upon models predicting large future temperature increases.

But what if those predictions are wrong? What if a comparison between model projections and observations revealed the models are overestimating the amount of warming?

Would climate alarmists admit as much and back away from promoting extreme policies of CO2 emission reductions?

Probably not — at least based upon the recent rhetoric of each of the candidates seeking the Democrat Party’s nomination for President of the United States, all of whom continue to call for the complete elimination of all CO2 emissions from fossil fuel use within the next three decades, or less.

But for non-ideologues who are willing to examine and accept the facts as they are, the recent work of Huang et al. (2019) provides reason enough to pause the crazy CO2 emission-reduction train.

In their study, the five researchers set out to examine how well model projections of Arctic temperatures (poleward of 60°N) compared with good old-fashioned observations.

More specifically, they used a statistical procedure suitable for nonlinear analysis (ensemble empirical mode decomposition) to examine secular Arctic warming over the period 1880-2017.

Observational data utilized in the study were obtained from the HadCRUT4.6 temperature database, whereas model-based temperature projections were derived from simulations from 36 Coupled Model Intercomparison Project Phase 5 (CMIP5) global climate models (GCMs).

Figure 1. Observed and model-predicted rates of nonlinear, secular warming in the Arctic (60-90°N) over the period 1880-2017. The black and red dashed lines indicate the 10th and 90th percentiles for temperature means. Adapted from Huang et al. (2019).

As indicated there, the model-estimated rate of secular warming (the solid red line) increased quite sharply across the 138 year period, rising from a value of around 0°C per decade at the beginning of the record to a value of 0.35°C per decade in the end.

Unexpected ice

by N. Vizcarra, February 2020 in EarthData/NASA


Paul Holland, a climate modeler with the British Antarctic Survey, has spent the last ten years studying Antarctica’s sea ice and the Southern Ocean. Lately, he has been scrutinizing the seasons of Antarctica and how fast the ice comes and goes. Holland thinks these seasons may be a key to a conundrum: If Earth’s temperatures are getting warmer and sea ice in the Arctic has been shrinking fast, why then is sea ice in the Antarctic slowly increasing?

Spring surprise

Holland used data from NASA’s National Snow and Ice Data Center Distributed Active Archive Center (NSIDC DAAC) to calculate the ice concentration rate of growth for each single day, which he called intensification; and the total ice area rate of growth, which he called expansion. “I did that for all thirty years of data and plotted the trends,” he said. Holland’s plots showed that the different regions in the Southern Ocean contributed to the overall increase, but they had very diverse trends in sea ice growth. This suggested that geography and different wind patterns played a role. So to gain more insight Holland looked at seasonal wind trends for the different regions.

Holland found that winds were spreading sea ice out in some regions and compressing or keeping it intact in others and that these effects began in the spring. It contradicted a previous study in which, using ice drift data, Holland and Ron Kwok from the NASA’s Jet Propulsion Laboratory (JPL) found that increasing northward winds during the autumn caused the variations.

“I always thought, and as far as I can tell everyone else thought, that the biggest changes must be in autumn,” Holland said. “But the big result for me now is we need to look at spring. The trend is bigger in the autumn, but it seems to be created in spring.”

“Paul has created two more sea ice metrics that we can use to assess how Antarctic sea ice is responding,” said researcher Sharon Stammerjohn, referring to the measures of intensification and expansion. The new metrics help assess how the system is responding as opposed to simply monitoring the state of the system. “Say your temperature is at 99.2 degrees Fahrenheit,” Stammerjohn said. “You don’t have any insight to that temperature unless you take it again an hour later and you see that it changed to 101 degrees. Then you can say, okay, my system is responding to something.”

Polar bear habitat at mid-winter as extensive as 2013 & better than 2006

by S. Crockford, February 14, 2020 in PolarbearScience


Arctic sea ice at the middle of winter (January-March) is a measure of what’s to come because winter ice is the set-up for early spring, the time when polar bears do most of their feeding on young seals.

[Mid-winter photos of polar bears are hard to come by, partly because the Arctic is still dark for most hours of the day, it’s still bitterly cold, and scientists don’t venture out to do work on polar bears until the end of March at the earliest]

At 12 February this year, the ice was similar in overall extent to 2013 but higher than 2006.

New Study: Greenland Was ‘4–5 °C Warmer Than Today’ ~9000 Years Ago…When The Arctic Was Nearly Sea-Ice Free

by Syring et al., February 6, 2020 in NoTricksZone


Scientists (Syring et al., 2020) find almost sea ice-free conditions pervaded a much warmer northern Greenland region during the Early Holocene.  Arctic sea ice extent has “continuously” grown for ~4800 years, with modern conditions a bit lower than the peak of the last few centuries.


In a new paper (Syring et al., 2020), scientists rely on biomarker evidence – (a) the presence of warmth-demanding species Armeria scabra and Mytilus edulis, and (b) IP25, a proxy for the presence or absence of sea ice – to suggest not only were there much warmer (4 to 5°C) northern Greenland temperatures 10,000 to 8500 years ago, but effectively sea ice-free conditions pervaded the region during this time.

The sea ice in the region has been growing “continuously” for the last 4800 years, reaching its peak during the last millennium.

The authors also find decadal- and centennial-scale periodicities in solar activity have coincided with variability in Arctic sea ice (IP25) throughout the Holocene.

GREENLAND’S SMB GAINED 7 GIGATONS YESTERDAY

by Cap Allon, February 7, 2020 in Electroverse


Despite decades of doom-and-gloom prophecies, Greenland’s Ice Sheet is currently GAINING monster amounts of “mass”— 7 gigatons yesterday alone (Feb. 06, 2020).

Crucial to the survival of a glacier is its surface mass balance (SMB)–the difference between accumulation and ablation (sublimation and melting). Changes in mass balance control a glacier’s long-term behavior, and are its most sensitive climate indicators (wikipedia.org).

On the back of substantial SMB gains over the past few years, the Greenland ice sheet looks set to continue that trend in 2019-20. On February 06, 2020, the world’s largest island added a monster 7 gigatons to its ice sheet. According to climate alarmists, this simply shouldn’t be happening in a warming world. In fact, it might as well not be happening–developments like this NEVER receive MSM attention, meaning alarmists are NEVER privy to the full and unalarming picture…

http://polarportal.dk/en/greenland/

The Insignificance of Greenland’s Ice Mass Loss in Five Easy Charts…

by David Middleton, February 5, 2020 in WUWT


This is a sort of a spin-off of Rutgers University Global Snow Lab and “the Snows of Yesteryear” and A Geological Perspective of the Greenland Ice Sheet. And, yes, there are a lot more than five charts in this post… And, none of them were all that easy.

Introduction

There is a general scientific consensus that the Greenland Ice Sheet (GrIS) has been losing ice mass since the Little Ice Age (LIA). This should come as no surprise, since the LIA was quite likely the coldest climatic episode of the Holocene Epoch. Although it does appear that the GrIS may have gained ice mass during the mid-20th century global cooling crisis.

According to Mouginot et al, 2019, the GrIS was gaining an average of +47 ± 21 Gt/y from 1972–1980, then began to lose ice mass after 1980:

  • -51 ± 17 Gt/y from 1980–1990

  • -41 ± 17 Gt/y from 1990–2000

  • -187 ± 17 Gt/y from 2000–2010

  • -286 ± 20 Gt/y from 2010–2018


Figure 4. Central Greenland temperature reconstruction (Alley, 2000).

Extreme Arctic melting has a new suspect: The same powerful gases screwing over the ozone

by B.L. Beckman, January 21, 2020 in Mashable/Nature


They were once abundant, in our hairsprays, bug sprays, and refrigerators. And then scientists figured out these substances ripped a hole in the ozone layer, leading to a 1987 plan to phase them out that over time would be agreed to by every country in the world.

More than three decades later, researchers have made a new discovery.

Ozone-depleting substances do more than just gnaw at Earth’s protective layer. They’re also greenhouse gases, so they contribute to the planet’s overall warming by trapping heat, too. And now we may know just how much these substances have contributed to Arctic warming, thanks to a study published in the science journal Nature on Monday.

Between 1955 and 2005, ozone-depleting gases caused half of Arctic climate change (and a third of overall global warming), the study finds. This is primarily due to their heat-trapping qualities, not their ozone munching. The Arctic has seen rapidly melting sea ice for years and is warming faster than the rest of the world.

Greenland Ice Core CO2 Concentrations Deserve Reconsideration

by Renee Hannon, January 7, 2020, in WUWT


Introduction
Ice cores datasets are important tools when reconstructing Earth’s paleoclimate. Antarctic ice core data are routinely used as proxies for past CO2 concentrations. This is because twenty years ago scientists theorized Greenland ice core CO2 data was unreliable since CO2trapped in air bubbles had potentially been altered by in-situ chemical reactions. As a result, Greenland CO2 datasets are not used in scientific studies to understand Northern and Southern hemispheres interactions and sensitivity of greenhouse gases under various climatic conditions.

This theory was put forward because Greenland CO2 data were more variable and different than Antarctic CO2 measurements located in the opposite polar region about 11,000 miles away. This article re-examines Greenland ice cores to see if they do indeed contain useful CO2 data. The theory of in-situ chemical reactions to explain a surplus and deficit of CO2, relative to Antarctic data, will be shown to be tenuous. The Greenland CO2 data demonstrates a response to the Medieval Warm Period, Little Ice Age, Dansgaard-Oeschger and other past climate change events. This response to past climate changes offers an improved explanation for why Greenland and Antarctic CO2 measurements differ. Further, Greenland CO2 measurements show rapid increases of 100 ppm during warm events in relatively short periods of time.

Atmospheric CO2 is More Variable in Northern Latitudes

Figure 1, from NOAA, shows atmospheric CO2 concentrations measured from the continuous monitoring program at four key baseline stations spanning from the South Pole to Barrow, Alaska. CO2 has risen from about 330 ppm to over 400 ppm since 1975 and is increasing at approximately 1-2+ ppm/year. Many scientists believe that rapidly increasing CO2 is mostly due to fossil fuel emissions.

Figure 1. Atmospheric CO2 concentrations from NOAA

Early Holocene Temperature Oscillations Exceed Amplitude of Observed and Projected Warming in Svalbard Lakes

by Van der Bilt et al. , December 3, 2019 in GeophysResLetters


Abstract

Arctic climate is uniquely sensitive to ongoing warming. The feedbacks that drive this amplified response remain insufficiently quantified and misrepresented in model scenarios of future warming. Comparison with paleotemperature reconstructions from past warm intervals can help close this gap. The Early Holocene (11.7–8.2 ka BP) is an important target because Arctic temperatures were warmer than today. This study presents centennially resolved summer temperature reconstructions from three Svalbard lakes. We show that Early Holocene temperatures fluctuated between the coldest and warmest extremes of the past 12 ka, exceeding the range of instrumental observations and future projections. Peak warmth occurred ~10 ka BP, with temperatures 7 °C warmer than today due to high radiative forcing and intensified inflow of warm Atlantic waters. Between 9.5 and 8 ka BP, temperatures dropped in response to freshwater fluxes from melting ice. Facing similar mechanisms, our findings may provide insight into the near‐future response of Arctic climate.

Deep Purple — future biological darkening of the Greenland Ice Sheet

by GFZ GeoForschungsZentrum Potsdam, Helmholtz Centre, October 12, 2019  in WUWT


Purple algae are making the western Greenland Ice Sheet melt faster, as the algae darken the ice surface and make it absorb more sunlight.


The ERC (European Research Council) has awarded an €11 million Euro Synergy grant called DEEP PURPLE to Liane G. Benning at the German Research Centre for Geosciences (GFZ) Potsdam, Germany, Alexandre Anesio at Aarhus University, Denmark and Martyn Tranter at University of Bristol, UK. Their common goal is to examine over the next six years (2020-2026) the role of glacier algae in progressively darkening the Greenland Ice Sheet surface in a warming climate.

The three researchers have already changed our understanding of why the ice darkens during the melt season by identifying the purple-pigmented ice algal blooms in the ice surface. These glacier algae are pigmented deep purple to shield their vital elements from the intense UV radiation in sunlight. During the melt season there are so many of these deep purple algae that they look as black as the soot from tundra fires. They form a dark band that has been progressively growing down the western side of the Greenland Ice Sheet during the summer melt season for the last 20 years, causing increased melting of the darkening ice.

Just why these glacier algae grow so densely is not really known at the moment, and neither is whether they will grow in the new melt zones on the ice sheet surface, to the north and to the ice sheet interior, as the climate continues to warm.

Project DEEP PURPLE

Questions such as this need answering if future sea level rise is to be predicted accurately, since Greenland melt is a major driver of current sea level rise.

Project DEEP PURPLE aims to answer these questions over the next six years, combining curisoity driven science about how the glacier algae grow and interact with their icy habitat, and societally relevant research into the processes that lead to ice surface darkening that are needed by ice melt modellers.

The scientists will work around many different sites in Greenland, making measurements of surface darkening, glacier algae density, how much soot and dust the algae trap on the surface and the physical properties of the melting ice surface to finally understand, how biological darkening occurs, and to predict where and when it will occur in the future.