Archives par mot-clé : CO2

Barrels of ancient Antarctic air aim to track history of rare gas

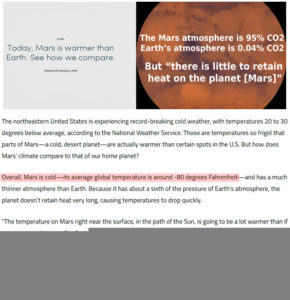
by University of Washington, December 13, 2019 in ScienceDaily


An Antarctic field campaign last winter led by the US and Australia has successfully extracted some of the largest samples of air dating from the 1870s until today. Researchers will use the samples to look for changes in the molecules that scrub the atmosphere of methane and other gases.

“It’s probably the most extreme atmospheric chemistry you can do from ice core samples, and the logistics were also extreme,” said Peter Neff, a postdoctoral researcher with dual appointments at the UW and at the University of Rochester.

But the months the team spent camped on the ice at the snowy Law Dome site paid off.

“This is, to my knowledge, the largest air sample from the 1870s that anyone’s ever gotten,” Neff said. His 10 weeks camped on the ice included minus-20 degrees Fahrenheit temperatures and several snowstorms, some of which he shared from Antarctica via Twitter.

Air from deeper ice cores drilled in Antarctica and Greenland has provided a record of carbon dioxide and methane, two greenhouse gases, going back thousands of years. While carbon dioxide has a lifetime of decades to centuries, an even more potent gas, methane, has a lifetime of just nine or 10 years.

Scientists: Mars Has A 95% CO2 Atmosphere…But ‘There Is Little To Retain Heat On The Planet’

by K. Richard, December 2, 2019 in NoTricksZone


Earth’s atmosphere contains 400 ppm CO2 (0.04%). Mars has a 950,000 ppm (95%) CO2 atmosphere. But Mars has surface temperatures that are about -75°C colder on average than Earth’s because atmospheric density, or pressure, is the “game changer” largely determining planetary temperatures.

Surface temperatures on Mars

The average surface temperature of a planetary body is significantly determined by its distance from the Sun.

According to the NASA Jet Propulsion Laboratory, Mars is close enough to the Sun to have its surface temperatures reach 35°C (95°F) at the equator during summer.

During winter, however, the Martian temperature dips to -90°C (-130°F).

The average surface temperature for Mars is about -60°C (-80°F).

Scientists Cite Uncertainty, Error, Model Deficiencies To Affirm A Non-Detectable Human Climate Influence

by K. Richard, November 21, 2019 in NoTricksZone


Observational uncertainty, errors, biases, and estimation discrepancies in longwave radiation may be 100 times larger than the entire accumulated influence of CO2 increases over 10 years. This effectively rules out clear detection of a potential human influence on climate.

The anthropogenic global warming (AGW) hypothesis rides on the fundamental assumption that perturbations in the Earth’s energy budget – driven by changes in downward longwave radiation from CO2 — are what cause climate change.

According to one of the most frequently referenced papers advancing the position that CO2 concentration changes (and downward longwave radiation perturbations) drive surface temperature changes, Feldman et al. (2015) concluded there was a modest 0.2 W/m² forcing associated with CO2 rising by 22 ppm per decade.

Again, that’s a total CO2 influence of 0.2 W/m² over ten years.

In contrast, analyses from several new papers indicate the uncertainty and error values in downwelling (and outgoing) longwave radiation in cloudless environments are more than 100 times larger than 0.2 W/m².

In other words, it is effectively impossible to clearly discern a human influence on climate.


1.  Kim and Lee, 2019   Measurement errors of outgoing longwave radiation (OLR) reach 11 W/m², more than 50 times larger than total CO2 forcing over 10 years. Cloud optical thickness (COT) and water vapor have “the greatest effect” on OLR – an influence of 2.7 W/m². CO2 must rise to 800 ppm to impute an influence of 1 W/m².

Scientists: CO2 Causes Cooling When Not Causing Warming And It’s A ‘Weak’ To ‘Negligible’ Climate Factor

by K. Richard, November 14, 2019 in NoTricksZone


It’s been acknowledged by mainstream scientists for years now that at certain locations on planet Earth, rising carbon dioxide levels cause cooling. It’s now been determined that rising CO2 also causes “negligible” cooling (or warming) depending on the season.

A few years ago a seminal paper (Schmithüsen et al., 2015) was published in Geophysical Research Letters that indicated raising the concentration of CO2 causes a negative greenhouse effect, or cooling, in central Antarctica.

The forcing from the CO2 greenhouse effect ranges from -2.9 W/m² to +1 W/m², and the forcing for the Arctic (central Greenland) is said to be “comparably weak”.

Propagation of Error and the Reliability of Global Air Temperature Projections

by Patrick Franck, September 6, 2019 in Frontierin EarthScience


The reliability of general circulation climate model (GCM) global air temperature projections is evaluated for the first time, by way of propagation of model calibration error. An extensive series of demonstrations show that GCM air temperature projections are just linear extrapolations of fractional greenhouse gas (GHG) forcing. Linear projections are subject to linear propagation of error. A directly relevant GCM calibration metric is the annual average ±12.1% error in global annual average cloud fraction produced within CMIP5 climate models. This error is strongly pair-wise correlated across models, implying a source in deficient theory. The resulting long-wave cloud forcing (LWCF) error introduces an annual average ±4 Wm–2uncertainty into the simulated tropospheric thermal energy flux. This annual ±4 Wm–2 simulation uncertainty is ±114 × larger than the annual average ∼0.035 Wm–2 change in tropospheric thermal energy flux produced by increasing GHG forcing since 1979. Tropospheric thermal energy flux is the determinant of global air temperature. Uncertainty in simulated tropospheric thermal energy flux imposes uncertainty on projected air temperature. Propagation of LWCF thermal energy flux error through the historically relevant 1988 projections of GISS Model II scenarios A, B, and C, the IPCC SRES scenarios CCC, B1, A1B, and A2, and the RCP scenarios of the 2013 IPCC Fifth Assessment Report, uncovers a ±15 C uncertainty in air temperature at the end of a centennial-scale projection. Analogously large but previously unrecognized uncertainties must therefore exist in all the past and present air temperature projections and hindcasts of even advanced climate models. The unavoidable conclusion is that an anthropogenic air temperature signal cannot have been, nor presently can be, evidenced in climate observables.

Ancient Air Challenges Prominent Explanation For A Shift In Glacial Cycles

by E. W. Wolf, November 4, 2019 in WUWT


From Nature

An analysis of air up to 2 million years old, trapped in Antarctic ice, shows that a major shift in the periodicity of glacial cycles was probably not caused by a long-term decline in atmospheric levels of carbon dioxide.

Eric W. Wolff

During the past 2.6 million years, Earth’s climate has alternated between warm periods known as interglacials, when conditions were similar to those of today, and cold glacials, when ice sheets spread across North America and northern Europe. Before about 1 million years ago, the warm periods recurred every 40,000 years, but after that, the return period lengthened to an average of about 100,000 years. It has often been suggested that a decline in the atmospheric concentration of carbon dioxide was responsible for this fundamental change. Writing in Nature, Yan et al.1 report the first direct measurements of atmospheric CO2 concentrations from more than 1 million years ago. Their data show that, although CO2levels during glacials stayed well above the lows that occurred during the deep glacials of the past 800,000 years, the maximum CO2 concentrations during interglacials did not decline. The explanation for the change must therefore lie elsewhere.

Understanding what caused the shift in periodicity, known as the mid-Pleistocene transition (MPT), is one of the great challenges of palaeoclimate science. The 40,000-year periodicity that dominated until about 1 million years ago is easily explained, because the tilt of Earth’s spin axis relative to its orbit around the Sun varies between 22.1° and 24.5° with the same period. In other words, before the MPT, low tilts led to cooler summers that promoted the growth and preservation of ice sheets.

But after the MPT, glacial cycles lasted for two to three tilt cycles. Because the pattern of variation in Earth’s orbit and tilt remained unchanged, this implies that the energy needed to lose ice sheets2 had increased. One prominent explanation3 is that atmospheric levels of CO2 were declining, and eventually crossed a threshold value below which the net cooling effect of the decline allowed ice sheets to persist and grow larger.

Debunking Popular Climate Myths About CO2

by N. Thurner, October 25, 2019 in ClimateChageDispatch


If you believe the debate over global warming has ever been about science—or for that matter climate—you have been conditioned, through formal education or through reports warning of doom and gloom, to believe what others rightly describe as a world-wide hoax concocted to unite the world under a single socialistic government where there is no capitalism, no democracy, and no freedom.

Why is exposing the truth so important? Because it has everything to do with the redistribution of wealth and the establishment of political agendas aimed at destroying the foundation of eastern democracies and free markets.

Accordingly, it is therefore critical for everyone to become informed so free and open debate can exist, rather than the suppression and falsification of actual scientific climate data.

This article will expose some of the popular climate myths about CO2, so the reader will be equipped with ammunition to spread the truth to those who are willing to listen and have not yet become environmental extremists.

Links are included after each myth to substantiate information and to provide reference material for further interest and clarification.

The article was written using individual articles, with permission from my friend Jay Lehr, Ph.D., in which he exposed popular climate myths related to CO2. Jay Lehr is a Senior Policy Analyst for The International Climate Science Coalition.

Myth #1:  Carbon dioxide emissions cause catastrophic global warming.

Human CO2 Emissions Have Little Effect On Atmospheric CO2

by Ed Berry, October 21, 2019 in PrincipiaScientificInternational


The United Nations Intergovernmental Panel on Climate Change (IPCC) agrees human CO2 is only 5 percent and natural CO2 is 95 percent of the CO2 inflow into the atmosphere. The ratio of human to natural CO2 in the atmosphere must equal the ratio of the inflows.

Yet IPCC claims human CO2 has caused all the rise in atmospheric CO2 above 280 ppm, which is now 130 ppm or 32 percent of today’s atmospheric CO2.

To cause the human 5 percent to become 32 percent in the atmosphere, the IPCC model treats human and natural CO2 differently, which is impossible because the molecules are identical. IPCC’s Bern model artificially traps human CO2 in the atmosphere while it lets natural CO2 flow freely out of the atmosphere.

By contrast, a simple Physics Model treats all CO2 molecules the same, as it should, and shows how CO2 flows through the atmosphere and produces a balance level where outflow equals inflow. Thereafter, if inflow is constant, level remains constant.

The Physics Model has only one hypothesis, that outflow is proportional to level. The Physics Model exactly replicates the 14C data from 1970 to 2014 with only two physical parameters: balance level and e-time. The 14C data trace how CO2 flows out of the atmosphere.

The Physics Model shows the 14CO2 e-time is a constant 16.5 years. Other data show e-time for 12CO2 is about 4 to 5 years. IPCC claims human CO2 reduces ocean buffer capacity. But that would increase e-time. The constant e-time proves IPCC’s claim is false.

IPCC argues that the human-caused reduction of 14C and 13C in the atmosphere prove human CO2 causes all the increase in atmospheric CO2. However, numbers show these isotope data support the Physics Model and reject the IPCC model.

The Physics Model shows how inflows of human and natural CO2 into the atmosphere set balance levels proportional to their inflows. Each balance level remains constant if its inflow remains constant. Continued constant CO2 emissions do not add more CO2 to the atmosphere. No CO2 accumulates in the atmosphere.

Present human CO2 inflow produces a balance level of about 18 ppm. Present natural CO2 inflow produces a balance level of about 392 ppm. Human CO2 is insignificant to the increase of CO2 in the atmosphere. Increased natural CO2 inflow has increased the level of CO2 in the atmosphere.

Keywords: carbon dioxide, CO2, climate change, anthropogenic

Physicist: CO2 Molecules Retain Heat Just 0.0001 Of A Second, Thus CO2-Driven Warming ‘Not Possible’

by K. Richard, October 17 2019, in NoTricksZone


Mainstream climate science claims CO2 molecules “slow down the rate of heat-loss from the surface” like a blanket does. And yet the rate at which a CO2 molecule retains or slows down heat loss is, at most, a negligible 0.0001 of a second. A CO2 concentration of 300 ppm versus 400 ppm will therefore have no detectable impact.

SkepticalScience, a blog spearheaded by climate science “consensus” advocate John Cook, is widely considered the explanatory guidebook for the anthropogenic global warming movement.

The blog claims CO2 molecules, with a representation of 4 parts in 10,000 in the atmosphere (400 parts per million, or ppm), collectively function like a blanket does in slowing down the rate at which the human body cools.


Image Source: Nahle, 2011b

Why CO2 is Not the Control Knob of Global Temperature and Observational Proof it is Not Causing Dangerous Warming

by Institute for the Human Environment,   August 2019


There is no debate as to whether or not atmospheric carbon dioxide, or CO2, is a so-called greenhouse gas. When present in the atmosphere, this one-carbon and two-oxygen molecule indeed has the capacity to absorb infrared radiation and warm the planet. There is also no debate as to whether or not the concentration of atmospheric CO2 is rising; over the past two centuries it has increased from a meager 0.028% of the atmosphere by volume to a still-meager 0.041% today. Furthermore, there is no argument that global temperatures are warmer today than they were 50, 100 or even 200 years ago. However, there is much debate on whether or not the modern increase in atmospheric CO2 has caused, or is presently causing, dangerous global warming, warming so severe that it is threatening life all across the planet.

But how accurate is this narrative?

In answering this question, one need only examine the historic temperature and CO2 records illustrated in Figure 1 more critically. Certainly, these two variables experience a fairly high degree of correlation over the time period shown. However, it doesn’t take a Ph.D. scientist to recognize and understand the fact that correlation among two variables does not prove causation. Every textbook on statistics teaches as much, and they also teach that a hypothesis of causation among two variables can be rejected if there is no statistically significant correlation between them, or if the correlation fails to be maintained in a consistent and expected manner across time.

By applying such principles to the case being considered here, it can confidently be argued that if carbon dioxide is indeed the all-important control knob of temperature that climate alarmists claim it to be, then changes in atmospheric CO2 should always precede changes in temperature. And, because CO2 is a greenhouse gas, to prove causation those changes must always be such that a rise in CO2 induces a corresponding rise in temperature, whereas a decline in CO2 must always induce a corresponding drop in temperature. Consistent observations to the contrary, if present in the historic record, would therefore serve to invalidate a causation claim, as well as demonstrate that atmospheric CO2 is nothing more than a bit player among the many factors that drive climate change.

Figure 1. 400,000 years of historic temperature and CO2 from the Vostok Ice Core, Antarctica. Source: Petit et al. (1999) Nature 399: 429-436.

CO2 Is So Powerful It Can Cause Global Warming To Pause For Decades

by Joanna Nova, July 24, 2019 in ClimateChangeDispatch


It’s all so obvious. If researchers start with models that don’t work, they can find anything they look for — even abject nonsense which is the complete opposite of what the models predicted.

Holy Simulation! Let’s take this reasoning and run with it  — in the unlikely event, we actually get relentless rising temperatures, that will imply that the climate sensitivity of CO2 is lower. Can’t see that press release coming…

Nature has sunk so low these days it’s competing with The Onion.

The big problem bugging believers was that global warming paused, which no model predicted, and which remains unexplained still, despite moving goalposts, searching in data that doesn’t exist, and using error bars 17 times larger than the signal.

The immutable problem is that energy shalt not be created nor destroyed, so The Pause still matters even years after it stopped pausing.

The empty space still shows the models don’t understand the climate — CO2 was supposed to be heating the world, all day, every day.

Quadrillions of Joules have to go somewhere, they can’t just vanish, but models don’t know where they went. If we can’t explain the pause, we can’t explain the cause, and the models can’t predict anything.

In studies like these, the broken model is not a bug, it’s a mandatory requirement — if these models actually worked, it wouldn’t be as easy to produce any and every conclusion that an unskeptical scientist could hope to “be surprised” by.

The true value of this study, if any, is in 100 years time when some psychology Ph.D. student will be able to complete an extra paragraph on the 6th-dimensional flexibility of human rationalization and confirmation bias.

Busted climate models can literally prove anything. The more busted they are, the better.

1980s Science: Ice Cores Show CO2 Naturally Rose 200 ppm (65 ppm/100 Years) During The Early Holocene

by K. Richard, July 22, 2019 in NoTricksZone


A few decades ago it was “consensus” science that CO2 levels had reached 400 ppm (and even up to 500 ppm) during the Early Holocene, with rising amplitudes of greater than 200 ppm and rates of 65 ppm in less than a century. Then the “consensus” opinion changed.

In 1982 it was still quite acceptable for Dr. Flohn, a climate scientist, to acknowledge that changes in CO2 concentration changes are significantly determined by temperature “rather independent of” fossil fuel emissions, but also that Holocene CO2 concentrations reached 350 to 400 ppm between 8,000 to 6,000 years ago (Flohn, 1982).

Why the discrepancy between “consensus” CO2 and historically recorded CO2?

Polish physicist Dr. Zbigniew Jaworowski (1997) was a fierce critic of the means by which ice core data have been collected to assign CO2 concentration values to past epochs.

His criticisms center around the post-1985 tendencies for fellow scientists to openly employ selection bias in making pre-determined decisions about what measurements are “right” and which ones are “wrong” – effectively rendering their results meaningless.

He cites Pearlman et al. (1986), for example. These authors collected 74 Antarctic ice core CO2 samples. Of those, 32 (43%) were rejected because they had values that were too high or too low to match with the agreed-upon pre-determination.

In what other branch of science is it acceptable to discard measured data we don’t agree with?


La croissance du CO2 dans l’atmosphère est-elle exclusivement anthropique? (3/3)

by J.C. Maurin, 19 juillet 2019 in ScienceClimatEnergie


Effet Bombe et Modèles du GIEC

Les prévisions du climat sont générées par des modèles informatiques. Leurs concepteurs pensent pouvoir décrire l’état moyen de l’atmosphère en 2100, en prenant comme principale donnée d’entrée, le taux futur de CO2 qui constituerait donc le ‘bouton de commande’ du climat.

Il y a deux étages de modélisation : on commence par prévoir le taux de CO2 en 2100 avec des modèles sélectionnés par le GIEC (ces modèles « IRF » du GIEC sont l’objet de l’article).
Cette prévision constitue ensuite l’entrée du second étage, à savoir les modèles types « échanges radiatifs » ou « effet de serre » qui ne sont pas traités ici (mais on peut consulter ceci).
Le présent article ( qui est la suite de deux autres ici et ici) compare la réponse impulsionnelle théorique de ces modèles « IRF » avec la réponse impulsionnelle observée du 14CO2(effet Bombe).

The Response of Grape Plantlets to CO2 Enrichment

by Zhao et al., 2019 in BMCPlantBiology/CO2Science


Recognizing that increasing atmospheric CO2 concentrations promotes plant development and growth, Zhao et al. set out to investigate the effect of elevated CO2 on a key wine grape variety, Pinot Noir.

Their experiment was conducted in controlled climate chambers at the Fruit Tree Physiology and Biotechnology Laboratory, College of Horticulture, Gansu Agricultural University, China. Grape plantlets (Vitis vinifera, cv. Pinot Noir) were propagated and then cultured in a 2% sucrose solution at either ambient (380 ppm) or elevated (1,000 ppm) CO2 concentrations for a period of 25 days. At the end of the experiment the authors examined the impact of CO2 on various growth-related parameters, while also conducting transcriptomic and proteomic analyses.

Results indicated that elevated CO2 stimulated total plant dry weight, leaf area and plant height by 125%, 96% and 31%, respectively (see Figure 1). Photosynthetic parameters also revealed a CO2-induced stimulation and the various physiological changes were found to be related to differentially expressed genes and proteins among the plants growing in the two environments. Such findings suggest Pinot Noir may well be a “winner” (in terms of growth and development) among plants in the future if the air’s CO2 content continues to rise.

Figure 1. Visual display of the growth differences between grapes grown under ambient (380 ppm) or elevated (1,000 ppm) CO2 concentrations for 25 days. The average dry weight of the grapes growing under elevated CO2 was 125% greater than those growing under ambient CO2. Source: Zhao et al. (2019).

NO EXPERIMENTAL EVIDENCE FOR THE SIGNIFICANT ANTHROPOGENIC CLIMATE CHANGE

by J. Kauppinen and P. Malmi, July 13, 2019 in Physics.gen-ph


Abstract. In this paper we wil lprove that GCM-models used inI IPCC report AR5 fail to calculate the influences of the low cloud cover changes on the global temperature. That is why those models give a very small natural temperature change leaving a very large change for the contribution of the green house gases in the observed temperature. This is the reason why IPCC has to use a very large sensitivity to compensate a too small natural component. Further they have to leave out the strong negative feedback due to the clouds in order to magnify the sensitivity. In addition, this paper proves that the changes in the low cloud cover fraction practically control the global temperature.

1. Introduction

The climate sensitivity has an extremely large uncertainty in the scientific lit- erature. The smallest values estimated are very close to zero while the highest ones are even 9 degrees Celsius for a doubling of CO2. The majority of the papers are using theoretical general circulation models (GCM) for the estimation. These models give very big sensitivities with a very large uncertainty range. Typically sensitivity values are between 2–5 degrees. IPCC uses these papers to estimate the global temperature anomalies and the climate sensitivity. However, there are a lot of papers, where sensitivities lower than one degree are estimated without using GCM. The basic problem is still a missing experimental evidence of the cli- mate sensitivity. One of the authors (JK) worked as an expert reviewer of IPCC AR5 report. One of his comments concerned the missing experimental evidence for the very large sensitivity presented in the report [1]. As a response to the com- ment IPCC claims that an observational evidence exists for example in Technical Summary of the report. In this paper we will study the case carefully.

2. Low cloud cover controls practically the global temperature

Scientists: Humans Perform As Well Or Better When Exposed To High (5000-15000 ppm) vs. Low CO2 Concentrations

by K. Richard, July 8, 2019 in NoTricksZone


A new paper finds the performance of test-taking (cognitive, decision-making) “astronaut-like” subjects exposed to 5000 ppm CO2 was “similar to or exceeded” the performance of those exposed to baseline (600 ppm). This study follows up on a 2018 paper that determined submariners exposed to 15000 ppm CO2 performed just as well as subjects exposed to 600 ppm.

Those of us who own CO2 monitors know that indoor (bedroom) CO2 concentrations typically vary between about 600 ppm during the day and 1000 ppm overnight – the latter earning a frowny face air quality rating.


CO2 is a cognitively-impairing toxin?

In recent years there has been a push to create the impression carbon dioxide is a pollutant, or toxin. Consequently, there have been a few studies suggesting exposure to higher CO2 concentrations (~1500 to 2500 ppm) severely impair human cognitive and decision-making performance (Satish et al., 2012, Allen et al., 2016).

If true, this would be rather problematic for elementary school children, as they are routinely exposed to CO2 concentrations ranging between about 1500 and 3000 ppm in their classrooms (Corsi et al., 2002).

Driving alone in one’s vehicle could mean exposure to “3700 ppm … above outdoor [CO2] concentrations” (Satish et al, 2012), or about 4100 ppm.

This elevated-CO2-is-toxic-to-brain-functioning paradigm suggests the world’s highways are teeming with cognitively-impaired drivers.

More ‘reactive’ land surfaces cooled the Earth down

by Charles the moderator , July 6, 2019 in WUWT


Higher reactivity could explain temperature drop before last ice age

GFZ GeoForschungsZentrum Potsdam, Helmholtz Centre

From time to time, there have been long periods of cooling in Earth’s history. Temperatures had already fallen for more than ten million years before the last ice age began about 2.5 million years ago. At that time the northern hemisphere was covered with massive ice masses and glaciers. A geoscientific paradigm, widespread for over twenty years, explains this cooling with the formation of the large mountain ranges such as the Andes, the Himalayas and the Alps. As a result, more rock weathering has taken place, the paradigm suggests. This in turn removed more carbon dioxide (CO2) from the atmosphere, so that the ‘greenhouse effect’ decreased and the atmosphere cooled. This and other processes eventually led to the ‘ice Age’.

In a new study, Jeremy Caves-Rugenstein from ETH Zurich, Dan Ibarra from Stanford University and Friedhelm von Blanckenburg from the GFZ German Research Centre for Geosciences in Potsdam were able to show that this paradigm cannot be upheld. According to the paper, weathering was constant over the period under consideration. Instead, increased ‘reactivity’ of the land surface has led to a decrease in CO2 in the atmosphere, thus cooling the Earth. The researchers published the results in the journal Nature.

New Paper: Mammals Thrived and Diversified With ~2000-4000 ppm CO2, 20°C Warmer Oceans Than Today

by K. Richard, July 1, 2019 in NoTricksZone


Marine species evolved, thrived, and diversified in 35 to 40°C ocean temperatures and CO2 concentrations “5-10x higher than present-day values” (Voosen, 2019 and Henkes et al., 2018).

Image Source: Voosen, 2019

I. The insignificance of modern “global warming”

Today’s ocean temperatures average about 16°C. CO2 levels hover around 400 parts per million (0.04%).

The oceans have warmed at a rate of just 0.015°C per decade since 1971 in the 0-700 m layer according to the IPCC (2013). This warming rate isn’t detectable when considering overall long-term changes in this layer (Rosenthal et al., 2017) during the Holocene.

Plate tectonics may have driven ‘Cambrian Explosion’

by University of Exeter, June 19, 2019 in ScienceDaily/from Nature


A team of scientists have given a fresh insight into what may have driven the “Cambrian Explosion” — a period of rapid expansion of different forms of animal life that occurred over 500 million years ago.

While a number of theories have been put forward to explain this landmark period, the most credible is that it was fuelled by a significant rise in oxygen levels which allowed a wide variety of animals to thrive.

The new study suggests that such a rise in oxygen levels was the result of extraordinary changes in global plate tectonics.

During the formation of the supercontinent ‘Gondwana’, there was a major increase in continental arc volcanism — chains of volcanoes often thousands of miles long formed where continental and oceanic tectonic plates collided. This in turn led to increased ‘degassing’ of CO2 from ancient, subducted sedimentary rocks.

This, the team calculated, led to an increase in atmospheric CO2and warming of the planet, which in turn amplified the weathering of continental rocks, which supplied the nutrient phosphorus to the ocean to drive photosynthesis and oxygen production.

Earth system models underestimate carbon fixation by plants in the high latitudes

by From Nature Communications, June 18 in WUWT


Abstract

Most Earth system models agree that land will continue to store carbon due to the physiological effects of rising CO2 concentration and climatic changes favoring plant growth in temperature-limited regions. But they largely disagree on the amount of carbon uptake. The historical CO2 increase has resulted in enhanced photosynthetic carbon fixation (Gross Primary Production, GPP), as can be evidenced from atmospheric CO2 concentration and satellite leaf area index measurements. Here, we use leaf area sensitivity to ambient COfrom the past 36 years of satellite measurements to obtain an Emergent Constraint (EC) estimate of GPP enhancement in the northern high latitudes at two-times the pre-industrial CO2 concentration (3.4 ± 0.2 Pg C yr−1). We derive three independent comparable estimates from CO2 measurements and atmospheric inversions. Our EC estimate is 60% larger than the conventionally used multi-model average (44% higher at the global scale). This suggests that most models largely underestimate photosynthetic carbon fixation and therefore likely overestimate future atmospheric CO2 abundance and ensuing climate change, though not proportionately.

CO2, GLOBAL WARMING, CLIMATE AND ENERGY

by Allan M.R. MacRae, B.A.Sc., M.Eng., P.Eng., June 2019 in WUWT


ABSTRACT

Global warming alarmism, which falsely assumes that increasing atmospheric CO2 causes catastrophic global warming, is disproved – essentially, it assumes that the future is causing the past. In reality, atmospheric CO2 changes lag global temperature changes at all measured time scales.

Nino34 Area Sea Surface Temperature changes, then tropical humidity changes, then atmospheric temperature changes, then CO2 changes.

The velocity dCO2/dt changes ~contemporaneously with global temperature changes and CO2 changes occur ~9 months later (MacRae 2008).

The process that causes the ~9-month average lag of CO2 changes after temperature changes is hypothesized and supported by observations.

The ~9-month lag, +/- several months, averages 1/4 of the full-period duration of the variable global temperature cycle, which averages ~3 years.

Based on the above observations, global temperatures drive atmospheric CO2 concentrations much more than CO2 drives temperature.

Climate sensitivity to increasing atmospheric CO2 must be very low, less than ~1C/(2*CO2) and probably much less.

There will be no catastrophic warming and no significant increase in chaotic weather due to increasing CO2 concentrations.

Increasing atmospheric CO2 clearly causes significantly improved crop yields, and may cause minor, beneficial global warming.

Atmospheric CO2 is not alarmingly high, it is too low for optimal plant growth and alarmingly low for the survival of carbon-based terrestrial life.

Other factors such as fossil fuel combustion, deforestation, etc may also increase atmospheric CO2. The increase of CO2 is clearly beneficial.

“Green energy” schemes are not green and produce little useful (dispatchable) energy, primarily because of the fatal flaw of intermittency.

There is no widely-available, cost-effective means of solving the flaw of intermittency in grid-connected wind and solar power generation.

Electric grids have been destabilized, electricity costs have soared and Excess Winter Deaths have increased due to green energy schemes.

HYPOTHESIS AND CONCLUSIONS

Fig.1a – The very close relationship of dCO2/dt (red) vs global temperature (blue) is clearly apparent. Major volcanoes disrupt the relationship.

La croissance du CO2 dans l’atmosphère est-elle exclusivement anthropique? (1/2) et Effet Suess

by J.C. Maurin, 13 juin 2019 in ScienceClimatEnergie


Une croissance du COatmosphérique qui serait exclusivement anthropique est contradictoire avec les observations du carbone 13 dans l’atmosphère (ici). Cet article en 2 parties va montrer qu’il existe également des contradictions avec les observations du carbone 14. Celui-ci  est utilisé à des fins de datation jusqu’à 50 000 ans BP  (Before Present)et on dispose de nombreuses études (pour calibration) sur son évolution dans l’atmosphère.  


La première partie s’intéresse, non pas aux datations, mais à la dilution du carbone 14 que provoque l’ajout de COanthropique (effet SUESS)  avant les essais thermonucléaires de 1952-1963.
Dans la seconde partie nous verrons que l’évolution du carbone 14 après 1963 est aussi en contradiction avec une croissance du COexclusivement anthropique.

1. Le carbone dans l’atmosphère [1] [5]

Le carbone existe habituellement sous 3 formes isotopiques : 12C pour ≈ 98.9% , 13C pour ≈ 1.1 % et 14C à l’état de traces (Fig. 1a).

Figure 1a.  La seule différence entre COanthropique et COatmosphérique réside dans les proportions du mélange des isotopes: le COanthropique est appauvri en 13C et 14C.  L’ajout de COanthropique va modifier, au fil des années, les proportions du mélange isotopique dans l’atmosphère.

The challenge of re-using the CO2

by Prof. Samuele Furfari, June 7, 2019 in ScienceClimatEnergie


In its Special Report n° 15 “Global warming of 1.5°C” (SR15) [1], IPCC proposes four scenarios  to limit Earth temperature increase to 1.5°C. In all  scenarios COemissions are kept at virtually zero by 2050. These scenarios are based on the technology called Carbon Dioxide Removal (CDR) that will remove COto compensate COanthropic emissions.

All pathways that limit global warming to 1.5°C with limited or no overshoot project the use of carbon dioxide removal (CDR) on the order of 100–1000 Gt CO2  over the 21st century. CDR would be used to compensate for residual emissions and, in most cases, achieve net negative emissions to return global warming to 1.5°C following a peak (high confidence). CDR deployment of several hundreds of Gt COis subject to multiple feasibility and sustainability constraints (high confidence). Significant near-term emissions reductions and measures to lower energy and land demand can limit CDR deployment to a few hundred Gt COwithout reliance on bioenergy with carbon capture and storage (BECCS) (high confidence)” (page 19).

   IPCC defines   Carbon dioxide removal (CDR)” as follows : Anthropogenic activities removing CO2  from the atmosphere and durably storing it in geological, terrestrial, or ocean reservoirs, or in products. It includes existing and potential anthropogenic enhancement of biological or geochemical sinks and direct air capture and storage but excludes natural COuptake not directly caused by human activities” (page 26).

The fourth scenario recognizes the logical and inevitable increase of COemissions if the world  continues its growth to remove poverty and allow Asia and Africa countries to develop. Therefore, this scenario is based on a massive use of the CDR techniques as the report says: “Emissions reductions are mainly achieved through technological means, making strong use of CDR“.

   Indeed, CDR is just rebranding of the CCS concept that is a cul-de-sac technology for a lack of economy, a lack of available adapted geological sinks on the production sites and also a lack of population acceptance.

How deep-ocean vents fuel massive phytoplankton blooms

by Stanford’s School of Earth, Energy & Environmental Sciences, June 5, 2019 in WUWT


More “settled science” of the carbon cycle~ctm

Stanford study shows how hydrothermal vents fuel massive phytoplankton blooms — and possible hotspots for carbon storage

Researchers at Stanford University say they have found an aquatic highway that lets nutrients from Earth’s belly sweep up to surface waters off the coast of Antarctica and stimulate explosive growth of microscopic ocean algae.

Their study, published June 5 in the journal Nature Communications, suggests that hydrothermal vents – openings in the seafloor that gush scorching hot streams of mineral-rich fluid – may affect life near the ocean’s surface and the global carbon cycle more than previously thought.

Mathieu Ardyna, a postdoctoral scholar and the study’s lead author, said the research provides the first observed evidence of iron from the Southern Ocean’s depths turning normally anemic surface waters into hotspots for phytoplankton – the tiny algae that sustain the marine food web, pull heat-trapping carbon dioxide out of the air and produce a huge amount of the oxygen we breathe. “Our study shows that iron from hydrothermal vents can well up, travel across hundreds of miles of open ocean and allow phytoplankton to thrive in some very unexpected places,” he said.

Kevin Arrigo, a professor of Earth system science and senior author of the paper, called the findings “important because they show how intimately linked the deep ocean and surface ocean can be.”

Tertiary hyperthermal events: precursors of the current situation?

by A. Jacobs & A. Préat, May 20, 2019 in SSRN.Elsevier


The focus of this study is based on a detailed analysis of the hyperthermal events of the

Paleocene / Eocene limit of 56 Ma and the lower Eocene (for the 54-52 Ma interval, Figure 1).

This example will show that the Earth has experienced many times much higher temperatures

than today, with warmer, sometimes more acidic oceans and an atmosphere much richer in CO2

(or CH4) than the current one. Are these past events precursors of the current situation?

Keywords: global warming, climate change, Paleocene, Eocene, hyperthermal events