Archives par mot-clé : CO2

WHY CARBON DIOXIDE CAN’T CAUSE WARMING IN THE ATMOSPHERE, BY PROFESSOR EMERITUS OF GEOLOGY AT WESTERN WASHINGTON UNIVERSITY

by Cap Allon, July 5, 2020 in Electroverse


ABSTRACT

A greenhouse gas is a gas that absorbs and emits infrared radiation.

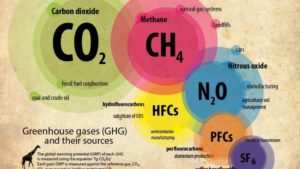
The primary greenhouse gases in the atmosphere are water vapor, carbon dioxide, methane, nitrous oxide, and ozone. Atmospheric carbon dioxide (CO2) is a nontoxic, colorless, odorless gas.

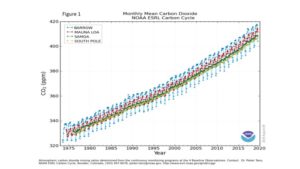
Water vapor accounts for by far the largest greenhouse effect (90–85%) because water vapor emits and absorbs infrared radiation at many more wavelengths than any of the other greenhouse gases, and there is much more water vapor in the atmosphere than any of the other greenhouse gases. CO2 makes up only a tiny portion of the atmosphere (0.040%) and constitutes only 3.6% of the greenhouse effect. The atmospheric content of CO2 has increased only 0.008% since emissions began to soar after 1945. Such a tiny increment of increase in CO2 cannot cause the 10°F increase in temperature predicted by CO2 advocates.

Computer climate modelers build into their models a high water vapor component, which they claim is due to increased atmospheric water vapor caused by very small warming from CO2, and since water vapor makes up 90–95% of the greenhouse effect, they claim the result will be warming.

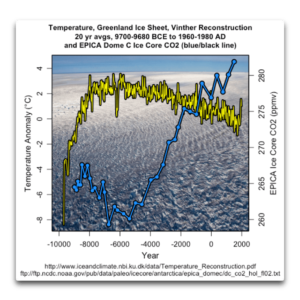
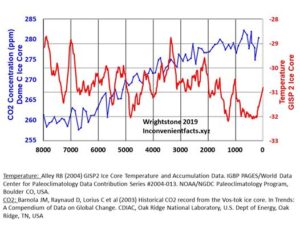
The problem is that atmospheric water vapor has actually declined since 1948, not increased as demanded by climate models. If CO2 causes global warming, then CO2 should always precede warming when the Earth’s climate warms up after an ice age. However, in all cases, CO2 lags warming by ∼800 years. Shorter time spans show the same thing–warming always precedes an increase in CO2 and therefore it cannot be the cause of the warming.

CO2 Not A Threat To Oceans

by Dr. J. Lehr, June 26, 2020 in ClimateChangDispatch


For the past three decades, the public has been taught by the news media and the folks who make a living composing mathematical equations they claim to simulate how our planet’s climate operates, that our oceans are in jeopardy.

They have all told you one of the biggest falsehoods in human history.

They say that carbon dioxide, the only reason man can inhabit Earth, is causing the planet to heat up to a dangerous level and the oceans will become unlivable for marine life.

There is no proof of these lies whatever. Civilization has generally been most prosperous under warmer than colder conditions.

The Ocean acidificationfrom carbon dioxide emissions preached by the scaremongers would require an impossible ten-fold decrease in the alkalinity of surface waters.

Even if atmospheric CO2 concentrations triple from todays four percent of one percent, which would take about 600 years, todays surface pH of 8.2 would plateau at 7.8, still well above neutral 7.

Ocean health has improved as a result of greater CO2, as it feeds phytoplankton that stimulates the ocean’s food chain.

CO2 allows phytoplankton such as algae, bacteria, and seaweed to feed the rest of the open ocean food chain. As carbon dioxide moves through this food web, much of it sinks or is transported away from the surface.

A high surface pH allows the ocean to store 50 times more CO2 than the atmosphere. Digestion of carbon at lower depths allows for storage there for centuries.

MIT’s Dr. Lindzen Pokes Fun At The ‘Naïve’, Well-Funded ‘Scientific Reasoning’ That 1 Factor – CO2 – Controls Climate

by Prof. Dr.  Lindzen, June 15, 2020 in NoTricksZone_K. Richard


In a new paper, atmospheric physicist Dr. Richard Lindzen summarizes the “implausible” claims today’s proponents of dangerous anthropogenic global warming espouse.

Dr. Richard Lindzen retired several years ago, and yet his immense contribution to the atmospheric sciences lives on. His research is still cited about 600 times per year.

Lindzen recently published another scientific paper (Lindzen, 2020) in The European Physical Journal criticizing the current alarmism in climate science.  Here are a few of the highlights.

1. Doubling the atmospheric CO2 concentration from 280 ppm to 560 ppm results in just a 1-2% perturbation to the Earth’s 240 W/m² energy budget. This doubled-CO2 effect has less than 1/5th of the impact that the net cloud effect has. And yet we are asked to accept the “implausible” claim that change in one variable, CO2, is predominatly responsible for altering global temperatures.

2. A causal role for CO2 “cannot be claimed” for the glacial-to-interglacial warming events because CO2 variations follow rather than lead the temperature changes in paleoclimate records and the 100 ppm total increase over thousands of years produce “about 1 W/m²” of total radiative impact.

3. Climate science didn’t used to be alarmist prior to the late 1980s. Scientists were instead sufficiently skeptical about claims of climatically-induced planetary doom. That changed during the years 1988-1994, when climate research centered on CO2 and global warming received a 15-fold increase in funding in the US alone. Suddenly there was a great financial incentive to propel alarming global warming scenarios.

4. Concepts like “polar amplification” are “imaginary”.

“The change in equator-to-pole temperature difference was attributed to some imaginary ‘polar amplification,’ whereby the equator-pole temperature automatically followed the mean temperature. Although the analogy is hardly exact, this is not so different from assuming that flow in a pipe depends on the mean pressure rather than the pressure gradient.”

Study: Ancient ocean oxygen levels associated with changing atmospheric carbon dioxide


by Texas A&M University, May 24, 2020 in WUWT


A Texas A&M-led study analyzed ocean floor sediment cores to provide new insights into the relationship between deep ocean oxygenation and atmospheric carbon dioxide levels in the 50,000 years before the last ice age

IMAGE: Deep ocean floor sediment cores hold chemical clues to Earth’s past. view more  Credit: Texas A&M University

Why do carbon dioxide levels in the atmosphere wax and wane in conjunction with the warm and cold periods of Earth’s past? Scientists have been trying to answer this question for many years, and thanks to chemical clues left in sediment cores extracted from deep in the ocean floor, they are starting to put together the pieces of that puzzle.

Recent research suggests that there was enhanced storage of respired carbon in the deep ocean when levels of atmospheric carbon dioxide concentrations were lower than today’s levels. But new research led by a Texas A&M University scientist has reached back even further, for the first time revealing insights into atmospheric carbon dioxide levels in the 50,000 years before the last ice age.

Climate Change – Ebb and Flow of the Tide –Part 2 of 3

by Dr K. Kemm, April 16, 2020 in WUWT


The topic of global warming and climate change is far more scientifically complex than the public is led to believe.

Myriads of newspaper, magazine and TV items over decades have tended to simplify the science to the point at which the general public believes that it is all so simple that any fool can see what is happening. Public groups often accuse world leaders and scientists of being fools, if they do not instantly act on simple messages projected by individuals or public groups.

One often hears phrases like: ‘The science is settled.’ It is not. Even more worrying is that the reality of the correct science is actually very different to much of the simple public perception.

An additional complicating factor is that there are political groupings wanting to change the world social order and who are using the climate change issue as a vehicle to achieve these objectives. They want the ‘science’ to say what they want it to say and are not interested in the truth. Sections of the public, with noble good intentions, then frequently do not realize that they are being induced by such elements to unwittingly support a political agenda, which in reality is unrelated to the climate issue.

I found myself in an informal social debate on these topics, with some people getting rather heated. Attempts to cool the conversation temperature were not so successful. The political aspects of the climate change issue, as always, entered into the discussion. Points like: ‘saving mankind from disaster’ were made with much emotion, and UN and various government political votes on the science were referred to, as if a political vote settled the scientific facts.

Sadly, so much of the climate debate is the result of votes and not of sound science, as determined by scientific methodology and protocol which has been developed over centuries.


Continuer la lecture de Climate Change – Ebb and Flow of the Tide –Part 2 of 3

Greenhouse Gases Not Behind The End Of The Warming Pause

by Dr A. Ollila, March 16, 2020 in ClimateChange Dispatch


During the years 2000-2014, the global temperature hardly increased, and that period has been called the temperature pause or hiatus.

The debate among the climate community has resulted in more than 200 research studies in some cases with opposite results about the reasons.

This amount of papers can be compared to the research studies of Earth’s energy balance and the greenhouse effect. I have found about 10 publications for both subjects.

During the years 2000-2014, the emissions of carbon dioxide were 126 gigatons carbon (GtC) being 31% of the total emission after 1750, but the greenhouse (GH) gases were not able to increase the temperature.

According to the IPCC, the temperature increase should have been 0.4°C from 2000 to 2014 (Ref. 1).

It looks like that the pause ended to the super El Nino 2015-2016 because the temperature has been thereafter about 0.2 °C above-the-pause average.

Research study about the pause and the ENSO

The impulse for my research study came from a story figure on WUWT that showed shortwave (SW) radiation variations during the pause.

A curve showed increased values around El Nino 2015-16 and thereafter. I decided to find out what could be the impact of this finding on the temperatures.

In Fig. 1, I have depicted the total solar irradiance (TSI), SW radiation and LW radiation from 2000 onward. This data is available from the CERES databank maintained by NASA.

Fig.1. TSI, SW radiation and LW radiation trends normalized to the altitude of 20 kilometers.

The List Grows – Now 100+ Scientific Papers Assert CO2 Has A Minuscule Effect On The Climate

by K. Richard, December 12, 2019 in NoTricksZone


Within the last few years, over 50 papers have been added to our compilation of scientific studies that find the climate’s sensitivity to doubled CO2 (280 ppm to 560 ppm) ranges from <0 to 1°C. When no quantification is provided, words like “negligible” are used to describe CO2’s effect on the climate. The list has now reached 106 scientific papers.

Link: 100+ Scientific Papers – Low CO2 Climate Sensitivity

A few of the papers published in 2019 are provided below.

Krainov and Smirnov, 2019  (2X CO2 = 0.4°C, 2X anthroCO2 = 0.02°C)

“The greenhouse phenomenon in the atmosphere that results from emission of its molecules and particles in the infrared spectrum range is determined by atmospheric water in the form of molecules and microdrops and by carbon dioxide molecules for the Earth atmosphere and by carbon dioxide molecules and dust for the Venus atmosphere. The line-by-line method used the frequency dependent radiative temperature for atmospheric air with a large optical thickness in the infrared spectral range, allows one to separate emission of various components in atmospheric emission. This method demonstrates that the removal of carbon dioxide from the Earth’s atmosphere leads to a decrease of the average temperature of the Earth’s surface by 4 K; however, doubling of the carbon dioxide amount causes an increase of the Earth’s temperature by 0.4 K from the total 2 K at CO2 doubling in the real atmosphere, as it follows from the NASA measurements. The contribution to this temperature change due to injections of carbon dioxide in the atmosphere due to combustion of fossil fuel, and it is 0.02 K. The infrared radiative flux to the Venus surface due to   CO2 is about 30% of the total flux, and the other part is determined by a dust.”

NASA satellite offers urban carbon dioxide insights

by University of Utah, March 8, 2020 in WUWT


CO2 measurements from OCO-2 in parts per million over Las Vegas on Feb. 8, 2018. Credit: Dien Wu/University of Utah

A new NASA/university study of carbon dioxide emissions for 20 major cities around the world provides the first direct, satellite-based evidence that as a city’s population density increases, the carbon dioxide it emits per person declines, with some notable exceptions. The study also demonstrates how satellite measurements of this powerful greenhouse gas can give fast-growing cities new tools to track carbon dioxide emissions and assess the impact of policy changes and infrastructure improvements on their energy efficiency.

Cities account for more than 70% of global carbon dioxide emissions associated with energy production, and rapid, ongoing urbanization is increasing their number and size. But some densely populated cities emit more carbon dioxide per capita than others.

To better understand why, atmospheric scientists Dien Wu and John Lin of the University of Utah in Salt Lake City teamed with colleagues at NASA’s Goddard Space Flight Center in Greenbelt, Maryland and the University of Michigan in Ann Arbor. They calculated per capita carbon dioxide emissions for 20 urban areas on several continents using recently available carbon dioxide estimates from NASA’s Orbiting Carbon Observatory-2 (OCO-2) satellite, managed by the agency’s Jet Propulsion Laboratory in Pasadena, California. Cities spanning a range of population densities were selected based on the quality and quantity of OCO-2 data available for them. Cities with minimal vegetation were preferred because plants can absorb and emit carbon dioxide, complicating the interpretation of the measurements. Two U.S. cities were included–Las Vegas and Phoenix.

Continuer la lecture de NASA satellite offers urban carbon dioxide insights

Nature Has Been Removing Excess CO2 4X Faster than IPCC Models

by Dr. Roy Spencer, February 5, 2020 in WUWT


Note: What I present below is scarcely believable to me. I have looked for an error in my analysis, but cannot find one. Nevertheless, extraordinary claims require extraordinary evidence, so let the following be an introduction to a potential issue with current carbon cycle models that might well be easily resolved by others with more experience and insight than I possess.

Summary

Sixty years of Mauna Loa CO2 data compared to yearly estimates of anthropogenic CO2 emissions shows that Mother Nature has been removing 2.3%/year of the “anthropogenic excess” of atmospheric CO2 above a baseline of 295 ppm. When similar calculations are done for the RCP (Representative Concentration Pathway) projections of anthropogenic emissons and CO2 concentrations it is found that the carbon cycle models those projections are based upon remove excess CO2 at only 1/4th the observed rate. If these results are anywhere near accurate, the future RCP projections of CO2, as well as the resulting climate model projection of resulting warming, are probably biased high.


Introduction

My previous post from a few days ago showed the performance of a simple CO2 budget model that, when forced with estimates of yearly anthropogenic emissions, very closely matches the yearly average Mauna Loa CO2 observations during 1959-2019. I assume that a comparable level of agreement is a necessary condition of any model that is relied upon to predict future levels of atmospheric CO2 if it is have any hope of making useful predictions of climate change.

In that post I forced the model with EIA projections of future emissions (0.6%/yr growth until 2050) and compared it to the RCP (Representative Concentration Pathway) scenarios used for forcing the IPCC climate models. I concluded that we might never reach a doubling of atmospheric CO2 (2XCO2).

But what I did not address was the relative influence on those results of (1) assumed future anthropogenic CO2 emissions versus (2) how fast nature removes excess CO2 from the atmosphere. Most critiques of the RCP scenarios address the former, but not the latter. Both are needed to produce an RCP scenario.

I implied that the RCP scenarios from models did not remove CO2 fast enough, but I did not actually demonstrate it. That is the subject of this short article.

What Should the Atmospheric CO2 Removal Rate be Compared To?

Continuer la lecture de Nature Has Been Removing Excess CO2 4X Faster than IPCC Models

Fungal decisions can affect climate

by American Society of Agronomy, January 31, 2020 in WUWT


But fungi don’t just release carbon. They can also store it. For example, environmental stress can cause fungi to strengthen their cell walls. They do so by using organic compounds that contain carbon. These carbon compounds can stay in soils for years to decades or even longer.

“We found that where drought stress increased, the amount of fungi that invested more in strengthening cell walls and less in decomposition tended to increase,” says Treseder. In contrast, in more moderate conditions, the reverse occurred. Fungi that decomposed more efficiently became more common.

These findings suggest that fungi might store more carbon as global climate becomes more extreme. On the other hand, they might release more carbon dioxide in moderate climates. “These opposing feedbacks would not have been apparent without examining trade-offs among fungal traits,” says Treseder.

The Solution To Dissolution

by Willis Eschenbach, January 31, 2020 in WUWT


The British tabloid “The Guardian” has a new scare story about what is wrongly called “ocean acidification”. It opens as follows:


Pacific Ocean’s rising acidity causes Dungeness crabs’ shells to dissolve

Acidity is making shells of crab larvae more vulnerable to predators and limiting effectiveness in supporting muscle growth


The Pacific Ocean is becoming so acidic it is starting to dissolve the shells of a key species of crab, according to a new US study.


Sounds like the end of times, right? So let me start with a simple fact. The ocean is NOT acidic. Nor will it ever become acidic, except in a few isolated locations. It is alkaline, also called “basic”. The level of acidity/alkalinity is expressed on the “pH” scale, where neutral is 7.0, alkaline is from 7 to 14, and acidic is from 0 to 7.

Figure 1. The pH scale, running from the most acid at the bottom, through neutral in the middle, and up to the most alkaline at the top.

From the chart, the ocean has a pH of around 8 (although as we’ll see, that conceals great variation).


Over 440 Scientific Papers Published In 2019 Support A Skeptical Position On Climate Alarm

by K. Richard, January 30, 2020 in NoTricksZone


In 2019,  more than 440 scientific papers were published that cast doubt on the position that anthropogenic CO2 emissions function as the climate’s fundamental control knob…or that otherwise serve to question the efficacy of climate models or the related “consensus” positions commonly endorsed by policymakers and mainstream media sources.


DEEP DIVING SCIENTISTS DISCOVER “SODA SPRINGS” — AN UNDERWATER ENVIRONMENT WHERE HIGH CO2 CONCENTRATIONS (UP TO 95,000 PPM) BUBBLE-UP FROM THE OCEAN FLOOR

by Cap Allon, January 27, 2020 in Electroverse


University of Texas at Austin Professor, Bayani Cardenas, has discovered an underwater environment of bubbling carbon dioxide with readings some 200x the concentration of CO2 in the atmosphere.

Cardenas discovered the region –which he calls “Soda Springs”– while studying how groundwater from a nearby island could affect the ocean environment of the Verde Island Passage in the Philippines. The passage is one of the most diverse marine ecosystems in the world and is home to thriving coral reefs.

The amazing bubbling location, which Cardenas captured on video, is not a climate change nightmare, reads part of the press release issued by utexas.edu on Jan 22, 2020. It is instead linked to a nearby volcano that vents out the gases through cracks in the ocean floor, and has probably been doing so for decades or even millennia.

Continuer la lecture de DEEP DIVING SCIENTISTS DISCOVER “SODA SPRINGS” — AN UNDERWATER ENVIRONMENT WHERE HIGH CO2 CONCENTRATIONS (UP TO 95,000 PPM) BUBBLE-UP FROM THE OCEAN FLOOR

Gavin’s Falsifiable Science

by Willis Eschenbach, January 18, 2020 in WUWT


Folks are interested in why the temperature of the planet changes over time. That’s at the center of modern climate science. My theory, on the other hand, arose from my being interested in a totally different question about climate—why is the temperature so stable? For example, over the 20th Century, the temperature only varied by ± 0.3°C. In the giant heat engine that is the climate, which is constantly using solar energy to circulate the oceans and the atmosphere, this is a variation of 0.1% … as someone who has dealt with a variety of heat engines, I can tell you that this is amazing stability. The system is ruled by nothing more solid than waves, wind, and water. So my question wasn’t why the climate changes as it does.

My question was, why is the climate so stable?

And my answer is, there are a host of what are called “emergent phenomena” that arise when local temperatures go above some local threshold. They include the timing and strength of the daily emergence of the cumulus cloud field in the tropics; the development of thunderstorms; the emergence of dust devils when temperatures get hot; the action of the El Nino/La Nina pump moving warm water to the poles; and various “oscillations” like the Pacific Decadal Oscillation.

These emergent phenomena arise out of nowhere, last for some length of time, and then disappear completely. And acting together, they all work to prevent both the overcooling and the overheating of the planet. And as mentioned above, I say that these phenomena acted to reduce the length and the depth of the effect of the Pinatubo volcano. See my post called “When Eruptions Don’t” for another look at how the climate system responds to a decrease in incoming solar energy due to volcanic eruptions.


I originally published this theory in the journal Energy and Environment. I followed that up with a posting of the same ideas here at Watts Up With That in a post called The Thermostat Hypothesis.

Figure 2. Global stratospheric temperatures measured from space.

Carbon Sequestration

by Red Istvan, January 10, 2020 in WUWT


As most WUWT readers know, the issue of carbon sequestration is an important but largely IPCC undiscussed ‘anthropogenic global warming’ question. I got to thinking about it again as a result of the Australian brush fires that are dramatically releasing sequestered brush carbon. And it has been years since the topic was discussed in any depth here at WUWT, insofar as I know.

A cautionary note to WUWT readers. This guest post is a high level review, rather than a typically detailed and highly referenced analytic post on some paper. It is intended mainly to guide your own further research into a fairly complex subject by providing basic concepts and keywords.

Background

There is little doubt that combusting fossil fuel raises atmospheric CO2 in the ‘short term’ at some ‘rate’. This is provable several ways including C12/C13 isotope ratios governed by the differential photosynthetic uptake of the atomically lighter, therefore more ‘reactive’, C12. The experimental proof is simple: as fossil fuel combustion releases more photosynthetically sequestered C12, the residual atmospheric fraction of heavier (so less sequestered) C13 should decline. It does.

The relevant questions for global warming are the meanings of ‘rate’ and ‘short term’. We know the present rate from the Keeling Curve. That curve shows biological sink seasonality (mainly northern hemisphere terrestrial, because plants don’t grow in winter), and surprisingly slight acceleration—much less than the estimated rate of increase in gross CO2emissions from fossil fuel consumption. (Wiki has good illustrations and discussion.) This belies the ‘saturated sinks’ assumption in the Bern sequestration model because the simple gross/net comparison shows carbon sinks must be growing significantly.

We also know from that same Keeling curve that ‘short term’ is at least decades. But is it several centuries as all the IPCC AR5 climate models predict?

Different Carbon Sink Rates

.

Ocean acidification a big problem — but not for coral reef fish behavior

by Norwegian University of Science and Technology, Jan. 9, 2020 in WUWT


A three-year, comprehensive study of the effects of ocean acidification challenges previous reports that a more acidic ocean will negatively affect coral reef fish behaviour.

The study, conducted by an international coalition led by scientists from Australia and Norway, showed that coral reef fish exposed to CO2 at levels expected by the end of the century did not change their activity levels or ability to avoid predators.

“Contrary to previous studies, we have demonstrated that end-of-century CO2 levels have a negligible impact on the behaviour and sensory systems of coral reef fish,” said Timothy Clark, the lead author of the study and an associate professor at Deakin University in Australia.

Although this is good news on its own, ocean acidification and global warming remain a major problem for coral reefs, the researchers said. Ocean acidification is a problem for creatures that rely on calcium carbonate to make shells and skeletons, such as coral reef organisms, while higher ocean temperatures lead to coral bleaching and death.

..

Greenland Ice Core CO2 Concentrations Deserve Reconsideration

by Renee Hannon, January 7, 2020, in WUWT


Introduction
Ice cores datasets are important tools when reconstructing Earth’s paleoclimate. Antarctic ice core data are routinely used as proxies for past CO2 concentrations. This is because twenty years ago scientists theorized Greenland ice core CO2 data was unreliable since CO2trapped in air bubbles had potentially been altered by in-situ chemical reactions. As a result, Greenland CO2 datasets are not used in scientific studies to understand Northern and Southern hemispheres interactions and sensitivity of greenhouse gases under various climatic conditions.

This theory was put forward because Greenland CO2 data were more variable and different than Antarctic CO2 measurements located in the opposite polar region about 11,000 miles away. This article re-examines Greenland ice cores to see if they do indeed contain useful CO2 data. The theory of in-situ chemical reactions to explain a surplus and deficit of CO2, relative to Antarctic data, will be shown to be tenuous. The Greenland CO2 data demonstrates a response to the Medieval Warm Period, Little Ice Age, Dansgaard-Oeschger and other past climate change events. This response to past climate changes offers an improved explanation for why Greenland and Antarctic CO2 measurements differ. Further, Greenland CO2 measurements show rapid increases of 100 ppm during warm events in relatively short periods of time.

Atmospheric CO2 is More Variable in Northern Latitudes

Figure 1, from NOAA, shows atmospheric CO2 concentrations measured from the continuous monitoring program at four key baseline stations spanning from the South Pole to Barrow, Alaska. CO2 has risen from about 330 ppm to over 400 ppm since 1975 and is increasing at approximately 1-2+ ppm/year. Many scientists believe that rapidly increasing CO2 is mostly due to fossil fuel emissions.

Figure 1. Atmospheric CO2 concentrations from NOAA

The Evidence Proves That CO2 is Not a Greenhouse Gas

by Tim Ball, September 13, 2018 in Technocracy.News


The Intergovernmental Panel on Climate Change (IPCC) claim of human-caused global warming (AGW) is built on the assumption that an increase in atmospheric CO2 causes an increase in global temperature. The IPCC claim is what science calls a theory, a hypothesis, or in simple English, a speculation.  Every theory is based on a set of assumptions. The standard scientific method is to challenge the theory by trying to disprove it. Karl Popper wrote about this approach in a 1963 article, Science as Falsification. Douglas Yates said,

“No scientific theory achieves public acceptance until it has been thoroughly discredited.”

Thomas Huxley made a similar observation.

“The improver of natural knowledge absolutely refuses to acknowledge authority, as such. For him, skepticism is the highest of duties; blind faith the one unpardonable sin.”

In other words, all scientists must be skeptics, which makes a mockery out of the charge that those who questioned AGW, were global warming skeptics. Michael Shermer provides a likely explanation for the effectiveness of the charge.

“Scientists are skeptics. It’s unfortunate that the word ‘skeptic’ has taken on other connotations in the culture involving nihilism and cynicism. Really, in its pure and original meaning, it’s just thoughtful inquiry.”

The scientific method was not used with the AGW theory. In fact, the exact opposite occurred, they tried to prove the theory. It is a treadmill guaranteed to make you misread, misrepresent, misuse and selectively choose data and evidence. This is precisely what the IPCC did and continued to do.

Scientists Document A DECLINE In Overall Greenhouse Effect Forcing From 1985-2014

by K. Richard, December 30, 2019 in NoTricksZone


CO2 concentrations rose from 345 ppm to 398 ppm in the 29 years from 1985 to 2014. Mainstream scientists sympathetic to the anthropogenic global warming (AGW) paradigm have nonetheless reported the overall greenhouse effect forcing has been flat to declining throughout this period.


1. Cess and Udelhofen, 2003  Due to the downward trend in cloud cover, absorbed shortwave radiation increased and the overall greenhouse effect’s forcing influence declined from 1985-1999. The authors consider these trends to be driven by natural variability.

2. Song et al., 2016The overall greenhouse effect went on “hiatus” from 1992-2014, with the combined forcing effects of water vapor, cloud, and CO2 declining by -0.04 W/m² per year (-0.4 W/m² per decade) during this interval. Again, the main reason for the declining greenhouse effect trend was the downward trend in cloud cover.

3. Kato et al., 2018   Downward longwave radiation (DLR), or the overall greenhouse effect, responds to variability in water vapor and cloud. CO2 isn’t mentioned in the paper as a factor influencing DLR. Total DLR was negative (-0.2 W/m²) during this decade, insinuating rising CO2 had no net warming climate impact. In contrast, downward shortwave forcing increased by +2.2 W/m² per decade from 1986-2000 and by +1.3 W/m² from 2005-2014. These positive shortwave absorption trends explain the warming during this period.

Blockbuster: Planetary temperature controls CO2 levels — not humans

by JoNova from Murry Salby, December 27, 2019


Over the last two years he has been looking at C12 and C13 ratios and CO2 levels around the world, and has come to the conclusion that man-made emissions have only a small effect on global CO2 levels. It’s not just that man-made emissions don’t control the climate, they don’t even control global CO2 levels.

Continuer la lecture de Blockbuster: Planetary temperature controls CO2 levels — not humans

Failed Serial Doomcasting

by Willis Eschenbach, December 27, 2019 in WUWT


People sometimes ask me why I don’t believe the endless climate/energy use predictions of impending doom and gloom for the year 2050 or 2100. The reason is, neither the climate models nor the energy use models are worth a bucket of warm spit for such predictions. Folks concentrate a lot on the obvious problems with the climate models. But the energy models are just as bad, and the climate models totally depend on the energy models for estimating future emissions. However, consider the following US Energy Information Agency (EIA) predictions of energy use from 2010, quoted from here (emphasis mine):

The only thing that seems clear about all of those questions is that the answer is not “CO2”. Here’s another look at Greenland, this time with CO2 overlaid on the temperature:

8000 Years Of Zero Correlation Between CO2 And Temperature, GISP 2 Ice Core Shows – Opposite Is True!

by P. Gosselin, December 20, 2019 in NoTricksZone


A plot of ice core data from Greenland reveals that CO2 does not drive temperatures.

At Facebook, Gregory Wrightstone posted a chart plotting atmospheric CO2 concentration reconstructed from  Dome C Ice Core versus temperature that was reconstructed from the GISP 2 Ice Core.

According to global warming scientists, there’s supposed to be tandem movement between the two magnitudes.

CO2, they say, drives global temperature.

But over the past 8000 years, the data show that temperature in reality has moved in the opposite direction of CO2 and thus of what climate alarmist scientists have told us.


If anything can be drawn from the plotted data, it is that there’s an inverse correlation: As CO2 rises, temperature drops. But of course there’s a lot more to it. CO2 is not that huge major climate driver that alarmists like having us believe it is.

The List Grows – Now 100+ Scientific Papers Assert CO2 Has A Minuscule Effect On The Climate

by K. Richard, December 12, 2019 in NoTricksZone


Within the last few years, over 50 papers have been added to our compilation of scientific studies that find the climate’s sensitivity to doubled CO2 (280 ppm to 560 ppm) ranges from <0 to 1°C. When no quantification is provided, words like “negligible” are used to describe CO2’s effect on the climate. The list has now reached 106 scientific papers.

Link: 100+ Scientific Papers – Low CO2 Climate Sensitivity

A few of the papers published in 2019 are provided below:

NEWLY PUBLISHED SCIENTIFIC PAPER TEARS GLOBAL WARMING AND THE IPCC TO SHREDS

by Cap Allon, December 11, 2019 in Electroverse


A scientific paper entitled “An Overview of Scientific Debate of Global Warming and Climate Change” has recently come out of the University of Karachi, Pakistan. The paper’s author, Prof. Shamshad Akhtar delves into earth’s natural temperature variations of the past 1000 years, and concludes that any modern warming trend has been hijacked by political & environmental agendas, and that the science (tackled below) has been long-ignored and at times deliberately manipulated.

The published paper –available in full HERE— sets out its intent:

Climate change is NOT a new phenomenon. The palaeo-climatic studies reveal that during the Pleistocene and Holocene periods several warm and cold periods occurred, resulting in changes of sea level and in climatic processes like the rise and fall of global average temperature and rainfall.