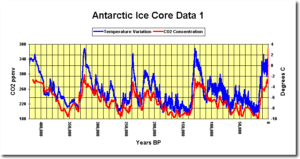
Climate scientists acknowledge that CO2 follows rather than leads temperature, but they insist that feedback loops drive the transitions from glacial to interglacial conditions.
by Chris Money, September 2, 2015 in TheWashingtonPost
In a blockbuster study released Wednesday in Nature, a team of 38 scientists finds that the planet is home to 3.04 trillion trees, blowing away the previously estimate of 400 billion. That means, the researchers say, that there are 422 trees for every person on Earth.
However, in no way do the researchers consider this good news. The study also finds that there are 46 percent fewer trees on Earth than there were before humans started the lengthy, but recently accelerating, process of deforestation.
“We can now say that there’s less trees than at any point in human civilization,” says Thomas Crowther, a postdoctoral researcher at the Yale School of Forestry and Environmental Studies who is the lead author on the research. “Since the spread of human influence, we’ve reduced the number almost by half, which is an astronomical thing.”
Over the years there has been a sustained effort to portray human exposure to very high levels of CO2 as toxic. A new study undercuts these claims, as the decision-making performances of controlled-experiment participants were not impaired when exposed to CO2 concentrations as high as 15,000 ppm.
Comments to the July 2018 global surface air temperature overview Temperature quality class 1: Lower troposphere temperature from satellites Temperature quality class 2: HadCRUT global surface air temperature Temperature quality class 3: GISS and NCDC global surface air temperature Comparing global surface air temperature and satellite-based temperatures Global air temperature linear trends
Global temperatures: All in one, Quality Class 1, 2 and 3
Global sea surface temperature
Ocean temperature in uppermost 100 m
North Atlantic heat content uppermost 700 m
North Atlantic temperatures 0-800 m depth along 59N, 30-0W
Global ocean temperature 0-1900 m depth summary
Global ocean net temperature change since 2004 at different depths
La Niña and El Niño episodes
Troposphere and stratosphere temperatures from satellites
Zonal lower troposphere temperatures from satellites
Arctic and Antarctic lower troposphere temperatures from satellites Temperature over land versus over oceans
Arctic and Antarctic surface air temperatures
Arctic and Antarctic sea ice
Sea level in general
Global sea level from satellite altimetry
Global sea level from tide gauges
Northern Hemisphere weekly and seasonal snow cover
Atmospheric specific humidity
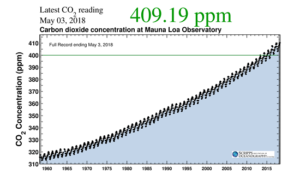
Atmospheric CO2
The phase relation between atmospheric CO2 and global temperature
Global air temperature and atmospheric CO2
Latest 20-year QC1 global monthly air temperature change
Sunspot activity and QC1 average satellite global air temperature
Climate and history: 1728: Vitus Bering and the non-discovery of Bering Strait
It’s well known that climate models show increasing sensitivity over time: for a given forcing, the true long-term temperature increase (ECS) is higher than what you’d estimate if you simply extrapolated from the past (ECS_hist). In other words, the ECS-to-ECS_hist ratio is above 1. This article tries to work out why climate models behave like that; that is to say, the variable I’m trying to explain is the ECS-to-ECS_hist ratio.
Now, there’s probably too many hyphens and underscores in the text. So it will be more readable if I clarify that, every time I talk simply about ‘correlation’, I mean the correlation of thing X with the ECS-to-ECS_hist ratio. If other kind of correlation is mentioned, I’ll say so explicitly.
Wood density of European trees decreasing continuously since 1870
Trees are growing more rapidly due to climate change. This sounds like good news. After all, this means that trees are storing more carbon dioxide from the atmosphere in their wood and hence taking away the key ingredient in global warming. But is it that simple? A team analyzed wood samples from the oldest existing experimental areas spanning a period of 150 years — and reached a surprising conclusion.
…
But the most important finding for practical and political aspects is that the current climate-relevant carbon sequestration of the forests is being overestimated as long as it is calculated with established but outdated wood densities. “The accelerated growth is still resulting in surplus carbon sequestration,” says Pretzsch. “But scaling up for the forests of central Europe, the traditional estimate would be to high by about ten million metric tons of carbon per year.”
Somebody said economists try to predict the tide by measuring one wave. This puts them in the same league as climate scientists trying to predict the climate by measuring one variable, CO2. It is no surprise that an amalgam of the two, climate and economics, produces even worse results, but that is what happened early in the anthropogenic global warming (AGW) deception.
Silica is needed by a group of marine algae (the microscopic plants of the oceans) called diatoms, who use it to build their glassy cell walls (known as frustules).
These plankton take up globally significant amounts of carbon — they remove carbon dioxide from the atmosphere via photosynthesis, and act as a natural carbon sink when they die and fall to the bottom of the ocean — and form the base of the marine food chain.
…
The researchers are also planning to use more complex and realistic computer models to delve deeper into the potential changes in the global silica cycle since the last glacial maximum. These might include more accurate representations of ocean currents, recycling of silica in the water column, and potential changes to the marine algal community.
De tous temps les hommes se sont intéressés au climat et ont tenté de prévoir son évolution. Dès l’Antiquité il était connu que des caractéristiques géographiques comme la latitude mais aussi l’altitude ou le voisinage de vastes étendues d’eau avaient une grande influence sur le climat. Sur cette base les climatologues ont été amenés à distinguer différents types de climats tels que tropical, désertique, tempéré, polaire, etc. Ensuite, il est progressivement apparu que le climat est un système extrêmement complexe qui dépend de l’activité solaire ainsi que de la distance et de l’orientation de la Terre par rapport au Soleil, facteurs qui varient à des échelles de temps très différentes.
by P. Homewood, August 7, 2018 in NotaLotofPeopleKnowThat
Climate change: ‘Hothouse Earth’ risks even if CO2 emissions slashed
It may sound like the title of a low budget sci-fi movie, but for planetary scientists, “Hothouse Earth” is a deadly serious concept.
Researchers believe we could soon cross a threshold leading to boiling hot temperatures and towering seas in the centuries to come.
Even if countries succeed in meeting their CO2 targets, we could still lurch on to this “irreversible pathway”.
Their study shows it could happen if global temperatures rise by 2C.
…
The utterly corrupt body of climate science has been getting ever more desperate to scare people about climate change and thereby submit to their radical anti capitalist agenda.
People are not falling for it, so we are now being subjected to ever more absurd announcements like this.
The upcoming 6th IPCC Sixth Assessment Report will be a “comprehensive assessment of the science” related to climate change and published in 2022. However, don’t expect it to be “comprehensive” at all as hundreds of scientific publications showing profound impacts by sun and oceans will go ignored.
Climate science has turned into a religion that centers on a single act of faith. Human CO2 is changing our climate.
In the past it was always understood that climate was impacted by a vast array of factors, such oceanic cycles, solar cycles, aerosols, cloud cover, etc. to name a few.
Deep in the ocean’s twilight zone, swarms of ravenous single-celled organisms may be altering Earth’s carbon cycle in ways scientists never expected, according to a new study from Florida State University researchers.
In the area 100 to 1,000 meters below the ocean’s surface — dubbed the twilight zone because of its largely impenetrable darkness — scientists found that tiny organisms called phaeodarians are consuming sinking, carbon-rich particles before they settle on the seabed, where they would otherwise be stored and sequestered from the atmosphere for millennia.
This discovery, researchers suggest, could indicate the need for a re-evaluation of how carbon circulates throughout the ocean, and a new appraisal of the role these microorganisms might play in Earth’s shifting climate.
The findings were published in the journal Limnology and Oceanography.
Unearthed new evidence (Mangerud and Svendsen, 2018) reveals that during the Early Holocene, when CO2 concentrations hovered around 260 ppm, “warmth-demanding species” were living in locations 1,000 km farther north of where they exist today in Arctic Svalbard, indicating that summer temperatures must have been about “6°C warmer than at present”.
Proxy evidence from two other new papers suggests Svalbard’s Hinlopen Strait may have reached about 5 – 9°C warmer than 1955-2012 during the Early Holocene (Bartels et al., 2018), and Greenland may have been “4.0 to 7.0 °C warmer than modern [1952-2014]” between 10,000 and 8,000 years ago according to evidence found in rock formations at the bottom of ancient lakes (McFarlin et al., 2018).
In these 3 new papers, none of the scientists connect the “pronounced” and “exceptional” Early Holocene warmth to CO2 concentrations.
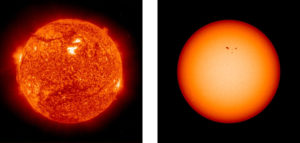
Henrik Svensmark, head of solar research at Denmark’s Technical University in Copenhagen, is one of them. And he ventures far ahead in the climate debate, the research with perhaps the greatest significance of our time. His research is contested, of course. Nevertheless, Svensmark and his critics agree that the topic “sun” deserves more attention in climate research. The participants are particularly interested in the complex interplay between our central star and ionizing emissaries from the depths of the galaxy – “cosmic radiation”.
Svensmark says: “The climate is influenced more by changes in cosmic radiation than by carbon dioxide”. CO2 has an effect, of course, “but it is far less than most current climate models assume, and also less than the influence of cosmic radiation”. In his opinion, a doubling of the greenhouse gas in the atmosphere would cause an increase in global temperature of at most one degree, and not two degrees, as is now generally accepted.
In other words, the “climate sensitivity” of carbon dioxide is only half as high as assumed (…)
From ARS Technica, one of the most incoherent things I’ve ever read…
…
The shocking thing is that Howard Lee has a degree in geology. The fact that he makes his living as an “Earth Science writer” and not as a geologist might just be relevant.
Can the Miocene tell our future? I’ll let Bubba’s mom answer that question:
Another reason the Paris Accord is collapsing is because it’s not going to do anything we were promised it would.
When it comes to coal, Vahrenholt notes, so far only Europe and Canada have expressed some sort of a commitment to exit coal, and then he reminds us China, India and all developing countries will still be permitted to continue “massively” expanding their use of coal. He writes : (…)
We covered this yesterday, but today the official press release came out, so worth covering again. Via Eurekalert
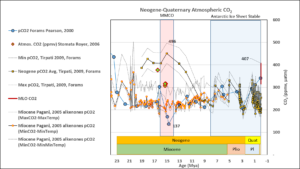
Land-based portion of massive East Antarctic ice sheet retreated little during past eight million years
But increases in atmospheric carbon dioxide levels could affect stability and potential for sea level rise
NATIONAL SCIENCE FOUNDATION
Large parts of the massive East Antarctic Ice Sheet did not retreat significantly during a time when atmospheric carbon dioxide concentrations were similar to today’s levels, according to a team of researchers funded by the National Science Foundation (NSF). The finding could have significant implications for global sea level rise.
The global increase in the atmosphere’s CO2 content has been hypothesized to possess the potential to harm coral reefs directly. By inducing changes in ocean water chemistry that can lead to reductions in the calcium carbonate saturation state of seawater (Ω), it has been predicted that elevated levels of atmospheric CO2 may reduce rates of coral calcification, possibly leading to slower-growing — and, therefore, weaker — coral skeletons, and in some cases even death.
In contrast, two new papers cite evidence that the timing of the lagged CO2 response to temperature changes may have ranged between 1300 and 6500 years in some cases. It would appear that a millennial-scale lagged response to temperature undermines the claim that CO2 concentration changes were a driver of climate in the ancient past.
We have mentioned countless times on this blog that the warming oceans are evidence that CO2 is not the cause of global warming. To understand the climate you must first understand the oceans. The oceans control the global climate. As the oceans warm, they warm and alter the humidity of the atmosphere above them. The problem is, as we have pointed out countless times, CO2’s only defined mechanism by which to affect climate change is through the thermalization of LWIR between 13 and 18µ.
LWIR between 13 and 18µ doesn’t penetrate or warm the oceans. Visible radiation, mainly from the high energy blue end of the spectrum does. CO2 is transparent to incoming visible radiation. The energy stored in the atmosphere and land is insignificant when compared to the oceans. The oceans contain 2,000x the energy of the atmosphere, so small changes to the oceans can mean big changes in the atmospheric temperature. The oceans also produce vast amounts of CO2 (20 x the amount man produces), and the most abundant and potent greenhouse gas, water vapor.
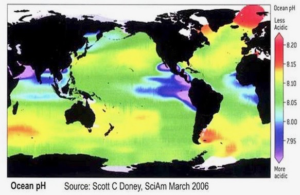
Voici quelques réflexions sur la théorie de l’acidification des océans. Selon cette théorie, le pH des océans diminuerait inlassablement, en raison du CO2 qui ne cesse de s’accumuler dans l’atmosphère.
• Les mesures directes de pH sont récentes et nous n’avons aucun recul. Selon les médias et les ONG écologistes, qui se basent sur le GIEC et sur certaines publications (e.g., Caldeira & Wickett 2003), le pH des océans aurait été de 8.25 en 1750. Cependant, il faut savoir que personne n’a jamais mesuré le pH des océans en 1750, puisque le concept de pH n’a été inventé qu’en 1909 (par le danois Søren P.L. Sørensen), et que les premiers appareils fiables pour mesurer le pH ne sont apparus qu’en 1924… Nous ne sommes donc pas certains de cette valeur de 8.25 pour 1750… La valeur de 8.25 est donc obtenue par des mesures indirectes et n’est donc pas certaine.
• A l’heure d’aujourd’hui, tous les pH sont possibles. Lorsqu’on dit que les océans actuels sont à un pH de 8.1, de quel océan parle-t-on? S’agit-il du pH moyen global? Si c’est de cela qu’on parle, quelle est l’incertitude sur la mesure? (i.e., l’écart-type?). Ceci n’est jamais indiqué. Il faut savoir que si l’on prend un jour de la semaine, tous les pH sont possibles dans les océans, comme l’illustre très bien la figure suivante.
When if comes to debunking Gorebal Warming, Chicken Little of the Sea (“ocean acidification”) and other Warmunist myths, my favorite starting points are my old college textbooks.
Way back in the Pleistocene (spring semester 1979) in Marine Science I, our professor, Robert Radulski, assigned us The Oceans by Sverdrup (yes, that Sverdrup), Johnson and Fleming. Even though it was published in 1942, it was (and may still be) considered the definitive oceanography textbook. I looked up “ocean acidification” in the index… It wasn’t there.
The notion that CO2 partial pressure influences the pH of seawater isn’t a new concept, *surely* ocean acidification must have been mentioned in at least one of my college textbooks.
Dr. Boris M. Smirnov, a prominent atomic physicist, has authored 20 physics textbooks during the last two decades. His latest scientific paper suggests that the traditional “absorption band” model for calculating the effect of atmospheric CO2 during the radiative transfer process is flawed. New calculations reveal that the climate’s sensitivity to a doubling of the CO2 concentration is just 0.4 K, and the human contribution to that value is a negligible 0.02 K.
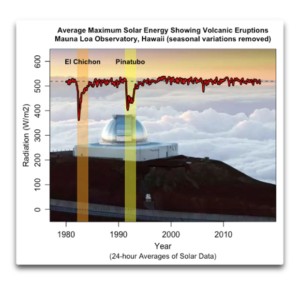
Inspired by Richard Keen’s interesting WUWT post on using eclipses to determine the clarity of the atmosphere, I went to the website of the Hawaiian Mauna Loa Observatory. They have some very fascinating datasets. One of them is a measurement of direct solar radiation, minute by minute, since about 1980.
I thought that I could use that dataset to determine the clarity of the atmosphere by looking at the maximum downwelling solar energy on a month by month basis. I’ve described my method of extracting the maximum solar energy from the minute by minute data in the appendix for those interested.