by P. Homewood, April 13, 2019 in NotaLotofPeopleKnowThat
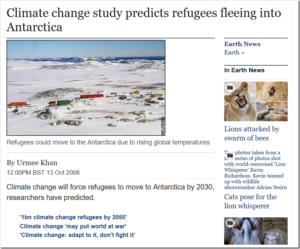
Climate change will force refugees to move to Antarctica by 2030, researchers have predicted.
Among future scenarios are the Olympics being held in cyberspace and central Australia being abandoned, according to the think tank report.
Forum for the Future, a research body committed to sustainable development, said they wanted to stir debate about how to avert the worst effects of global warming by presenting a radical set of ‘possible futures’.
There will be a shift towards greater energy efficiency, where desalination plants will run on solar power will turn the Sahara green.Refugees are expected to move to Antarctica because of the rising temperatures that will see the population of the continent increase to 3.5 million people by 2040.
As the world fails to act on climate change, researchers predict that global trade will collapse as oil prices break through $400 a barrel and electrical appliances will get automatically turned off when households exceed energy quotas.
…
…


 .
.