by P. Homewood, December 18, 2018 in NotaLotofPeopleKnowThat
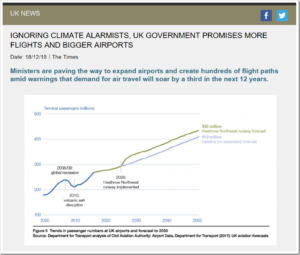
The Department for Transport publishes a long-awaited aviation strategy today that pledges to deliver “greater capacity at UK airports”.
It raises the prospect of airports other than Heathrow growing and accepting more flights if tough environmental and noise restrictions are met.
The strategy also outlines plans for the biggest overhaul of Britain’s airspace in more than 50 years to create new flight paths into the biggest airports. GPS-style technology will allow aircraft to fly along more accurate paths below 30,000ft instead of being led by ground beacons, which space planes out over a wide arc several miles across.
It will mean a considerable increase to the 600 or so dedicated flight paths that are in operation today
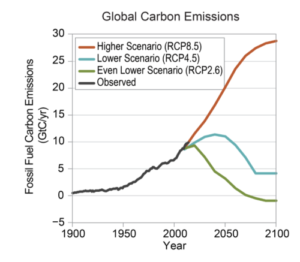
Jochem Marotzke, director of Germany’s Max Planck Institute for Meteorology (MPIM), wondered whether CO2 savings could really have a direct influence on the temperature in the near future. In a new paper (Marotzke 2018), the Hamburg-based climate researcher simulates the temperature profile of the 2030s predicted by climate models and uses once again a conventional emission profile (Scenario RCP 4.5), and once a politically reduced emission scenario.
Conclusion: Most likely, there would probably be no difference as natural climate variability prevails over these time scales. The paper was published in WIRE’s Climate Change and can be downloaded free of charge as a pdf:
Over the last 40 years global-mean surface air temperature – ‘global temperature’ for short – has gained an extraordinary role in the science, politics and public discourse of climate change. What was once a number crudely calculated through averaging together a few dozen reasonably well-spaced meteorological time series, has become reified as an objective entitythat simultaneously measures Earth System behaviour, reveals the future, regulates geopolitical negotiations and disciplines the human imagination. Apart perhaps from GDP rarely can so constructed an abstract entity have gained such power over the human world.
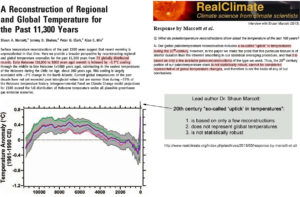
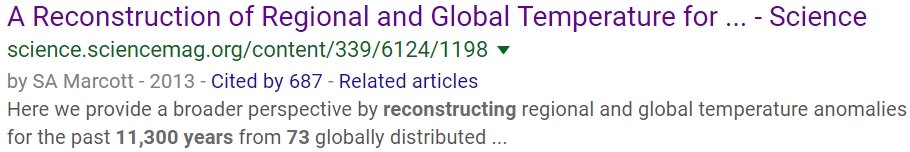
Almost immediately after it was introduced to the public, the lead author of Marcott et al. (2013) squelched the narrative that said the hockey-stick-shaped reconstruction he and his colleagues produced is a robust representation of modern global-scale temperature changes.
In an interview with Marcott published by RealClimate.org, it was acknowledged that the “uptick” does not represent a global-scale reconstruction, as it is based on only a few proxy records and lacks statistical significance.
…
Despite this admitted lack of supporting evidence for the 20th century’s “uptick”, the Marcott et al. (2013) “hockey stick”-shaped graph has nonetheless been unskeptically cited by other authors nearly 700 times.
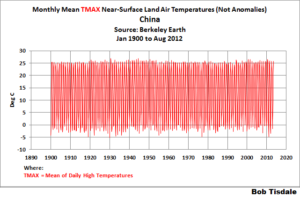
In this post, we’re going to present graphs that show the annual lowest TMIN and highest TMAX Near-Land Surface Air Temperatures (not in anomaly form) for ten (10) Countries in an effort to add some perspective to global warming. The list of countries, which follows, includes the countries with the highest populations.
And, as always with my posts, as part of the text, there are hyperlinks to the data that were used to prepare the graphs. Just click on the links if you’re looking for the data.
INITIAL NOTES
First of all, TMIN is described by Berkeley Earth as the “Mean of Daily Low Temperatures”, while TMAX is described as the “Mean of Daily High Temperatures”. Berkeley Earth provides monthly TMIN and TMAX data until partway through 2013. The start month for these individual-country datasets at Berkeley Earth depends on data availability from the individual country. Sometimes they start in the early 1800s, maybe even the mid-to-late 1700s for countries to be included in future posts (like the United Kingdom), and other times they start in the mid-to-late 1800s, so I’ve chosen 1900 as the start year for this post. The year 1900 is the end year of the IPCC’s new definition of “pre-industrial” times, so starting the graphs in 1900 is also appropriate in that respect.
Three minutes is not a lot of time, so let me be brief. I’ll start with something that might shock you. There is no evidence that CO2 has a large effect on climate. The two arguments used by the IPCC to so called “prove” that humans are the main cause of global warming, and which implies that climate sensitivity is high, are that: a) 20th century warming is unprecedented, and b) there is nothing else to explain the warming.
These arguments are faulty. Why you ask?
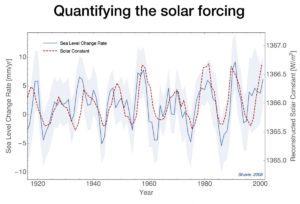
We know from the climate-gate e-mails that the hockey stick was an example of shady science. The medieval warm period and little ice ages were in fact global and real. And, although the IPCC will not admit so, we know that the sun has a large effect on climate, and on the 20th century warming in particular.
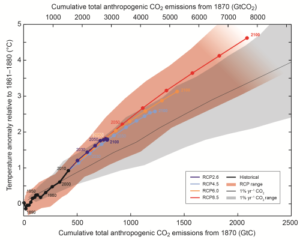
In the first slide we see one of the most important graphs that the IPCC is simply ignoring. Published already in 2008, you can see a very clear correlation between sea level change rate from tide gauges, and solar activity. This proves beyond any doubt that the sun has a large effect on climate. But it is ignored.
I was preparing a post using Berkeley Earth Near-Surface Land Air Temperature data that included the highest-annual TMAX temperatures (not anomalies) for China…you know, the country with the highest population here on our wonder-filled planet Earth. The graph was for the period of 1900 to 2012 (FYI, 2012 is the last full year of the local TMAX and TMIN data from Berkeley Earth). Berkeley Earth’s China data can be found here, with the China TMAX data here. For a more-detailed explanation, referring to Figure 1, I was extracting the highest peak values for every year of the TMAX Data for China, but I hadn’t yet plotted the graph in Figure 1, so I had no idea what I was about to see.
Figure 1 The results are presented in Figure 2, and they were a little surprising, to say the least.
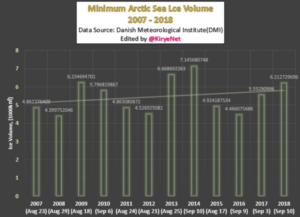
The media, alarmist scientists and many leading policymakers often tell the public “the Arctic is rapidly melting”. And if a poll were done today, a vast majority of the people in Japan and elsewhere would say this is true. Unfortunately they have become the victims of “fake news”.
Luckily we have some hard data from the Arctic. And if one looks at them, it is true that sea ice has seen a declining trend – if we go back 40 years.
Yet, if we look at the past 12 years, we see that the trend for minimum has stopped, and one could argue even reversed:
“The results of this review point to the extreme value of CO2 to all life forms, but no role of CO2 in any significant change of the Earth’s climate. … Many believe and/or support the notion that the Earth’s atmosphere is a ‘greenhouse’ with CO2 as the primary “greenhouse” gas warming Earth. That this concept seems acceptable is understandable—the modern heating of the Earth’s atmosphere began at the end of the Little Ice Age in 1850. The industrial revolution took hold about the same time. It would be natural to believe that these two events could be the reason for the rise in temperature. There is now a much clearer picture of an alternative reason for why the Earth’s surface temperature has risen since 1850.”
“There is no correlation of CO2 with temperature in any historical data set that was reviewed”.
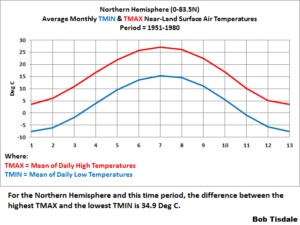
In this post, we’re going to present monthly TMIN and TMAX Near-Land Surface Air Temperature data for the Northern and Southern Hemispheres (not in anomaly form) in an effort to add a little perspective to global warming. And at the end of this post, I’m asking for your assistance in preparing a post especially for you, the visitors to this wonderful blog WattsUpWithThat.
INTRODUCTION FOR THE “GLOBAL WARMING IN PERSPECTIVE” SERIES
A small group of international unelected bureaucrats who serve the United Nations now wants to limit the rise of global land+ocean surface temperatures to no more 1.5 deg C from pre-industrial times…even though we’ve already seen about 1.0 deg C of global warming since then. So we’re going to put that 1.0 deg C change in global surface temperatures in perspective by examining the ranges of surface temperatures “we’ve been used to” on our lovely shared home Earth.
For the past 50 years, scientists have been studying climate change and the possibility of related sea level changes resulting from melting ice and warming oceans. Despite the common belief that increasing levels of carbon dioxide (CO2) in our atmosphere could result in catastrophic sea level rise, there is no evidence to support this fear. Tax monies spent trying to solve this non-existent problem are a complete waste.
The first International Polar Year, held over 1882–1883, was an important event for science. The year was the brainchild of Austrian explorer Karl Weyprecht who, after a few years on different research missions, realised that scientists were missing the big picture by not sharing information with each other.
In 1875, at the annual meeting of German Scientists and Physicians in Graz, Austria, he proposed the setting up of an observational network of research stations to monitor the Arctic climate. It was the beginning of collaborative research in the region. Today, data collected 134 years ago on temperature, air pressure, or wind speed is still freely available.
There have been two more International Polar Year events since that inaugural one, most recently in 2007–2008, along with numerous other collaborative expeditions and research missions aimed at understanding aspects of Arctic biology, ecology, climate or geology.
by J.C. Maurin, 2 décembre 2018 in ScienceClimatEnergie
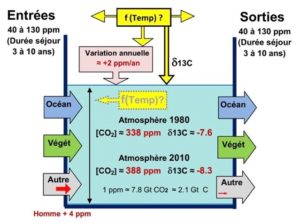
Au XVIe siècle, dans une ultime tentative pour sauver le système de Ptolémée, on se résigna enfin à admettre la rotation des planètes autour du Soleil mais on conserva le dogme de la position centrale de la Terre par rapport au Soleil. Le dernier pas vers l’héliocentrisme dut finalement être franchi, à regret. Au XXIesiècle, Le GIEC adapte discrètement son Almageste : on lit dans la version de novembre 2018 du Résumé à l’intention des décideurs dès la première page, 1er encadré de l’introduction → “L’augmentation mondiale de la concentration en dioxyde de carbone est essentiellement due à l’utilisation des combustibles fossiles et aux changements d’affectation des terres”. Fin de cette première page → « La source principale de l’augmentation de la concentration du dioxyde de carbone dans l’atmosphère depuis l’époque préindustrielle provient de l’utilisation des combustibles fossiles ». La certitude absolue, naguère affichée, d’une origine 100% anthropique dans la hausse du CO2atmosphérique disparaît donc. Un modèle mixte est désormais implicitement admis. A cinq siècles de distance, le dernier pas reste toujours difficile à franchir. Le présent article aide à trouver le chemin de Damas.
Figure 1. Rappels des observations (1/4) et corrélations (2/4)
More honesty and less hubris, more evidence and less dogmatism, would do a world of good
Dr. Jeffrey Foss
“What can I do to correct these crazy, super wrong errors?” Willie Soon asked plaintively in a recent e-chat. “What errors, Willie?” I asked.
“Errors in Total Solar Irradiance,” he replied. “The Intergovernmental Panel on Climate Change keeps using the wrong numbers! It’s making me feel sick to keep seeing this error. I keep telling them – but they keep ignoring their mistake.”
Astrophysicist Dr. Willie Soon really does get sick when he sees scientists veering off their mission: to discover the truth. I’ve seen his face flush with shock and shame for science when scientists cherry-pick data. It ruins his appetite – a real downer for someone who loves his food as much as Willie does.
Summary: Volume II of the Fourth National Climate Assessment (NCA) has dominated the news in the weeks since its release. One of the major findings that journalists headlined was the effect of climate change on the US economy. Ten percent is vivid number to grab the attention of Americans still skeptical after thirty years of dire warnings about climate change. Unfortunately it is a dubious story, as explained in these tweets by Roger Pielke Jr.
by P. Homewood, December 2, 2018 in NotaLotofPeopleKnowThat
The BBC have now stopped even trying to camouflage their bias on climate change, with this latest piece of propaganda:
…
Representatives from nearly 200 countries are gathering in Poland for talks on climate change – aimed at breathing new life into the Paris Agreement.
The UN has warned the 2015 Paris accord’s goal of limiting global warming to “well below 2C above pre-industrial levels” is in danger because major economies, including the US and the EU, are falling short of their pledges.
But scientists at the Intergovernmental Panel on Climate Change (IPCC) – the leading international body on global warming – last month argued the 2C Paris pledge didn’t go far enough. The global average temperature rise actually needed to be kept below 1.5C, they said.
So how warm has the world got and what can we do about it?
Draft of article to be submitted for journal publication.
Well, I hope you are not overdosing on the issue of sea level rise. But this paper is somewhat different, a philosophy of science paper. Sort of how we think about thinking.
I would appreciate any comments, as well as suggestions as to which journals I might submit to. I have two in mind, but am open to suggestions (and I may need backups).
Thanks in advance for your comments.
Sea level rise: What’s the worst case?
Abstract. The objective of this paper is to provide a broader framing for how we bound possible scenarios for 21st century sea level rise, in particular how we assess and reason about worst-case scenarios. This paper integrates climate science with broader perspectives from the fields of philosophy of science and risk management. Modal logic is used as a basis for describing construction of the scenario range, including modal inductivism and falsification. The logic of partial positions and strategies for speculating on black swan events associated with sea level rise are described. The rapidly advancing front of background knowledge is described in terms of how we extend partial positions and approach falsifying extreme scenarios of 21st century atmospheric CO2 concentrations, warming and sea level rise. The application of partial positions and worst-case scenarios in decision making strategies is described for examples having different sensitivities to Type I versus Type II errors.
by H. Schreuder, November 28, 2018 in ClimateChangeDipsatch
After decades of alarm calls over the impact of human emissions of carbon dioxide (CO2) on global temperatures and climate change, a glaring lack of factually demonstrated and scientifically proven evidence remains.
The evidence presented has been based on computer modeling of temperatures from global weather stations, a larger percentage of which are sited in towns and cities and no data, numerous studies show.
For the 70% of oceans, seas, and lakes, satellite measurements are routinely adjusted to take account of anomalies and sea level rise alarm, expressed in measurements of millimeters per century, does not quantify in that tidal gauges are subjected to landmass upheavals and/or subsidence, none of which can be taken to represent empirical evidence.See Also: New study shows coastlines gaining land despite sea level alarmism) …
This report reflects 18 months of work on this topic. Why have I devoted so much time to the sea level rise issue? First, I regard sea level rise to be the most consequential potential impact of predicted global warming. Second, there is a great deal of public confusion about the issue, including decision makers. Third, a number of CFAN’s clients have queried me about a range of specific concerns that they have regarding sea level rise (and I have been doing consulting on this topic).
Why do I think an independent assessment of the sea level rise issue by yours truly is needed, given the plethora of international and national assessment reports? My clients are concerned about the alarmist predictions they have encountered. I have seen various ‘experts’ make public statements projecting 21stcentury sea level to be as high as 9 m [30 feet]. My clients are looking for someone that they trust to provide an objective assessment that focuses on their issues of concern.
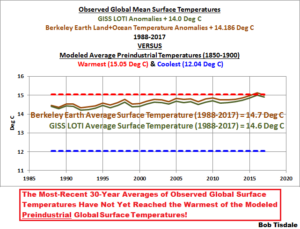
And What Have the Average Temperatures of Earth’s Surfaces Been Recently in Absolute Terms, Not Anomalies?
The answers may surprise you.
THIS POST HAS BEEN UPDATED. The update is near the end of the post.
…
So, for the purpose of this very simple illustration and comparison, and for the discussions it will generate, I’ve added 14 deg C to the annual GISS LOTI data available here, and added 14.186 deg C to the annual Berkeley Earth data. I also compared them to the 12.04 deg C to 15.05 deg C range of hindcast preindustrial global mean surface temperatures from the climate model ensemble members discussed earlier. See Figure 3. Not too surprisingly, the Berkeley Earth and GISS global mean surface temperatures, in absolute form, are very similar, with only a 0.1 deg C difference during the most recent 30-years.
Fossil fuels helped humanity improve our health, living standards and longevity in just 200 years.
…
Then, suddenly, a great miracle happened! Beginning around 1800, health, prosperity and life expectancy began to climb … slowly but inexorably at first, then more rapidly and dramatically. Today, the average American lives longer, healthier and better than even royalty did a mere century ago.
How did this happen? What was suddenly present that had been absent before, to cause this incredible transformation?
Humanity already possessed the basic scientific method (1250), printing press (1450), corporation (1600) and early steam engine (1770). So what inventions, discoveries and practices arrived after 1800, to propel us forward over this short time span?
A number of environmental groups in Canada and other countries have recently endorsed the “100% Clean and Renewable Wind, Water and Sunlight (WWS)” vision articulated in reports written by MarkJacobson, Mark Delucci and others. This vision seeks to eliminate the use of all fossil fuels (coal, oil and natural gas) in the world by 2050. Jacobson, Delucci et. al. have published “all-sector energy roadmaps”in which they purport to show how each of 139 countries could attain the WWS goal. The purpose of this paper is to examine whether the 100% goal is feasible.
While a range of renewable energy technologies (e.g. geothermal, hydroelectric, tidal, and wave energy) could play a role in the global transformation, the world foreseen in the WWS vision would be dominated by wind and solar energy. Of 53,535 gigawatts (GW) of new electrical energy generation sources to be built, onshore and offshore wind turbines would supply 19,000 GW (35.4%), solar photovoltaic (PV) plants would supply 17,100 GW (32%) and Concentrated Solar Power plants (CSP) would supply 14,700 GW (27.5%). This would cost $100 trillion, or $3,571 for every household on the planet.
Reflections on Nic Lewis’ audit of the Resplandy et al. paper.
In response to Nic Lewis’ two blog posts critiquing the Resplandy et al. paper on ocean temperatures, co-author Ralph Keeling acknowledges the paper’s errors with these statements:
…
Conclusions
By quickly admitting mistakes and giving credit where due, Ralph Keeling has done something unusual and laudatory in the field of climate science. If all climate scientists behaved this way, there would be no ‘hostile environment.’
I find it to be a sad state of affairs when a scientist admitting mistakes gets more kudos than the scientist actually finding the mistakes. But given the state of climate science, I guess finding mistakes seems to be a more common story than a publishing scientist actually admitting to mistakes.
Given the importance of auditing climate research and independent climate scientists working outside of institutional frameworks, I wish there was some way to encourage more of this. In the absence of recognition and funding, I don’t have much to suggest
La géologie, une science plus que passionnante … et diverse

