by Cap Allon, September 7, 2020 in Electroverse
Among the long list or scientific papers suggesting that a solar-driven spell of global cooling is on the cards, Dr Theodor Landscheidt’s ‘New Little ICE Age Instead of Global Warming?‘ probably has the claim of priority.
Published in 2003, just a year before his death, Landscheidt’s research is standing the test of time, and is still largely on course to be proved correct.
The paper’s abstract begins:
‘Analysis of the sun’s varying activity in the last two millennia indicates that contrary to the IPCC’s speculation about man-made global warming as high as 5.8C within the next hundred years, a long period of cool climate with its coldest phase around 2030 is to be expected.’
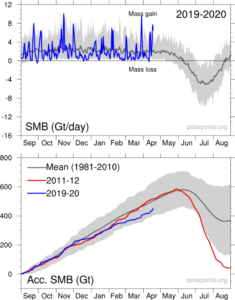
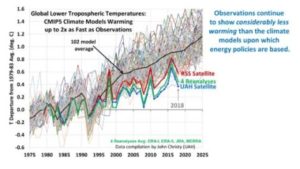
Crucially, in the growing list of research concluding that a solar-driven multidecadal spell of global cooling is on the cards (research from multiple studies of quite different characteristics), the year 2030 ALWAYS features prominently. Unlike the IPCC, which tosses its thermageddon doomsday date back and forth like a hot potato, researchers who track the multimillennial plays of the cosmos (namely those of the Sun) routinely land on the year 2030 as being the date of ‘climate deterioration’: this in itself should serve as compelling evidence.
Dr Landscheidt continues:
‘It is shown that minima in the 80 to 90-year Gleissberg cycle of solar activity, coinciding with periods of cool climate on Earth, are consistently linked to an 83-year cycle in the change of the rotary force driving the sun’s oscillatory motion … As the future course of this cycle and its amplitudes can be computed, it can be seen that the Gleissberg minimum around 2030 and another one around 2200 will be of the Maunder minimum type accompanied by severe cooling on Earth. This forecast should prove skillful as other long-range forecasts of climate phenomena, based on cycles in the sun’s orbital motion, have turned out correct as for instance the prediction of the last three El Niño years before the respective event.’
Dr Landscheidt concludes his introduction with the IPCC’s position on global warming, and he points to a growing list of publications showing a solar-climate connection:
…

