Archives par mot-clé : Model(s)

Climate Models, Clouds, OLR, and ECS

by A. May, Dec 17, 2024 in WUWT


The IPCC and the climate “consensus” believe that essentially all warming since 1750 is due to man’s emissions of CO2 and other greenhouse gases as shown in figure 1 here or in (IPCC, 2021, p. 961). This has led to a 45-year search for the value of the Equilibrium Climate Sensitivity to the doubling of CO2 (“ECS” in °C per 2xCO2). Yet, after spending 45 years trying to calculate the sensitivity of climate to man-made greenhouse gases, the “consensus” has been unable to narrow the uncertainty in their estimates and, if anything, the climate model uncertainty is now larger than in earlier reports(IPCC, 2021, p. 927). It is now clear, at least to me, that modern climate models make many critical assumptions that are poorly supported and sometimes conflict with observations. This is an attempt to explain some of these problems and how they developed over time. It is long past time for the “consensus” to stop ignoring the obvious weaknesses in their 60-year old conceptual model of climate.

The Early Models

Syukuro Manabe built the first general circulation climate model with several colleagues in the 1960s (Manabe & Bryan, 1969) and (Manabe & Wetherald, 1967). He started with a one-dimensional radiative equilibrium model of horizontally averaged temperature but realized that the troposphere was not in radiative equilibrium because of convection. The lower atmosphere is nearly opaque to most surface emitted infrared radiation or Outgoing Longwave Radiation (OLR) because of greenhouse gases. As a result, Earth’s surface is not cooled much by emitting radiation but instead mostly by the evaporation of surface water that carries surface heat into the atmosphere as latent heat inside water vapor. Water vapor is less dense than dry air, so it rises. Once the water vapor is high enough, it cools as the surrounding air pressure drops allowing air parcels to expand, causing the water vapor to condense which releases its latent heat. If this is done at a high enough altitude, some of the latent heat can make it to space as radiation or make it to surrounding greenhouse gas molecules higher in the atmosphere. The rest of the released heat simply warms the neighborhood. This process is called the “moist adiabat.”

Climate models can’t explain 2023’s huge heat anomaly — we could be in uncharted territory

by G. Schmidt, Mar 19, 2024 in Nature


Taking into account all known factors, the planet warmed 0.2 °C more last year than climate scientists expected. More and better data are urgently needed.

When I took over as the director of NASA’s Goddard Institute for Space Studies, I inherited a project that tracks temperature changes since 1880. Using this trove of data, I’ve made climate predictions at the start of every year since 2016. It’s humbling, and a bit worrying, to admit that no year has confounded climate scientists’ predictive capabilities more than 2023 has.

For the past nine months, mean land and sea surface temperatures have overshot previous records each month by up to 0.2 °C — a huge margin at the planetary scale. A general warming trend is expected because of rising greenhouse-gas emissions, but this sudden heat spike greatly exceeds predictions made by statistical climate models that rely on past observations. Many reasons for this discrepancy have been proposed but, as yet, no combination of them has been able to reconcile our theories with what has happened.

For a start, prevalent global climate conditions one year ago would have suggested that a spell of record-setting warmth was unlikely. Early last year, the tropical Pacific Ocean was coming out of a three-year period of La Niña, a climate phenomenon associated with the relative cooling of the central and eastern Pacific Ocean. Drawing on precedents when similar conditions prevailed at the beginning of a year, several climate scientists, including me, put the odds of 2023 turning out to be a record warm year at just one in five.

Climate Model Bias 1: What is a Model?

by A. May, Feb 29, 2024 in WUWT


There are three types of scientific models, as shown in figure 1. In this series of seven posts on climate model bias we are only concerned with two of them. The first are mathematical models that utilize well established physical, and chemical processes and principles to model some part of our reality, especially the climate and the economy. The second are conceptual models that utilize scientific hypotheses and assumptions to propose an idea of how something, such as the climate, works. Conceptual models are generally tested, and hopefully validated, by creating a mathematical model. The output from the mathematical model is compared to observations and if the output matches the observations closely, the model is validated. It isn’t proven, but it is shown to be useful, and the conceptual model gains credibility.

Models are useful when used to decompose some complex natural system, such as Earth’s climate, or some portion of the system, into its underlying components and drivers. Models can be used to try and determine which of the system components and drivers are the most important under various model scenarios.

Besides being used to predict the future, or a possible future, good models should also tell us what should not happen in the future. If these events do not occur, it adds support to the hypothesis. These are the tasks that the climate models created by the Coupled Model Intercomparison Project (CMIP)[1] are designed to do. The Intergovernmental Panel on Climate Change (IPCC)[2] analyzes the CMIP model results, along with other peer-reviewed research, and attempts to explain modern global warming in their reports. The most recent IPCC report is called AR6.[3]

In the context of climate change, especially regarding the AR6 IPCC[4] report, the term “model,” is often used as an abbreviation for a general circulation climate model.[5] Modern computer general circulation models have been around since the 1960s, and now are huge computer programs that can run for days or longer on powerful computers. However, climate modeling has been around for more than a century, well before computers were invented. Later in this report I will briefly discuss a 19th century greenhouse gas climate model developed and published by Svante Arrhenius.

Besides modeling climate change, AR6 contains descriptions of socio-economic models that attempt to predict the impact of selected climate changes on society and the economy. In a sense, AR6, just like the previous assessment reports, is a presentation of the results of the latest iteration of their scientific models of future climate and their models of the impact of possible future climates on humanity.

Introduction

Modern atmospheric general circulation computerized climate models were first introduced in the 1960s by Syukuro Manabe and colleagues.[6] These models, and their descendants can be useful, even though they are clearly oversimplifications of nature, and they are wrong[7] in many respects like all models.[8] It is a shame, but climate model results are often conflated with observations by the media and the public, when they are anything but.

Observed humidity trends in dry regions contradict climate models

by Simpson et al., Dec 26, 2023 in PNAS


Significance

Water vapor in the atmosphere is expected to rise with warming because a warmer atmosphere can hold more moisture. However, over the last four decades, near-surface water vapor has not increased over arid and semi-arid regions. This is contrary to all climate model simulations in which it rises at a rate close to theoretical expectations, even over dry regions. This may indicate a major model misrepresentation of hydroclimate-related processes; models increase water vapor to satisfy the increased atmospheric demand, while this has not happened in reality. Given close links between water vapor and wildfire, ecosystem functioning, and temperature extremes, this issue must be resolved in order to provide more reliable climate projections for arid and semi-arid regions of the world.

Abstract

Arid and semi-arid regions of the world are particularly vulnerable to greenhouse gas–driven hydroclimate change. Climate models are our primary tool for projecting the future hydroclimate that society in these regions must adapt to, but here, we present a concerning discrepancy between observed and model-based historical hydroclimate trends. Over the arid/semi-arid regions of the world, the predominant signal in all model simulations is an increase in atmospheric water vapor, on average, over the last four decades, in association with the increased water vapor–holding capacity of a warmer atmosphere. In observations, this increase in atmospheric water vapor has not happened, suggesting that the availability of moisture to satisfy the increased atmospheric demand is lower in reality than in models in arid/semi-arid regions. This discrepancy is most clear in locations that are arid/semi-arid year round, but it is also apparent in more humid regions during the most arid months of the year. It indicates a major gap in our understanding and modeling capabilities which could have severe implications for hydroclimate projections, including fire hazard, moving forward.
 …
Also here (NotricksZone)

Impacts and risks of “realistic” global warming projections for the 21st century

by N. Scafetta,  March 2024, in GeoscienceFrontier


Highlights

The IPCC AR6 assessment of likely impacts and risks by 21st-century climate changes is highly uncertain.

  • Most climate models, however, run too hot, and the SSP3-7.0 and SSP5-8.5 scenarios are unlikely.

  • New climate change projections for the 21st century were generated using best-performing climate models,

  • Empirical climate modeling of natural cycles, and calibration on lower troposphere temperature data.

  • Net-zero emission policies are not necessary because SSP2-4.5 is sufficient to limit climate change hazards to manageable levels.

61 NoTricksZone Articles On Studies, Datasets From 2023 Show Climate Models Are Rubbish

by P.  Gosselin,  Ec 31, 2023 in NoTricksZone


Most climate models are worse than garbage, a number of real measurements, peer-reviewed studies and data show. Their phony results are mainly used to spread fear. 


The outputs of model simulations often get confused by the media and public as real measurement results. But often they are generated nefariously to promote panic.

Recall the pandemic models showing showing 100s of millions would die if we didn’t lockdown. In reality COVID 19 was no worse than a regular flu.

What follows are 61 NTZ posts from 2023 that show that climate model results have nothing to do with reality. Their outputs are garbage. 

1. Typhoons are supposed to be getting more frequent and worse. They are not.

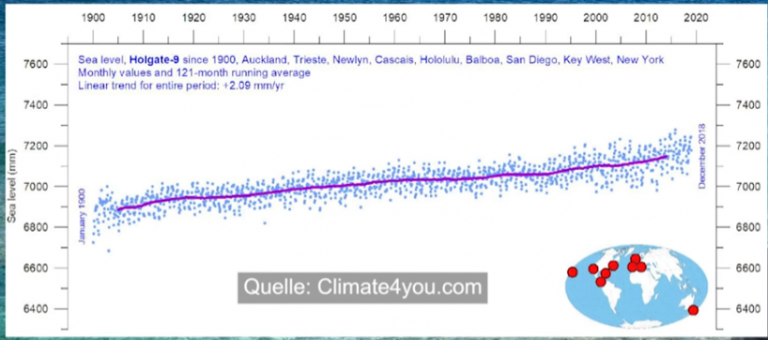
2. Sea levels rise is accelerating, models say. Fact: at many places they are falling.

3. It’s the hottest in 125,000 years. Wrong, e.g. it was fore example 4-7°C warmer in Austria 2000 years ago.

4. CO2 is the main driver. It is not. Models severely underestimate clouds.

5. Water vapor causes warming. But here’s a study that suggests the opposite.

6. CO2 leads to warming and drought. But the opposite is true: greening and cooling.

7. Winters in Tokyo are warming, the models tell us. But JMA data in fact show they are cooling.

8. Models show rapidly rising sea levels. But tide gauges and studies show it’s not true.

9. Models say Venice is gonna sink. It’s not happening, a study shows.

10. Models say that Holocene sea levels are higher than ever today. But mid-Holocene levels were 1-3 meters higher.


51. Remember how the models predicted Greenland would melt rapidly and cause sea levels to rise by meters? Well, since 1992, it has only contributed 1.2 CENTIMETERS!

52. Oops, also volcanic activity got neglected by the models too.

53. Two Portuguese scientists (Khmelinskii and Woodcock, 2023) identify at least 8 assumptions in the “greenhouse gas hypothesis” that lack scientific validation.  Models can’t work if the assumptions are grossly false.

54. Models got the aerosol forcings wrong too. ..10 times larger.

55. Antarctica has cooled. Models are wrong on that, too.

56. Models have been failing for 4 decades. Remember above how we remarked they worked better in the 1980s.

57. Modern sea ice extent is nearly the highest it’s been in 9000 years.

58. The rise of CO2 over the past 120 years hasn’t really altered the greenhouse effect. Someone tell the modelers.

59. A new paper finds that the models have it backwards: warming drives CO2!

60. Definitely today is NOT the warmest its been in 125,000 years, not even 10,000 years.

61. German Helmholtz UFZ ground moisture models insist the ground is still dry, even after weeks of heavy rains and floods.

Can we trust projections of AMOC weakening based on climate models that cannot reproduce the past?

by G.D. McCarthy & L. Caesar, Nov 2023 in PhilosophicalTransactions


The Atlantic Meridional Overturning Circulation (AMOC), a crucial element of the Earth’s climate system, is projected to weaken over the course of the twenty-first century which could have far reaching consequences for the occurrence of extreme weather events, regional sea level rise, monsoon regions and the marine ecosystem. The latest IPCC report puts the likelihood of such a weakening as ‘very likely’. As our confidence in future climate projections depends largely on the ability to model the past climate, we take an in-depth look at the difference in the twentieth century evolution of the AMOC based on observational data (including direct observations and various proxy data) and model data from climate model ensembles. We show that both the magnitude of the trend in the AMOC over different time periods and often even the sign of the trend differs between observations and climate model ensemble mean, with the magnitude of the trend difference becoming even greater when looking at the CMIP6 ensemble compared to CMIP5. We discuss possible reasons for this observation-model discrepancy and question what it means to have higher confidence in future projections than historical reproductions.

This article is part of a discussion meeting issue ’Atlantic overturning: new observations and challenges’.

Highlighting Climate Models’ Inability To Accurately Replicate Recent Climatic States

by Dr M. Wilelicki, AUG 31, 2023 in ClimateChangeDispatch


What is the Holocene Temperature Conundrum?

The Holocene Temperature Conundrum is a debate within the field of climate science regarding the patterns and variations in global temperatures during the Holocene epoch, which began around 11,700 years ago and continues to the present day.

The term refers to a discrepancy between the reconstructed global annual mean temperature and the simulated global annual mean temperature during the Holocene epoch, which spans from about 12,000 years ago to the present. [emphasis, links added]

Traditionally, reconstructions of Holocene temperatures were largely based on indirect data sources such as pollen, ice cores, lake sediments, and ocean sediment cores.

One prominent reconstruction suggested a pattern known as the Holocene Thermal Maximum (HTM) – a period between 9,000 to 5,000 years ago when temperatures were warmer than today, followed by a gradual cooling that lasted until the preindustrial era.

This cooling trend was particularly noticeable in the Northern Hemisphere and is the opposite of what would be expected from the effects of retreating ice sheets and rising greenhouse gases, which should cause global warming.

However, in the early 21st century, new reconstructions began to emerge based on a different set of proxies such as tree rings and stalagmites, which seemed to contradict the traditional view.

Instead of showing a gradual cooling over the Holocene, these reconstructions suggested that global temperatures remained relatively stable, or possibly increased slightly during this period, in agreement with the radiative forcing from ice sheets and greenhouse gases.

The contrasting interpretations of Holocene temperature patterns have sparked intense debate among scientists.

The discrepancies are thought to arise from differences in the geographical coverage of the proxies used, their seasonal biases, and other methodological differences.

Some experts suggest that the traditional view of a cooling trend might be influenced by a bias toward Northern Hemisphere summer temperatures, while others believe the newer reconstructions may underestimate past temperature variability due to various reasons such as the dampening effects of tree rings in capturing long-term trends.

This conundrum highlights the complexities involved in interpreting past climate change and the importance of refining methodologies and expanding datasets for a clearer understanding.

Climate Computer Games

by M. Kile, May 28, 2023 in WUWT


Complexity and perplexity go together like a horse and carriage, or in this case, like the climate and a modeller. When probability claims masquerade as genuine predictions about reality, and international agencies and governments promote alarmism at every opportunity, when confirmation bias distorts the search for truth, the outcome is the “climate change” hyperbole and “saving-the-planet” activism that is now disrupting every aspect of our lives.

The Holocene CO2 Dilemma

by R. Hannon, June 2023, in WUWT


This post evaluates the relationship of global CO2 with regional temperature trends during the Holocene interglacial period. Ice core records show that CO2 is strongly coupled with local Antarctic temperature and slightly lags temperature over the past 800,000 years (Luthi, 2008). Whereas the emphasis has been on CO2 and temperature lags/leads, this study focuses on Holocene millennium trends in different latitude-bounded regions.

The Contrarian Antarctic

The Holocene is fortunate to have hundreds of proxy records analyzed by Marcott, 2013, and more recently Kaufman, 2020, to establish regional and global temperature trends. The Holocene interglacial occurs approximately during the past 11,000 years. In general, global temperature trends from proxy data show a Holocene Climatic Optimum (HCO) around 6000 to 8000 years ago and a subsequent cooling trend, the Neoglacial period, culminating in the Little Ice Age (LIA). The global mean temperature is comprised of regional trends that tend to have a concave down appearance during the Holocene shown in Figure 1a.

The exception is the Antarctic shown in red which has a concave up shape. The Antarctic reached an early Holocene Climatic Optimum between 9000 to 11000 years ago. While global and most regional temperatures were warming, Antarctic cooled to a minimum around 8000 years ago. While global and other regions show progressive cooling during the Neoglacial, the Antarctic was flat and erratic. This contrary Antarctic temperature behavior during the Holocene has also been noted by Andy May here.

Observations

Climate change is routinely claimed to be largely controlled by greenhouse gases, especially CO2. This was concluded, in part, by the strong relationship between CO2 from Antarctic ice core bubbles and local Antarctic temperature trends. While CO2 mimics Antarctic temperatures very well, ninety percent of Earth’s surface temperature trends do not demonstrate a positive correlation to CO2 during the Holocene. Arctic and Northern Hemisphere temperatures become cooler during increasing CO2 levels. Tropical proxy temperatures don’t seem to be influenced by CO2.

Model simulated temperatures which are strongly influenced by CO2 do not accurately history match Holocene global proxy temperatures and tend to largely reflect Antarctic trends. The fact that CO2 correlates well to Holocene temperatures for only the Antarctic, or <10% of our planet’s surface, yet CO2 is considered as the dominant influence on climate change is a scientific dilemma.

Download the bibliography here.

NOAA Study: Atmosphere Warming At Half The Rate Predicted By Climate Models

by R. MCKitrick, Apr 13, 2023 in ClimateChangeDispatch


An important new study on climate change came out recently. I’m not talking about the Intergovernmental Panel on Climate Change (IPCC) Synthesis Report with its nonsensical headline, “Urgent climate action can secure a liveable future for all.”

No, that’s just meaningless sloganeering proving yet again how far the IPCC has departed from its original mission of providing objective scientific assessments. [emphasis, links added]

I’m referring instead to a new paper in the Journal of Geophysical Research-Atmospheres by a group of scientists at the U.S. National Oceanic and Atmospheric Administration (NOAA) headed by Cheng-Zhi Zou, which presents a new satellite-derived temperature record for the global troposphere (the atmospheric layer from one kilometer up to about 10 km altitude).

The troposphere climate record has been heavily debated for two reasons. First, it’s where climate models say the effect of warming due to greenhouse gases (GHGs) will be the strongest, especially in the mid-troposphere.

And since that layer is not affected by urbanization or other changes to the land surface, it’s a good place to observe a clean signal of the effect of GHGs.

Since the 1990s the records from both weather satellites and weather balloons have shown that climate models predict too much warming.

In a 2020 paper, John Christy of the University of Alabama-Huntsville (UAH) and I examined the outputs of the 38 newest climate models and compared their global tropospheric warming rates from 1979 to 2014 against observations from satellites and weather balloons.

All 38 exhibited too much warming, and in most cases, the differences were statistically significant. We argued that this points to a structural error in climate models where they respond too strongly to GHGs.

But, and this is the second point of controversy, there have also been challenges to the observational record.

Think We Can Model the Climate? Clouds Get in the Way

by R. Barmby, 9 Apt 2023 in CO2Coalition


I’ve looked at climate change from both sides now, and I have found common ground between proponents and skeptics of the belief that climate change is largely caused by humans. When it comes to forecasting global temperatures, distinguished experts in both camps agree a dominant variable cannot be simulated in computer models because clouds get in the way.

Among the proponents is Dr. Bjorn Stevens, a contributing author to the Intergovernmental Panel on Climate Change (IPCC) Assessment Report 5 (2014). Dr. Stevens is also director at the Max Planck Institute for Meteorology, Hamburg, Germany, and a cloud expert. In a recent interview he acknowledged the contribution of clouds to global warming is overestimated in the IPCC’s “Climate Change 2021: The Physical Science Basis.”

“Clouds are tricksters,” he said, referring to their complexity. However, he said, many scientists use oversimplified representations of clouds in modeling “as a guide because they are easier to simulate. This makes the climate models less accurate.”

On the skeptic side is Dr. Richard S. Lindzen, a former lead author for IPCC Assessment Report 3 and now a vocal critic of the IPCC. In a recent podcast the interviewer noted that Lindzen had published sufficient research papers to earn 80 PhDs. (Lindzen humbly declined the praise.)

Lindzen, professor emeritus of Atmospheric Sciences at the Massachusetts Institute of Technology,  points out that IPCC models rely on the assumption that water vapor and clouds amplify the greenhouse gas effects of CO2 in order to achieve forecasts of catastrophic global warming. The IPCC theory is that a warmer atmosphere will have a higher content of water vapor – itself is a greenhouse gas – that adds to the warming caused by CO2. Without this amplifying “positive feedback” effect, the models are still wrong for many reasons, but they no longer project “catastrophic” warming.

Dr. Stevens, who is on record stating that global warming is a “huge problem,” agrees that increased clouds do not amplify global warming: “Water-rich low clouds over the tropical ocean have the greatest cooling effect and low-water ice clouds at high altitudes have the strongest warming effect. Overall, the cooling effect is greater.” That’s called “negative feedback.”

Dr. Lindzen argues that global average temperature is controlled by the polar regions. The temperature at the tropics remains relatively constant over long periods of time while the polar regions have significant variations. In other words, a small change in global average temperature is the result of a big change in polar temperatures. The stability of tropical temperatures indicates that increased clouds provide negative feedback in times of global warming. Rather than exacerbating the global warming effect of CO2, clouds reduce it.

Lindzen proposes the mechanism by which greater negative feedback is produced: High altitude cirrus clouds (Dr. Stevens’ low-water high altitude ice clouds that cause warming) control heat emissions to space. As the air below these clouds warms, the cirrus clouds dissipate and allow more energy to radiate into space. He calls this the Iris Effect.

A Primer On The IPCC’s Implausible Climate Scenarios

by R. Pielke, Mar 17, 2023 in ClimateChangeDispatch


Next Monday the Intergovernmental Panel on Climate Change will release its so-called “Synthesis Report” which will integrate the findings of six different reports that it has released since 2014.

I have not participated in the IPCC nor have I seen the new report.

However, I have little doubt that one of the main issues that we will be discussing next week when the report is released will be the implausible climate scenarios that underpin much of the work of the IPCC over the past 9 years.[emphasis, links added]

Research I’ve been involved in — along with colleagues Matthew Burgess and Justin Ritchie — shows that theemissions scenarios that have guided the work of the IPCC and the broader climate research community are widely off the mark.

In short, they are far too extreme, both in what they project for today and especially into the future.

Our work is part of a growing consensus in the literature about the implausibility of extreme climate scenarios — a consensus so strong that it was acknowledged in the most recent IPCC assessmentreports, even though it complicated their messages.

The ubiquity of out-of-date scenarios throughout recent IPCC reports and the underlying literature that is has assessed means that the IPCC Synthesis Report, summarizing its work since 2014, runs the risk of promoting out-of-date science.

CMIP6 GCM Validation Based on ECS and TCR Ranking for 21st Century Temperature Projections and Risk Assessment

by N. Scafetta, Feb 9, 2023 in MDPI_Atmosphere


Abstract

Global climate models (GCMs) from the sixth Coupled Model Intercomparison Project Phases (CMIP6) have been employed to simulate the twenty-first-century temperatures for the risk assessment of future climate change. However, their transient climate response (TCR) ranges from 1.2 to 2.8 °C, whereas their equilibrium climate sensitivity (ECS) ranges from 1.8 to 5.7 °C, leading to large variations in the climatic impact of an anthropogenic increase in atmospheric CO2 levels. Moreover, there is growing evidence that many GCMs are running “too hot” and are hence unreliable for directing policies for future climate changes. Here, I rank 41 CMIP6 GCMs according to how successfully they hindcast the global surface warming between 1980 and 2021 using both their published ECS and TCR estimates. The sub-ensemble of GCMs with the best performance appears to be composed of the models with ECS ranging between 1.8 and 3.0 °C (which confirms previous studies) and TCR ranging between 1.2 and 1.8 °C. This GCM sub-ensemble is made up of a total of 17 models. Depending on the emission scenarios, these GCMs predict a 2045–2055 warming of 1.5–2.5 °C compared to the pre-industrial era (1850–1900). As a result, the global aggregated impact and risk estimates seem to be moderate, which implies that any negative effects of future climate change may be adequately addressed by adaptation programs. However, there are also doubts regarding the actual magnitude of global warming, which might be exaggerated because of urban heat contamination and other local non-climatic biases. A final section is dedicated to highlighting the divergences observed between the global surface temperature records and a number of alternative temperature reconstructions from lower troposphere satellite measurements, tree-ring-width chronologies, and surface temperature records based on rural stations alone. If the global warming reported by the climate records is overestimated, the real ECS and TCR may be significantly lower than what is produced by the CMIP6 GCMs, as some independent studies have already suggested, which would invalidate all of the CMIP6 GCMs.

CMIP6 GCM Validation Based on ECS and TCR Ranking for 21st Century Temperature Projections and Risk Assessment

by N. Scafetta, Feb 3, 2023 in MDPI, Earth Science


Global climate models (GCMs) from the sixth Coupled Model Intercomparison Project Phases (CMIP6) have been employed to simulate the twenty-first-century temperatures for the risk assessment of future climate change. However, their transient climate response (TCR) ranges from 1.2 to 2.8 °C, whereas their equilibrium climate sensitivity (ECS) ranges from 1.8 to 5.7 °C, leading to large variations in the climatic impact of an anthropogenic increase in atmospheric CO2 levels. Moreover, there is growing evidence that many GCMs are running “too hot” and are hence unreliable for directing policies for future climate changes. Here, I rank 41 CMIP6 GCMs according to how successfully they hindcast the global surface warming between 1980 and 2021 using both their published equilibrium climate sensitivity (ECS) and transient climate response (TCR) estimates. The sub-ensemble of GCMs with the best performance appears to be composed of the models with ECS ranging between 1.8 and 3.0 °C (which confirms previous studies) and TCR ranging between 1.2 and 1.8 °C. This GCM sub-ensemble is made up of a total of 17 models. Depending on the emission scenarios, these GCMs predict a 2045–2055 warming of 1.5–2.5 °C compared to the pre-industrial era (1850–1900). As a result, the global aggregated impact and risk estimates seem to be moderate, which implies that any negative effects of future climate change may be adequately addressed by adaptation programs. However, there are also doubts regarding the actual magnitude of global warming, which might be exaggerated because of urban heat contamination and other local non-climatic biases. A final section is dedicated to highlighting the divergences observed between the global surface temperature records and a number of alternative temperature reconstructions from lower troposphere satellite measurements, three-ring-width chronologies, and surface temperature records based on rural stations alone. If the global warming reported by the climate records is overestimated, the real ECS and TCR may be significantly lower than what is produced by the CMIP6 GCMs, as some independent studies have already suggested, which would invalidate all of the CMIP6 GCMs.

Climate models fail to capture strengthening wintertime North Atlantic jet and impacts on Europe

by Blackport P. & Fyfe, J.C., Nov 11, 2022 in ScienceAdvances


Abstract

Projections of wintertime surface climate over Europe depend on reliable simulations of the North Atlantic atmospheric circulation from climate models. However, it is unclear whether these models capture the long-term observed trends in the North Atlantic circulation. Here, we show that over the period from 1951 to 2020, the wintertime North Atlantic jet has strengthened, while model trends are, on average, only very weakly positive. The observed strengthening is greater than in any one of the 303 simulations from 44 climate models considered in our study. This divergence between models and observations is now much more apparent because of a very strong jet observed over the past decade. The models similarly have difficulty capturing the observed precipitation trends over Europe. Our results suggest that projections of winter atmospheric circulation and associated precipitation over Europe may be unreliable because they fail to capture the response to human emissions or underestimate the magnitude of multidecadal-to-centennial time scale internal variability.

“It was an Ambush”: The Long Fight against Climate Deniers

by E. Worrall, Oct 22, 2022 in WUWT


Read more: https://www.aljazeera.com/features/2022/10/20/the-long-fight-against-climate-change-deniers

I’m not sure why Stott seems to think the Paris Agreement is such a success. The world is currently burning record amounts of coal, so I think we can safely add the Paris Agreement to the scrapheap of failed climate initiatives, regardless of political rhetoric.

As for Russia, Russians have likely been skeptical of Western climate science ever since Western scientists ignored Russian advice there was no evidence of unusual warming in the 20th century.

In 1998 scientist Rashit Hantemirov, of the Institute of Plant and Animal Ecology, Russian Academy of Sciences, tried to explain to Keith Briffa, who helped Michael Mann construct his iconic hockey stick, that the position of the polar timber line, the northern most point at which trees can grow, was the tree metric Russia uses for measuring historic changes in Arctic temperature. Hantemirov’s advice to Briffa was “… there are no evidences of moving polar timberline to the North during last century…“. That same polar timberline metric showed evidence of substantial movement during the medieval warm period, and other well documented historic warming and cooling events (Climategate email 0907975032.txt).

Western scientists seem to prefer tree rings – but even Mann’s colleagues admitted amongst themselves that tree rings are a questionable gauge of historic temperature. Climate scientist Tom Wigley wrote an email to Professor Michael Mann in 2003, in which he explained how his own son performed a high school science experiment which demonstrated Mann’s tree ring metric was likely measuring changes in precipitation rather than changes in temperature (Climategate 2 email 0682.txt).

We can only guess what Russian scientists thought of all this absurdity – but the evidence suggests they decided it was too funny watching Western climate scientists act like fools, to make a serious effort to interrupt the joke.

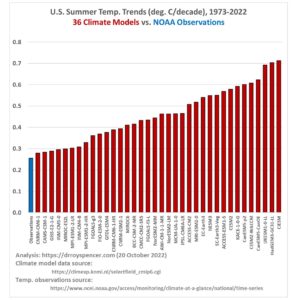
50-Year U.S. Summer Temperature Trends: ALL 36 Climate Models Are Too Warm

by Dr Roy Spencer, Oct 20, 2022 in GloablWarming


I’ll get right to the results, which are pretty straightforward.

As seen in the accompanying plot, 50-year (1973-2022) summer (June/July/August) temperature trends for the contiguous 48 U.S. states from 36 CMIP-6 climate model experiments average nearly twice the warming rate as observed by the NOAA climate division dataset.


The 36 models are those catalogued at the KNMI Climate Explorer website, using Tas (surface air temperature), one member per model, for the ssp245 radiative forcing scenario. (The website says there are 40 models, but I found that four of the models have double entries). The surface temperature observations come from NOAA/NCEI.

The official NOAA observations produce a 50-year summer temperature trend of +0.26 C/decade for the U.S., while the model trends range from +0.28 to +0.71 C/decade.

As a check on the observations, I took the 18 UTC daily measurements from 497 ASOS and AWOS stations in the Global Hourly Integrated Surface Database (mostly independent from the official homogenized NOAA data) and computed similar trends for each station separately. I then took the median of all reported trends from within each of the 48 states, and did a 48-state area-weighted temperature trend from those 48 median values, after which I also got +0.26 C/decade. (Note that this could be an overestimate if increasing urban heat island effects have spuriously influenced trends over the last 50 years, and I have not made any adjustment for that).

The importance of this finding should be obvious: Given that U.S. energy policy depends upon the predictions from these models, their tendency to produce too much warming (and likely also warming-associated climate change) should be factored into energy policy planning. I doubt that it is, given the climate change exaggerations routinely promoted by environment groups, anti-oil advocates, the media, politicians, and most government agencies

Satellite Temperature Data Show Almost All Climate Model Forecasts Over the Last 40 Years Were Wrong

by C. Morrison, Oct 8, 2022 in DailySceptic


A major survey into the accuracy of climate models has found that almost all the past temperature forecasts between 1980-2021 were excessive compared with accurate satellite measurements. The findings were recently published by Professor Nicola Scafetta, a physicist from the University of Naples. He attributes the inaccuracies to a limited understanding of Equilibrium Climate Sensitivity (ECS), the number of degrees centigrade the Earth’s temperature will rise with a doubling of carbon dioxide.

Scientists have spent decades trying to find an accurate ECS number, to no avail. Current estimates range from 0.5°C to around 6-7°C. Without knowing this vital figure, the so-called ‘settled’ science narrative around human-caused climate change remains a largely political invention, not a credible scientific proposition. Professor Scafetta has conducted extensive work into climate models and is a long-time critic of their results and forecasts. In a previous work, he said many of the climate models should be “dismissed and not used by policymakers”. Along with around 250 professors, he is a signatory to the World Climate Declaration which states there is no climate emergency and also notes climate models are “not remotely plausible as global tools”.

Scafetta’s latest work grouped 38 major climate models into low, medium and high ECS values, ranging between 1.8°C and 5.7°C. He found that models in the medium and high category “ran hot” in over 95% and 97% of cases respectively. The lower models were said to have done better when compared to global warming calculated for the period by the major surface datasets of 0.52-0.58°C. But the UAH satellite data showed warming up to 30% less during this period, suggesting even the low warming models produced “excessive warming” from 1980-2021.

According to Scafetta, these results are showed that the ECS figure could be as low as 1.2-2°C. Particular concern is expressed about surface temperature records that “appear to be severely affected by non-climatic warming biases”. Scafetta concludes that surface-based temperature records are likely to be affected by warming biases, such as the urban heat island effect due to expanding urban development, and subject to natural oscillations that are not reproduced by climate models. He concludes: “The global warming expected for the next few decades may be even more moderate than predicted by the low ECS-GCMs [Global Circulation Models], and could easily fall within a safe temperature range where climate adaptation policies will suffice.”


See also : Satellite Temperature Data Show Almost All Climate Model Forecasts Over the Last 40 Years Were Wrong

CMIP6 GCM ensemble members versus global surface temperatures

by N. Scafetta, Sep 18, 2022 in Springer


Abstract

The Coupled Model Intercomparison Project (phase 6) (CMIP6) global circulation models (GCMs) predict equilibrium climate sensitivity (ECS) values ranging between 1.8 and 5.7 C. To narrow this range, we group 38 GCMs into low, medium and high ECS subgroups and test their accuracy and precision in hindcasting the mean global surface warming observed from 1980–1990 to 2011–2021 in the ERA5-T2m, HadCRUT5, GISTEMP v4, and NOAAGlobTemp v5 global surface temperature records. We also compare the GCM hindcasts to the satellite-based UAH-MSU v6 lower troposphere global temperature record. We use 143 GCM ensemble averaged simulations under four slightly different forcing conditions, 688 GCM member simulations, and Monte Carlo modeling of the internal variability of the GCMs under three different model accuracy requirements. We found that the medium and high-ECS GCMs run too hot up to over 95% and 97% of cases, respectively. The low ECS GCM group agrees best with the warming values obtained from the surface temperature records, ranging between 0.52 and 0.58 C. However, when comparing the observed and GCM hindcasted warming on land and ocean regions, the surface-based temperature records appear to exhibit a significant warming bias. Furthermore, if the satellite-based UAH-MSU-lt record is accurate, actual surface warming from 1980 to 2021 may have been around 0.40 C (or less), that is up to about 30% less than what is reported by the surface-based temperature records. The latter situation implies that even the low-ECS models would have produced excessive warming from 1980 to 2021. These results suggest that the actual ECS may be relatively low, i.e. lower than 3 C or even less than 2 C if the 1980–2021 global surface temperature records contain spurious warming, as some alternative studies have already suggested. Therefore, the projected global climate warming over the next few decades could be moderate and probably not particularly alarming.

Global models underestimate large decadal declining and rising water storage trends relative to GRACE satellite data

by B.R. Scanlon et al., Jan 22, 2018 in PNAS


Significance

We increasingly rely on global models to project impacts of humans and climate on water resources. How reliable are these models? While past model intercomparison projects focused on water fluxes, we provide here the first comprehensive comparison of land total water storage trends from seven global models to trends from Gravity Recovery and Climate Experiment (GRACE) satellites, which have been likened to giant weighing scales in the sky. The models underestimate the large decadal (2002–2014) trends in water storage relative to GRACE satellites, both decreasing trends related to human intervention and climate and increasing trends related primarily to climate variations. The poor agreement between models and GRACE underscores the challenges remaining for global models to capture human or climate impacts on global water storage trends.

Abstract

Assessing reliability of global models is critical because of increasing reliance on these models to address past and projected future climate and human stresses on global water resources. Here, we evaluate model reliability based on a comprehensive comparison of decadal trends (2002–2014) in land water storage from seven global models (WGHM, PCR-GLOBWB, GLDAS NOAH, MOSAIC, VIC, CLM, and CLSM) to trends from three Gravity Recovery and Climate Experiment (GRACE) satellite solutions in 186 river basins (∼60% of global land area). Medians of modeled basin water storage trends greatly underestimate GRACE-derived large decreasing (≤−0.5 km3/y) and increasing (≥0.5 km3/y) trends. Decreasing trends from GRACE are mostly related to human use (irrigation) and climate variations, whereas increasing trends reflect climate variations. For example, in the Amazon, GRACE estimates a large increasing trend of ∼43 km3/y, whereas most models estimate decreasing trends (−71 to 11 km3/y). Land water storage trends, summed over all basins, are positive for GRACE (∼71–82 km3/y) but negative for models (−450 to −12 km3/y), contributing opposing trends to global mean sea level change. Impacts of climate forcing on decadal land water storage trends exceed those of modeled human intervention by about a factor of 2. The model-GRACE comparison highlights potential areas of future model development, particularly simulated water storage. The inability of models to capture large decadal water storage trends based on GRACE indicates that model projections of climate and human-induced water storage changes may be underestimated.

Models, Climate Scientists Wrong Again…New Study Finds Jet Stream Strengthening, Not Weakening

by P. Gosselin,  Aug 9, 2022 in NoTricksZone


Alarmist climate research centers like the Potsdam Institute and the unquestioning media have been claiming for years that the Jet Stream is weakening, hence this would lead to greater weather extremes across the northern hemisphere due to blocking. Responsible for this of course is man-made global warming.

Hat-tip: The Klimaschau

But a recent paper by Samantha Hallam et al published in the journal Climate Dynamics looks at the seasonal to decadal variations in Northern Hemisphere jet stream latitude and speed over land for the period 1871–2011. The authors were unable to find any weakening of the sort climate alarmists have been warning about.

Quite to the contrary, the authors in fact found that the winter jet stream over the North Atlantic and Eurasia has increased in average speed by 8% to 132 mph. The authors found the 141-year trends in jet latitude and speed show differences on a regional basis and that jet speed shows significant increases evident in winter (up to 4.7 ms −1 ), spring and autumn over the North Atlantic, Eurasia and North America. Over the North Pacific, no increase was observed.

Moreover, the Jet Stream was found to have shifted northward by some 330 kilometers. Overall, the paper’s findings contradict the claims of a weakening Jet Stream regularly made by the climate alarmists and their media minions.

Applying climate alarmist science, we’d have to conclude now, due to the strengthening Jet Stream, less weather extremes should be expected. This would be good news of course. But don’t expect the fear-porn media to look at this.

Updated Atmospheric CO2 Concentration Forecast Through 2050 and Beyond

by R. Spencer, July 18, 2022 in WUWT


Summary

The simple CO2 budget model I introduced in 2019 is updated with the latest Mauna Loa measurements of atmospheric CO2 and with new Energy Information Administration estimates of global CO2 emissions through 2050. The model suggests that atmospheric CO2 will barely double pre-industrial levels by 2100, with a total radiative forcing of the climate system well below the most extreme scenario (RCP8.5) used in alarmist literature (and the U.S. national climate assessment), with the closest match to RCP4.5. The model also clearly show the CO2 reducing effect of the Mt. Pinatubo eruption of 1991.

‘A Significant And Robust Cooling Trend’ In The Southern Ocean From 1982–2020 Defies Climate Models

by K. Richard, June 27, 2022 in NoTricksZone


A new study reports there has been a -0.3°C cooling in the Southern Ocean since 1982 per multiple observational data sets. The authors detail the “failure of CMIP5 models in simulating the observed SST cooling in the Southern Ocean.”

The Southern Ocean is today about 1-2°C colder than it has been for nearly all of the last 10,000 years (Shuttleworth et al., 2021, Civel-Mazens et al., 2021, Ghadi et al., 2020).

Image Source: Shuttleworth et al., 2021

Why IPCC Climate Forecasts Are So Dodgy

by R. Barmy, May 5, 2022 in ClimateChangeDispatch


This is the fourth in a series of articles on the IPCC’s AR6 WG1 report. –CCD ed.

Margaret Thatcher helped create the United Nations Intergovernmental Panel on Climate Change (IPCC) in 1988. As an Oxford-trained chemist, she understood scientific principles and was concerned that we “… do not live at the expense of future generations.”

By 2002, the Iron Lady turned against global warming extremism by stating in her book Statecraft: Strategies for a Changing World, “What is far more apparent is that the usual suspects on the left have been exaggerating the dangers and simplifying solutions in order to press their agenda…” [bold, links added]

Thatcher’s comments of exaggeration and simplification were a prescient critique of the IPCC report Climate Change 2021: The Physical Sciences Basis.

The IPCC uses computer simulations to predict climate dangers and test solutions. An important step in the computer simulation of a real-world physical process is making sure the simulator can replicate the known history of that physical process.

If a computer model can accurately replicate a significant history of a known process, called hindcasting, it lends credibility that the correct equations are being used and will be able to predict future events.