Archives par mot-clé : Sea level

New Climate Report: Islands Not Losing Land, People To Sea-Level Rise

by J. Taylor, Oct 19, 2020 in ClimateChangeDispatch


A new study posted at ClimateAtAGlance.com documents that most small islands are growing, not losing land to sea-level rise, and island nations are attracting growing populations rather than shedding climate refugees.

The new climate summary drives a stake into the heart of alarmist assertions that climate change and rising seas are threatening island nations and their populations.

Objective measurements show that islands and atolls are growing in size, not disappearing under rising seas.

Rising seas bring sand and sediment, which build up coastal shorelines and are more than keeping pace with rising waters.

Also, coral, as living organisms growing near sea level, build up their height along with the rising sea.

For example, climate activists often claim the island nation of Tuvalu is shrinking due to rising seas and spawning climate refugees.

However, a recent peer-reviewed study found eight out of Tuvalu’s nine coral atolls have grown in size during recent decades, and three-fourths of Tuvalu’s 101 reef islands have similarly grown in size.

Also, Tuvalu’s population is consistently growing, not declining, with 20% more people living on Tuvalu now than 30 years ago. Tuvalu’s population has doubled since 1970.

Additional peer-reviewed studies (see here, here, and here) confirm the same processes are allowing – and will continue to allow – other Pacific islands to keep up with rising seas.

For example, 30 years ago, the Canberra Times claimed all 1196 islands that comprise the Maldives could be completely underwater by now.

Not only are all 1196 islands still there, but the Maldives population has doubled during the past 20 years.

People are flocking to the Maldives islands, not fleeing them. The Maldives are absorbing political refugees, not spawning climate refugees.

To read the full summary, see Climate at a Glance: Islands and Sea Level Rise.

Claim: Sea level rise from ice sheets track worst-case climate change scenario

by University of Leeds, September 1, 2020 in WUWT/Nature


Ice sheets in Greenland and Antarctica whose melting rates are rapidly increasing have raised the global sea level by 1.8cm since the 1990s, and are matching the Intergovernmental Panel on Climate Change’s worst-case climate warming scenarios.

So far, global sea levels have increased in the most part through a mechanism called thermal expansion, which means that volume of seawater expands as it gets warmer. But in the last five years, ice melt from the ice sheets and mountain glaciers has overtaken global warming as the main cause of rising sea levels.

Dr Ruth Mottram, study co-author and climate researcher at the Danish Meteorological Institute, said: “It is not only Antarctica and Greenland that are causing the water to rise. In recent years, thousands of smaller glaciers have begun to melt or disappear altogether, as we saw with the glacier Ok in Iceland, which was declared “dead” in 2014. This means that melting of ice has now taken over as the main contributor of sea level rise. “

###

Further information

The study, “Ice-sheet losses track high-end sea-level rise projections,” is published today (31 August) in Nature Climate Change.

View towards Icefjord in Ilulissat. Easy hiking route to the famous Kangia glacier in Greenland. The Ilulissat Icefjord seen from the viewpoint. Declared a UNESCO World Heritage Site in 2004. Photo taken in Greenland.

Satellite survey shows California’s sinking coastal hotspots

by Arizona State University, August 2, 2020 in WUWT


A majority of the world population lives on low lying lands near the sea, some of which are predicted to submerge by the end of the 21st century due to rising sea levels.

The most relevant quantity for assessing the impacts of sea-level change on these communities is the relative sea-level rise – the elevation change between the Earth’s surface height and sea surface height. For an observer standing on the coastland, relative sea-level rise is the net change in the sea level, which also includes the rise and fall of the land beneath observer’s feet.

Now, using precise measurements from state-of-the-art satellite-based interferometric synthetic aperture radar (InSAR) that can detect the land surface rise and fall with millimeter accuracy, an Arizona State University research team has, for the first time, tracked the entire California coast’s vertical land motion.

They’ve identified local hotspots of the sinking coast, in the cities of San Diego, Los Angeles, Santa Cruz and San Francisco, with a combined population of 4 to 8 million people exposed to rapid land subsidence, who will be at a higher flooding risk during the decades ahead of projected sea-level rise.

“We have ushered in a new era of coastal mapping at greater than 1,000 fold higher detail and resolution than ever before,” said Manoochehr Shirzaei, who is the principal investigator of the NASA-funded project. “The unprecedented detail and submillimeter accuracy resolved in our vertical land motion dataset can transform the understanding of natural and anthropogenic changes in relative sea-level and associated hazards.”

The results were published in this week’s issue of Science Advances (DOI link here).

NOAA Bureaucrats Falsely Claim ‘Extraordinary’ Sea Level Rise

by H.S. Burnett, July 18, 2020 in ClimateRealism


The National Oceanic and Atmospheric Administration, which relies on perpetuation of the Climate Delusion to maintain high funding, is falsely claiming there has been “extraordinary” sea level rise since 2000. Fox News and other media outlets are devoting substantial attention to the assertion by NOAA bureaucrats. However, there is simply nothing extraordinary about recent sea level rise.

According to Fox News, NOAA claims “Communities in coastal areas of the U.S. saw record-setting high-tide flooding last year, part of a trend of rising seas … [and an] ‘extraordinary’ rise in high-tide flooding since 2000.”

“Damaging floods that decades ago happened only during a storm now happen more regularly, even without severe weather,” Nicole LeBoeuf, acting assistant administrator for NOAA’s National Ocean Service, told reporters in a conference call.

Even if high-tide flooding has increased in recent years, natural factors are the primary cause.

As detailed in Climate at a Glance: Sea Level Rise: Data shows global sea level has been rising at a relatively steady pace of approximately one foot per century since at least the mid-1800s, which was long before coal power plants and SUVs. Moreover, the United Nations Intergovernmental Panel on Climate Change (IPCC) confirms here has been no significant recent acceleration.

Global sea level has risen approximately 400 feet since the beginning of the end of the most recent ice age—approximately 20,000 years ago. The rate of sea level rise has risen and fallen at various times since then, slowing and increasing on the order of tens, hundreds, and thousands of years over the past 20,000 years. All of that variance had  nothing to do with human activities. Indeed, as NASA reports, sea level always rises between ice ages as ice sheets retreat. During the last interglacial period between ice ages, seas were four to six meters higher than we are experiencing today….

New Studies Suggests Sea Levels Are Lower Today Than They Were Even During The Little Ice Age

by K. Richard, June 18, 2020 in NoTricksZone


Coastal history analyses increasingly suggest sea levels are lower today than at any time in the last 7000 years – even lower than the 1600s to 1800s.

Recently we compared cartology from the 17th to 19th centuries to direct aerial images of coastal positions today. Rather surprisingly, there seemed to be more land area below sea level a few hundred years ago.

For example, an 1802 nautical map of New York City and Long Island shows there may have been more open waters in this region during the Little Ice Age than in 2019.


Image Source: Amazon.com

Shoreline analysis from India also suggests the coasts were further inland during the 1600s than they are today (Mörner, 2017).

Study: As Sea Levels Rise, Island ‘Drowning’ Is Not Inevitable

by A. Williams, June12, 2020 in ClimateChangeDispatch


Coral reef islands across the world could naturally adapt to survive the impact of rising sea levels, according to new research.

The increased flooding caused by the changing global climate has been predicted to render such communities – where sandy or gravel islands sit on top of coral reef platforms – uninhabitable within decades.

However, an international study led by the University of Plymouth (UK) suggests that perceived fate is far from a foregone conclusion.

The research, published in Science Advances, for the first time uses numerical modeling of island morphology alongside physical model experiments to simulate how reef islands – which provide the only habitable land in atoll nations – can respond when sea levels rise.

Pacific Island states will not longer play the patsies for the climate alarmists

by P. Homewood, May 27, 2020 in NotaLotofpeopleKnowThat


The science is settled. The time for debate is over. It’s actually better than we thought. The Pacific islands are not sinking under rising sea levels, in fact, the peer-reviewed science shows the exact opposite, the majority of low lying islands are either stable or increasing in size — something even ABC FactCheck was forced to concede.

Nevertheless, this has not stopped climate alarmists led by the Portuguese socialist and UN General Secretary Guterres from denying the peer-reviewed science and exploiting Pacific Island nations, by using them as patsies to peddle fear and misinformation with discredited claims of ”sinking islands”.

And so far, the Pacific islanders have been happy to play along; perhaps driven by a cargo-cult mentality, believing if they utter the magic words ”climate change” and pose for the international media forlornly staring out over the sea, that they might be rewarded with cash handouts from the UN Green Global Climate fund.

But that was all before the Wuhan Flu.

Sea Level Rise Is Accelerating (If You Ignore Pre 1970 Data!)

by P. Homewood, February 19, 2020 in NotaLotofPeopleKnowThat


This has to go down as one of the most fraudulent climate studies yet!

Want to know how sea level in your area is changing due to global warming and other factors? Our ‘report cards’ can help. Updated by the Virginia Institute of Marine Science each year as annual tide-gauge data become available, they display recent sea-level trends and project sea-level height to the year 2050 for 32 localities along the U.S. East, Gulf, West, and Alaskan coasts.

Report Card Components

Our report cards have 3 components: the 2050 projection, recent trends in the rates of sea-level change, and an explanation of processes affecting sea level at each locality.

The annotated chart below, using the latest data from Norfolk, Virginia, briefly explains the data and statistical approaches we use in our 2050 projections. Visit an individual locality for details on all its report-card components. You can also compare sea-level trends, projections and processes among localities and by region. For full technical details, read our report.

https://www.vims.edu/research/products/slrc/index.php

Jakarta is not an Exemplar of Sea Level Rise

by K. Hansen, January 25, 2020 in WUWT


Ted Nordhaus has an excellent article in the Wall Street Journal titled “Ignore the Fake Climate Debate”.

[  It may or may not be pay-walled for you — if it is, try searching the title in your search engine and use the link provided by Google/Bing/whatever — it may let you in or see here. ]


Jakarta, Indonesia, is not an exemplar of rising sea levels    

 Jakarta is a good proxy for many of the problems that Asian cities are having with sea levels — relative sea levels.   Is Relative Sea Level a problem specific to Asian cities?  No, but it is a common problem to Asian mega-cities as can be seen in this figure:

North Atlantic Sea Levels Have Been Falling At A Rate Of 7.1 mm/yr Since 2004…In Tandem With 2°C Cooling

by K. Richard/Chafik et al. 2019, January 20, 2020 in NoTricksZone


Rapid cooling in the North Atlantic has reversed regional sea level changes and has apparently spread to the Greenland ice sheet

Image Source: Chafik et al. (2019)

Despite stressing global sea level rise is worrisome and due to anthropogenic warming, Chafik et al. (2019) report a distinct cooling trend in the North Atlantic that coincides with a transition to falling regional sea levels since 2004.

19 Papers Published In 2019 Affirm Sea Levels Were METERS Higher Than Today 4-8 Thousand Years Ago

by K. Richard, January 16, 2020 in NoTricksZone


The onslaught of paleoclimate evidence for warmer-than-now Mid-Holocene climates – when the Earth’s sea levels were meters higher than they are today –  stormed through 2019.

There were 107 scientific papers published this past year indicating today’s warmth isn’t even close to being unusual or unprecedented when compared to the climates of the last centuries to millennia.

As illustrated below, there were also 19 papers affirming today’s sea levels are among the lowest of the last ~8000 years.

This is added to the list of nearly 100 scientific papers published in the last handful of years indicating Mid-Holocene sea levels were multiple meters higher than they are today due to the much more extensive glacier and ice sheet melt occuring during these millennia.

A Geological Perspective on Sea Level Rise Acceleration

by David Middleton, December 9, 2019 in WUWT


There have been at least three recent peer-reviewed papers asserting an anthropogenic acceleration in the rate of sea level rise (SLR): Church & White, 2006 (CW06), Church & White, 2011 (CW11) and Nerem et al., 2018 (N18). N18 only covers the satellite era (since 1993) and might actually be correct, albeit irrelevant. The primary culprits in the SLR acceleration scam are CW06 and CW11. Two other recent peer-reviewed papers clearly shoot down the notion of a recent anthropogenic acceleration: Jevrejeva et al., 2008 (J08) and Jevrejeva et al., 2014 (J14). This post will focus on CW11 (updated through 2013) and J14.

J08 and J14 indicate that the acceleration, to the extent there is one, started 150-200 years ago, consistent with the end of neoglaciation and that a quasi-periodic fluctuation (~60-yr cycle) is present. CW06 and CW11 also note the 19th Century acceleration; but also assert a more recent acceleration, presumably due to anthropogenic global warming. This SLR acceleration is, at worst, innocuous.

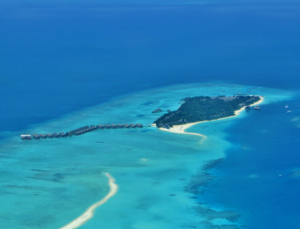
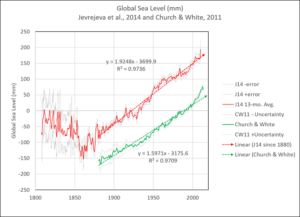
Figure 1. Jevrejeva et al., 2014 (red) and Church & White, 2011 (green).
….

Cartology Affirms Relative Sea Levels Were Similar To Or HIGHER Than Now During The Little Ice Age

by K. Richard, December 5, 2019 in NoTricksZone


Surprisingly accurate nautical maps created the 17th to 19th centuries strongly suggest coastal land area in both hemispheres were quite similar to today’s. There is even evidence relative sea levels were higher than now back then.

Image Source: Etsy.com

Globally, coasts have grown since the 1980s

Between 1985 and 2015, satellite observations indicate the world’s coasts gained 13,565 km²  more land area than they had lost to the seas (Donchyts et al., 2016).

This means more coastal land area is above sea level today than in the 1980s.

This surprises scientists, as they “expected the coast would start to retreat due to sea level rise,” but instead they observed “coasts are growing all over the world.”

New Paper Presents Photo Evidence Affirming Equatorial Region Sea Levels Have FALLEN Since The 1600s

by K. Richard, November 29, 2019 in NoTricksZone


In a new paper (Mörner, 2019, expanding upon Mörner, 2017), photo evidence confirms sea levels in 5 studied equatorial regions have fallen by about 60 cm since the 17th century…and remained stable since the 1970s.

Another new study (Haryono et al., 2019) of sea level change in equatorial Indonesia also supplies photos of marine terrace biomarker evidence affirming sea levels were about 5 meters higher than they are today between 5000 to 3000 years before present, suggesting “it means it was warmer than the present day” back then.

4 New Papers, One Alarm-Dispelling Conclusion: Future Sea Level Rise May NOT Threaten Islands After All

by K. Richard, November 4, 2019 in NoTricksZone


As reported in 4 separately-published papers, scientists have discovered a mechanism whereby islands can build themselves up naturally, thwarting the threat of sea level rise.  Tuck et al. (2019) affirm the implications of island building are profound, as it will offset existing scenarios of dramatic increases in island flooding.”

Earlier this year, Duvat (2019) identified a global trend in island shoreline net growth despite recent sea level rise.

The welcome news is that none of the islands larger than 10 ha – and just 1.2% of the 334 islands larger than 5 ha – have decreased in size since the 1980s. Nearly 90% of the world’s islands have been stable to expanding in coastal area during recent decades.

Antarctic ice cliffs may not contribute to sea-level rise as much as predicted

by Massachusetts Institute of Technology, October 21, 2019 in ScicnceDaily


Researchers report that in order for a 90-meter ice cliff to collapse entirely, the ice shelves supporting the cliff would have to break apart extremely quickly, within a matter of hours — a rate of ice loss that has not been observed in the modern record.

A realistic picture

The results suggest that the Earth’s tallest ice cliffs are unlikely to collapse catastrophically and trigger a runaway ice sheet retreat. That’s because the fastest rate at which ice shelves are disappearing, at least as documented in the modern record, is on the order of weeks, not hours, as scientists observed in 2002, when they captured satellite imagery of the collapse of the Larsen B ice shelf — a chunk of ice as large as Rhode Island that broke away from Antarctica, shattering into thousands of icebergs over the span of two weeks.

“When Larsen B collapsed, that was quite an extreme event that occurred over two weeks, and that is a tiny ice shelf compared to the ones that we would be particularly worried about,” Clerc says. “So our work shows that cliff failure is probably not the mechanism by which we would get a lot of sea level rise in the near future.”

Le GIEC en est virtuellement certain…

by Prof. Dr. Jean N., 11 octobre 2019 in ScienceClimatEnergie


Le dernier rapport spécial du GIEC vient de sortir. Ce rapport, appelé SROCC (“Special Report on the Ocean and Cryosphere in a Changing Climate“), a été approuvé à la 51e session du GIEC tenue les 20 et 23 septembre 2019. Il a déjà fait beaucoup parler de lui dans les médias. Le résumé du rapport à l’intention des décideurs (SPM) a été présenté lors d’une conférence de presse le 25 septembre 2019. Pour ceux qui comprennent l’anglais, qui ont une formation scientifique et surtout qui ont le temps de lire 1170 pages, le fichier PDF de ce rapport est disponible sur le site du GIEC. Le présent article analyse le chapitre 4 de ce rapport, celui qui traite de la montée des océans. Rassurez-vous, nous n’allons pas critiquer la montée du niveau des océans qui est un phénomène bien réel. Nous allons plutôt montrer que les auteurs ont étrangement omis certaines explications qui relativisent la portée de leurs conclusions, notamment concernant la cause de la hausse du niveau marin.

1. Structure du chapitre 4

Ce chapitre 4 consiste en 168 pages et a pour titre “Élévation du niveau de la mer et conséquences pour les îles, les côtes et les communautés de faible altitude“. Les deux auteurs coordonnateurs de ce chapitre sont Michael Oppenheimer (USA) et Bruce Glavovic (Nouvelle Zélande). Les auteurs principaux sont au nombre de 13 et les auteurs contributeurs sont au nombre de 31. Au final, 46 scientifiques ont donc contribué à écrire ce chapitre. Rien que pour ce chapitre les auteurs citent un peu plus de 1500 références, essentiellement des articles scientifiques.

Qu’apprend-t-on dans le chapitre 4?

Pour faire simple, nous y apprenons : (1) Que le niveau moyen des océans monte toujours et que la vitesse s’accélère; (2) Que cette montée du niveau marin est essentiellement causée par l’homme; (3) Que l’on peut calculer ce qui va se passer dans le futur grâce aux modèles numériques; (4) Que l’on peut éventuellement se protéger de la hausse du niveau marin par toute une série de mesures.

Nous allons maintenant nous focaliser sur les points n°1 (montée du niveau) et n°2 (les causes).

2. La montée du niveau moyen des océans selon le SROCC

Nearly Half Of 53 Tidal Gauges Show Negative Sea-Level Rise

by K. Richard, Sep. 10, 2010 in ClimateChangeDispatch


The West Coast of North America has 20 long-term (90+ years) tide gauges measuring relative sea-level changes.

The East Coast has 33. Of the 53 total tide gauges, 45% (24) are negatively accelerating, 14 document falling sea levels, and just 11 have sea levels rising more than 3 mm/yr.

mage Source: Boretti, 2019

A cooling/non-warming North America

A few months ago, Gan et al. (2019) reported that the North American continent as a whole (180-0°, 15-60°N) “is one of the major cooling centers” in the Northern Hemisphere, with temperatures dropping after 1998 and no significant net change since the early 1980s apparent.

Historical European Sea Level Records

by Kip Hansen, Sep. 6, 2019 in WUWT


I have been working on another sea level related essay and in the process stumbled upon a paper published in 1990 by thePermanent Service for Mean Sea Level (PSMSL).  The title is: “On The Availability Of  European Mean Sea Level Data  by P.L. Woodworth, N.E. Spencer and G. Alcock  (1990)”,  The paper is listed on the PSMSL page of “Publications Relevant to the PSMSL and GLOSS” but is not available there.  [ a  .pdf is available here  courtesy of the library at the University of New Brunswick, Canada ].

La hausse du niveau de la mer accélère-t-elle l’érosion des côtes? (3/3)

by Prof. Y. Battiau, 30 août 2019 in ScienceClimat Energie


6. Conclusion

A la question initiale qui avait été posée – “la hausse du niveau de la mer accélère-t-elle l’érosion des côtes?”- on peut répondre qu’elle ne joue qu’un rôle mineur, comparé à celui des tempêtes. Dans l’état actuel des recherches, on peut dire aussi que le réchauffement climatique n’augmente pas la fréquence et l’intensité des tempêtes. Tout cela va à l’encontre de ce que l’on entend habituellement dans les médias, mais le scientifique a le devoir de rétablir la réalité des faits.

Pourtant, on ne peut nier que les risques littoraux s’aggravent dans beaucoup de régions et que leur gestion est de plus en plus coûteuse. Mais la plupart du temps, cette aggravation résulte de facteurs anthropiques. Alors que les hommes ont longtemps évité la proximité immédiate du littoral, ils ont depuis plus de 150 ans, entrepris d’installer habitations, infrastructures et complexes industriels le plus près possible de la côte. Face à cette vulnérabilité accrue, il a fallu ensuite “défendre contre la mer” tous ces biens, une stratégie qui n’a fait que renforcer ou déplacer l’érosion marine. La seule façon de prévenir efficacement les risques littoraux est de travailler avec les processus naturels et surtout de respecter la ressource sédimentaire du système côtier, en évitant d’entraver la mobilité naturelle du trait de côte. Mais ce serait là l’objet d’un autre article…

La hausse du niveau de la mer accélère-t-elle l’érosion des côtes? (1/3)

by Y. Battiau-Queney, 15 août 2019 in ScienceClimatEnergie


Il est courant de lire et d’entendre que la hausse du niveau de la mer, l’une des conséquences les plus manifestes du réchauffement climatique, va accélérer l’érosion de nos côtes, menacer de submersion marine de vastes zones littorales urbanisées et faire disparaître nombre d’îles basses habitées. Ces craintes sont-elles justifiées? Comme un consensus ne vaut pas vérité scientifique, on va essayer de démêler le vrai du faux en partant de l’état des connaissances scientifiques sur la hausse du niveau de la mer et analyser ses effets possibles sur les processus d’érosion des côtes.


1/ Que sait-on de la hausse du niveau de la mer ?

1.1. État des connaissances sur les variations passées et présentes du niveau de la mer à l’échelle mondiale

Une bonne synthèse récente sur les causes et l’ampleur de la hausse du niveau de la mer se trouve dans Cazenave et Le Cozannet (2014). On y trouvera une très abondante bibliographie antérieure à 2013. Les méthodes utilisées par les scientifiques pour évaluer la tendance moyenne de l’élévation du niveau de la mer dépendent de la période considérée. A l’échelle du Pléistocène (1 800 000 ans) et de l’Holocène (10 000 ans) on dispose d’archives sédimentologiques (repérage d’anciennes plages “soulevées”, analyse de niveaux tourbeux recouverts de sédiments marins, stratigraphie et datation de récifs coralliens …) et de données archéologiques, particulièrement riches sur les côtes méditerranéennes. On sait qu’à plusieurs reprises, pendant les phases interglaciaires du Pléistocène, le niveau de la mer a été supérieur à l’actuel de 5 à 10 m au moins (Planton et al., 2015). À partir du milieu du 19ème siècle, on utilise les données souvent précises des marégraphes installés principalement dans les ports de l’hémisphère nord. Elles fournissent les altitudes relatives du niveau de la mer par rapport aux terres émergées. Depuis 1993, les données satellitaires fournissent des altitudes absolues du niveau de la mer par rapport à l’ellipsoïde terrestre de référence et permettent d’avoir une vision beaucoup plus globale des variations du niveau des océans à toutes les latitudes et longitudes.

Tableau 1 : variations du niveau de la mer indiquées par les marégraphes (sources: SONEL et GLOSS; Wöppelmann et al., 2014 pour Marseille) (ND= non documenté). Les données dans les colonnes sont exprimées en mm/an.

Malfeasant Omissions? German Flagship ARD Broadcasting One-Sided, Drama-Making Sea Level Reporting

by Dr. S. Lüning, August 9, 2019 in NoTricksZone


What follows is another example of the tricks the mainstream media use to produce fake drama and urgency concerning sea level rise and climate change – namely omissions – and how geologist Sebastian Lüning held their feet to the fire.

Dr. Sebastian Lüning wrote a complaint to German ARD public broadcasting concerning its December 2, 2018, one-sided reporting of the Indian island of Ghoramara and the sea level rise it is allegedly experiencing. The €6.9 billion euro publicly funded, 22,612-employee ARD is the German equivalent to the UK’s BBC.

What follows is the exchange between Lüning and the ARD editorial staff:

With Sea-Level Rise, Climate Science Meets Reality

by J. Weatherall, August 6, 2019 in ClimateChangeDispatch


Numerous satellites utilized by Australian agencies and research bodies are able to take a measure of sea level by way of an altimeter. However, according to the CSIRO, it should not be overlooked that the signal to do so requires

# A satellite in an orbit which repeats the same ground track very closely (within about 1 kilometer)

# A radar system to measure the distance from the satellite to the sea surface to high accuracy. TOPEX/Poseidon and Jason-1 use two radar frequencies, Ku band (13.6GHz) and C band (5.3Ghz).

# A tracking system capable of locating the satellite vertically at any time to within a few centimeters. Some of the components of such a system are:

1/ Systems (usually a combination of GPS, satellite laser ranging and the French DORIS system) to locate the satellite

2/ A high-quality gravity model

3/ A model of the drag from solar wind and the atmosphere

4/ Suitable software to combine all of the above

Other corrections to correct the range:

On the satellite:

1/ A water vapor radiometer to measure the amount of water vapor between the satellite and the sea surface (the water vapor slows down the radar pulse, causing the raw measurement to be too long)

2/ Measurement of the range at two frequencies to estimate the “ionospheric correction” — that is, the degree to which the radar pulse is slowed down by free electrons in the ionosphere

3/ The troughs of waves contribute more to the radar reflection than the crests, so we need correction for this. This is estimated from the wind speed and the wave height, both of which can be estimated from the characteristics of the returned radar pulse.

On the ground:

1/ Ocean tide models to convert the raw altimeter measurement to “de-tided”

2/ Estimates (from a model) of the atmospheric pressure. This is used to calculate a correction to the radar range to compensate for the atmosphere slowing down the radar pulse

3/ A correction for the “inverse barometer” effect, where sea level is depressed in areas of high atmospheric pressure, and vice versa.

No one besmirches the accomplishments of the engineering and technology involved.

However, it is a basic truism that the greater the number of separate corrections needing to be applied, the greater the risk of miscalculation.