
by Y. Battiau-Queney, 15 août 2019 in ScienceClimatEnergie
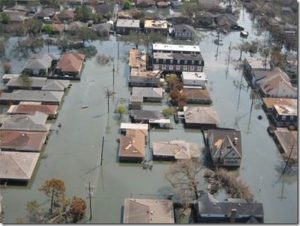
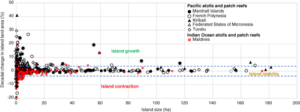
Il est courant de lire et d’entendre que la hausse du niveau de la mer, l’une des conséquences les plus manifestes du réchauffement climatique, va accélérer l’érosion de nos côtes, menacer de submersion marine de vastes zones littorales urbanisées et faire disparaître nombre d’îles basses habitées. Ces craintes sont-elles justifiées? Comme un consensus ne vaut pas vérité scientifique, on va essayer de démêler le vrai du faux en partant de l’état des connaissances scientifiques sur la hausse du niveau de la mer et analyser ses effets possibles sur les processus d’érosion des côtes.
1/ Que sait-on de la hausse du niveau de la mer ?
1.1. État des connaissances sur les variations passées et présentes du niveau de la mer à l’échelle mondiale
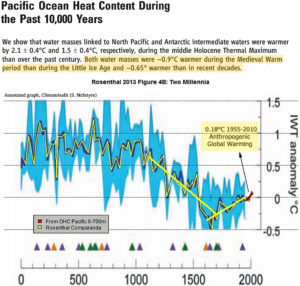
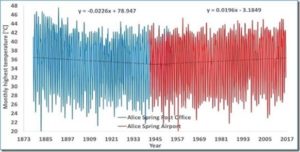
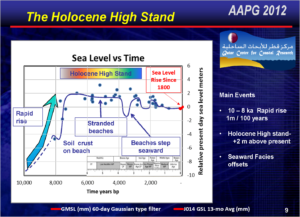
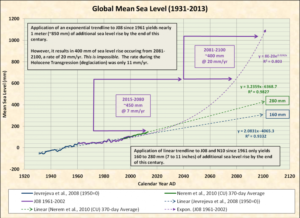
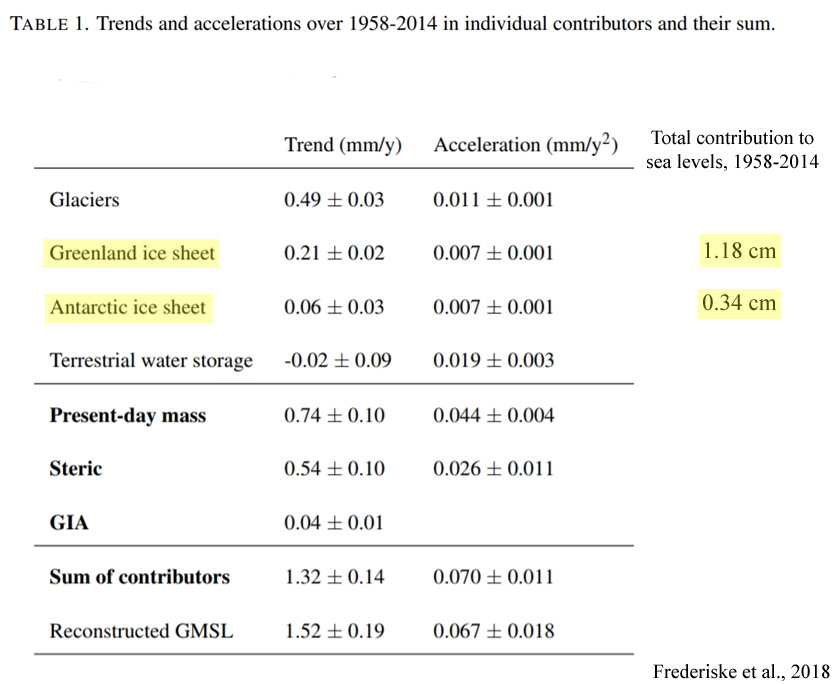
Une bonne synthèse récente sur les causes et l’ampleur de la hausse du niveau de la mer se trouve dans Cazenave et Le Cozannet (2014). On y trouvera une très abondante bibliographie antérieure à 2013. Les méthodes utilisées par les scientifiques pour évaluer la tendance moyenne de l’élévation du niveau de la mer dépendent de la période considérée. A l’échelle du Pléistocène (1 800 000 ans) et de l’Holocène (10 000 ans) on dispose d’archives sédimentologiques (repérage d’anciennes plages “soulevées”, analyse de niveaux tourbeux recouverts de sédiments marins, stratigraphie et datation de récifs coralliens …) et de données archéologiques, particulièrement riches sur les côtes méditerranéennes. On sait qu’à plusieurs reprises, pendant les phases interglaciaires du Pléistocène, le niveau de la mer a été supérieur à l’actuel de 5 à 10 m au moins (Planton et al., 2015). À partir du milieu du 19ème siècle, on utilise les données souvent précises des marégraphes installés principalement dans les ports de l’hémisphère nord. Elles fournissent les altitudes relatives du niveau de la mer par rapport aux terres émergées. Depuis 1993, les données satellitaires fournissent des altitudes absolues du niveau de la mer par rapport à l’ellipsoïde terrestre de référence et permettent d’avoir une vision beaucoup plus globale des variations du niveau des océans à toutes les latitudes et longitudes.
…
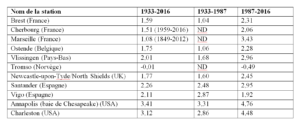
Tableau 1 : variations du niveau de la mer indiquées par les marégraphes (sources: SONEL et GLOSS; Wöppelmann et al., 2014 pour Marseille) (ND= non documenté). Les données dans les colonnes sont exprimées en mm/an.
…


