Princeton University researchers have found that the climate models scientists use to project future conditions on our planet underestimate the cooling effect that clouds have on a daily — and even hourly — basis, particularly over land.
The researchers report in the journal Nature Communications Dec. 22 that models tend to factor in too much of the sun’s daily heat, which results in warmer, drier conditions than might actually occur. The researchers found that inaccuracies in accounting for the diurnal, or daily, cloud cycle did not seem to invalidate climate projections, but they did increase the margin of error for a crucial tool scientists use to understand how climate change will affect us.
It is clear that 2017 was a very warm year. Tomorrow, NOAA, NASA and the UK Met Office will announce by how much. It won’t be a record-breaker, but it will be in the top five, and that has already started comments about why it has been so hot. After all, the record-setting El Niño temperatures of the 2015-16 are over – so why did it remain so hot? The reason, according to some, is clear: the resurgence of global warming. The year 2017 is the hottest non-El Niño year ever and therefore signifies a dramatic increase of global warming after 20-years or so when the global temperature hasn’t done very much.
The 2014-2017 El Nino “warm blob” was likely created, maintained, and partially recharged on two separate occasions by massive pulses of super-heated and chemically charged seawater from deep-sea geological features in the western North Pacific Ocean. This strongly supports the theory all El Ninos are naturally occurring and geological in origin. Climate change / global warming had nothing to do with generating, rewarming, intensifying, or increasing the frequency of the 2014-2017 El Nino or any previous El Nino.
If proven correct, this would revolutionize climatology and key aspects of many interrelated sciences such as oceanography, marine biology, glaciology, biogeochemistry, and most importantly meteorology. Information supporting a geological origin of El Ninos is diverse, reliable, and can be placed into five general categories as follows: (…)
One of the key effects of the end-Permian mass extinction, 252 million years ago, was rapid heating of tropical waters and atmospheres.
How this affected life on land has been uncertain until now.
In a new study published today, Dr Massimo Bernardi and Professor Mike Benton from the School of Earth Sciences at the University of Bristol show how early reptiles were expelled from the tropics.
by Tony Heller, January 11, 2018 in TheDeplorableClimSciBlog
Afternoon temperatures during the first week of January have been declining in the US for a century, and have dropped more than ten degrees during the last decade.
Science is hard. Some easy problems you can solve by hard work, if you are in the right place at the right time and have the right skills. Hard problems take the combined effort of multiple groups looking at the problem, publishing results and finding fault with eachother’s work, until hopefully no-one can find any more problems. When problems are hard, you may have to publish something that even you don’t think is right, but that might advance the discussion.
The calculation of an unbiased sea surface temperature record is a hard problem. Historical sea surface temperature observations come from a variety of sources, with early records being measured using wooden, canvas or rubber buckets (figure 1), later readings being taken from engine room intakes or hull sensors, and the most recent data coming from drifting buoys and from satellites.
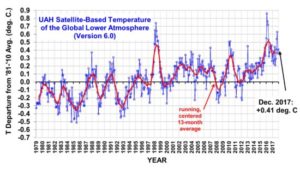
2017 Third Warmest in the 39-Year Satellite Record
Global Satellite Monitoring of Temperature Enters its 40th Year
The Version 6.0 global average lower tropospheric temperature (LT) anomaly for December, 2017 was +0.41 deg. C, up a little from the November, 2017 value of +0.36 deg. C
by M Bastach, January 5, 2017 in ClimateChangeDispatch
Record snowfall, a “bomb cyclone” and cold Arctic air have once again stirred up the debate over global warming’s impact on winter weather.
Some climate scientists are pointing the finger at manmade global warming as a culprit behind recent wintry weather, but there’s not a lot of evidence or agreement that global warming is currently driving extreme cold and snow (…)
Contrary to expectations, climate scientists continue to report that large regions of the Earth have not been warming in recent decades.
According to Dieng et al. (2017), for example, the global oceans underwent a slowdown, a pause, or even a slight cooling trend during 2003 to 2013. This undermines expectations from climate models which presume the increase in radiative forcing from human CO2 emissions should substantially increase ocean temperatures.
The authors indicate that the recent trends in ocean temperatures “may just reflect a 60-year natural cycle“, the AMO (Atlantic Multidecadal Oscillation), and not follow radiative forcing trends.
Global Temperature Report: December 2017 Global climate trend since Nov. 16, 1978: +0.13 C per decade December temperatures (preliminary)
Global composite temp.: +0.41 C (about 0.74 degrees Fahrenheit) above 30-year average for December.
Northern Hemisphere: +0.50 C (about 0.90 degrees Fahrenheit) above 30-year average for December.
Southern Hemisphere: +0.33 C (about 0.59 degrees Fahrenheit) above 30-year average for December.
Tropics: +0.26 C (about 0.47 degrees Fahrenheit) above 30-year average for November.
Other countries are failing to meet their targets, but we’re not only achieving them, we’re overdoing it. And this is despite our obvious handicaps: like that we have rapid population growth, are further from everywhere and anywhere* except for Antarctica, and we’re the largest coal exporter in the world;
The indefatigable Roy Spencer at the University of Alabama at Huntsville is the first to declare the global temperature anomaly for December 2017. As Fig. 1 shows, in the 39 years 1 month from December 1978 to December 2017, the planet has warmed by half a Celsius degree. But that is equivalent to 1.28 C°/century, or little more than one-third of the 3.3 C°/century predicted with “substantial confidence” by IPCC in 1990 and also by the fifth-generation general-circulation models of the Climate Model Intercomparison Project in 2013.
Determining magnitudes of sea surface temperature variability is important for attributing past and predicting future changes in climate, and generally requires the use of proxies to constrain multidecadal and longer timescales of variability. We report a multiproxy estimate of sea surface temperature variability that is consistent between proxy types and with instrumental estimates but strongly diverges from climate model simulations toward longer timescales. At millennial timescales, model−data discrepancies reach two orders of magnitude in the tropics, indicating substantial problems with models or proxies, or both, and highlighting a need to better determine the variability of sea surface temperatures.
Meteorologist Joe Bastardi warned of a cold snap gripping the Eastern US many weeks ago, in October, at his Weatherbell Analytics site, which I visit almost daily.
Today it’s all over the news: The Great Freeze of 2017 is smashing through the entire North American East, bringing with it a wave of record temperatures.
More than 220 million Americans are preparing for the coldest New Year in living memory as the cold snap that has swept across the northern states prompts chaos across the country.
Temperatures atop the highest peak in the north-east, Mount Washington, hit a shocking -37 degrees celsius – breaking the previous record at the Mount Washington Observatory in New Hampshire of -35C which was set in 1933.
by K. Richard, December 28, 2017 in ClimateChangeDispatch
During 2017, 120 papers linking historical and modern climate change to variations in solar activity and its modulators (clouds, cosmic rays) have been published in scientific journals.
It has been increasingly established that low solar activity (fewer sunspots) and increased cloud cover (as modulated by cosmic rays) are highly associated with a cooling climate.
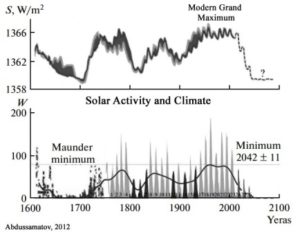
In recent years, the Earth has unfortunately left a period of very high solar activity, the Modern Grand Maximum. Periods of high solar activity correspond to multi-decadal- to centennial-scale warming.
Solar scientists are now increasingly forecasting a period of very low activity that will commence in the next few years (by around 2020 to 2025). This will lead to climate cooling, even Little Ice Age conditions.
Thirteen recently-published papers forecasting global cooling are listed below.
Does record breaking winter cold cast doubt on climate predictions of milder winters? Could ANY weather or climate shift cast doubt on the dominance of that wicked little trace molecule? Apparently not, according to leading climate explainers.
The data for November 2017 HadCRUT4 (click on image to enlarge) has just been released by the UK Met Office. It is 0.547, better expressed as 14.55 +/- 0.10 °C. Given the substantial monthly variability evident in this database one has to be careful in drawing many conclusions about it. Given that, it is interesting to note that November 2017 is statistically the same as most Novembers of the so-called pause years, i.e. 1997, 2001, 2004, 2005, 2006, 2008, 2009, 2010, 2010, 2012, 2014 and even 2016.
We know that prediction is difficult, especially about the future as the saying goes, but as an entertainment in the festive season we are asking for your 2018 global temperature forecast.
Every year at this time the UK Met Office issues its forecast of the global annual temperature for the following year. This time it says that 2018 will be another very warm year globally, but it is unlikely to be a new record due to the cooling effect of about 0.1 °C from a moderate La Niña in the Pacific.
by Joshua Nevett, December 23, 2017 in DailyStar, UK
A GLOBAL cool down lasting 120 years will trigger “more intense” winters that threaten months of freezing temperatures and snow “within a few years”, climate scientists have warned.
Reflecting upon my previous post, Where The Temperature Rules The Sun, I realized that while it was valid, it was just about temperature controlling downwelling solar energy via cloud variations. However, it didn’t cover total energy input to the surface. The total energy absorbed by the surface is the sum of the net solar energy (surface downwelling solar minus surface reflections) plus the downwelling longwave infrared, or DWIR. This is the total energy that is absorbed by and actually heats the surface.
Geologist Dr. Norman Page left a comment which I’ve decided to upgrade to a post. In it he writes solar and La Nina observations fit well with his recent paper showing that climate is controlled by natural orbital and solar activity cycles.
Dr. Page is among a growing number of scientists who share the general view that natural solar and oceanic cycles are mostly driving the climate, just as they always have in the past.
The average global temperature drop between October and November, 2017, tied for the fifth largest one-month-to-the-next drop in the 39-year satellite temperature record, according to Dr. John Christy, director of the Earth System Science Center (ESSC) at The University of Alabama in Huntsville. Compared to seasonal norms, the average temperature around the globe fell 0.27 C (almost 0.49 degrees F) between October and November. (The largest drop was from January to February 2013, when the global average temperature fell 0.32 C.)
La géologie, une science plus que passionnante … et diverse