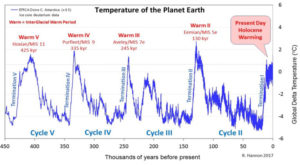
Detailed pattern correlation of Earth’s temperature changes during the past 450 kyrs reveals observations about several cyclic climate patterns. The past four glacial cycles are increasing in duration from 89 kyrs to 119 kyrs. Within these glacial cycles, two warm periods occur about 200 kyrs apart and have strikingly similar temperature characteristics.
During the last 450 kyrs, the five major warm onsets with rapidly increasing temperatures are triggered by increases in the eccentricity, obliquity, and precession of Earth’s orbit. The nearly concurrent increase in these three astronomical forces appears a necessary component for a major warm onset. Obliquity is the dominate control for ending these major warm periods and entering a cooling phase.
We provide a new confirmation for the link between solar activity and climate cycles by wavelet analysis showing a remarkably good agreement of the power of the ~190 – year period for temperatures and solar activity over 9000 years (see Fig.4. lower panel). As (Fig.2 and Table 2 ) show, the periods of ~1000 and ~460 years are also apparently common in records of temperatures and cosmogenic nuclides.
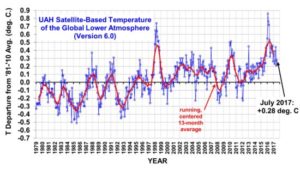
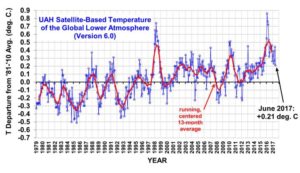
The Version 6.0 global average lower tropospheric temperature (LT) anomaly for July, 2017 was +0.28 deg. C, up a little from the June, 2017 value of +0.21 deg. C
Today ‘warm’ is strongly connected with ‘climate change’, if not with ‘dangerous climate change’. In the minds of people ‘cold’ should be more stable. But, paleo data show that it is‘cold’ that is unstable. While ‘warm’ always shows a high stability in climatic conditions.
by Tony Heller, July 29, 2017 in DeplorableClimateScinceBlog
The New York Times said yesterday that heatwaves in the past were “virtually unheard of in the 1950s”, temperatures approaching 130 degrees didn’t used to occur, and summer temperatures have shifted towards more extreme heat.
(…) Every single claim in the article is patently false, and the exact opposite of reality. The authors intentionally started their study in a cold period, after the extreme heat of the 1930’s.
A new study shows that difference in water temperature between the Pacific and the Atlantic oceans together with global warming impact the risk of drought and wildfire in southwestern North America.
by Tony Heller, July 20, 2017 in ClimateChangeDispatch
The Greenland Ice Sheet is gaining near record amounts of ice this year. Very little melting has occurred this summer, which is about to start winding down. Temperatures on the Greenland Ice Sheet have been extremely cold, and broke the all-time record for Northern Hemisphere July cold on July 4, at -33C.
Each country is committed “to prepare and maintain successive individual nationally determined contributions (INDCs) that it intends to achieve”, to update these plans every five years and to pursue and report on the related domestic emission reduction measures. After three years, a Party may withdraw from the Agreement with one year’s notice.
There is an unresolved debate as to whether to call COP21 an agreement or a treaty.
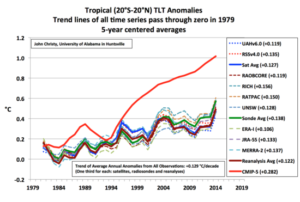
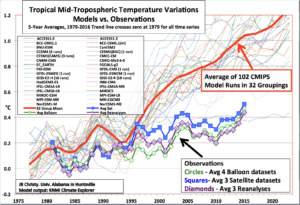
It’s pretty clear that the models are producing too much atmospheric warming compared to satellites, radiosondes (weather balloons), and multi-observational atmospheric reanalyses.
The conclusive findings of this research are that the three GAST data sets are not a valid representation of reality. In fact, the magnitude of their historical data adjustments, that removed their cyclical temperature patterns, are totally inconsistent with published and credible U.S. and other temperature data. Thus, it is impossible to conclude from the three published GAST data sets that recent years have been the warmest ever –despite current claims of record setting warming.
There are two main groups that use essentially the same NASA and NOAA satellites to estimate global temperatures. In the last year, they’ve both made adjustments, one down, and one up, getting further apart in their estimates. In ClimateWorld this is a big deal. Believers are excited that now a satellite set agrees a bit better with the maligned “hot” surface thermometers. But UAH still agrees more with millions of weather balloons. The debate continues. Here’s my short synopsis of the Roy Spencer (and John Christy) from the “Comments on the new RSS lower tropospheric temperature set.” (If something is wrong here, blame me).
In understanding climate change risk, and deciding on the ‘if’ and ‘what’ of ‘action’, we need to acknowledge that we don’t know how the climate of the 21st century will play out (Deep Uncertainty, folks). Four possibilities:
It is possible that human-caused climate change will be swamped by much larger natural climate variability.
It is possible/plausible that the sensitivity of the climate is on the low end of the IPCC envelope (1.0-1.5C), with a slow creep of warming superimposed on much larger natural variability.
It is possible/plausible that the IPCC projections are actually correct (right for the wrong reasons; too much wrong with the climate models for much credibility, IMO).
It is possible that AGW and natural variability could conspire to cause catastrophic outcomes
Over at Dr. Curry’s excellent website, she’s discussing the Red and Blue Team approach. If I ran the zoo and could re-examine the climate question, I’d want to look at what I see as the central misunderstanding in the current theory of climate.
This is the mistaken idea that changes in global temperature are a linear function of changes in the top-of-atmosphere (TOA) radiation balance (usually called “forcing”).
I thought I’d take a moment from my R&R to write about all the hullabaloo surrounding the calving of the large iceberg off the Larsen C ice shelf in Antarctica. First, a few of the headlines:
When considering the scale of temperature changes that alarmists anticipate because of Man-made Global Warming and their view of the disastrous effects of additional Man-made Carbon Dioxide emissions in this century, it is useful to look at climate change from a longer term, century by century and even on a millennial perspective.
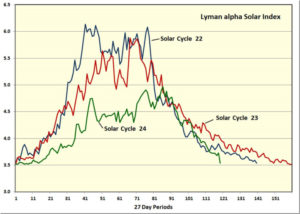
This recent post was on the fact that the Sun’s EUV emissions had fallen to solar minimum-like levels well ahead of solar minimum. The implication was that the Solar Cycle 24/25 minimum was either going to be very deep and prolonged, or that Solar Cycle 24 would be very short, which in turn would be strange for a weak cycle.
It’s official. According to a new paper published in the journal Scientific Reports,Greenland has been cooling slightly since 2005.
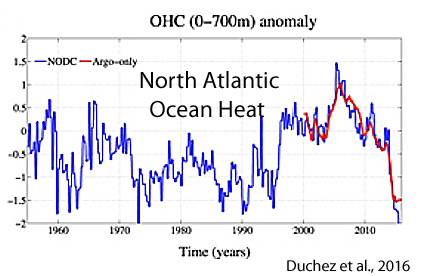
This trend development may be a harbinger of what may be in store for the coming years. Shifts in North Atlantic temperatures typically lead changes in the Arctic by a few years. And throughout the North Atlantic, rapid cooling has been underway since 2005, plunging below the levels reached in the 1950s
Much of Greenland has been colder-than-normal for the year so far and has had record or near record levels of accumulated snow and ice since the fall of last year. The first week of this month was especially brutal in Greenland resulting in the record low July temperature and it also contributed to an uptick in snow and ice extent – despite the fact that it is now well into their summer season.
A new study found adjustments made to global surface temperature readings by scientists in recent years “are totally inconsistent with published and credible U.S. and other temperature data.”
“Thus, it is impossible to conclude from the three published GAST data sets that recent years have been the warmest ever – despite current claims of record setting warming,” according to a study published June 27 by two scientists and a veteran statistician.
The BOM got caught this week auto-adjusting cold extremes to be less cold. Lance Pidgeon of the unofficial BOM audit team noticed that the thermometer at Goulburn airport recorded – 10.4°C at 6.17am on Sunday morning, but the official BOM climate records said it was -10.0°C. (What’s the point of that decimal place?) Either way this was a new record for Goulburn in July. (The previous coldest ever July morning was -9.1°C. The oldest day in Goulburn was in August 1994 when it reached -10.9°C).
We show that variations in ocean temperature in the high latitude North Atlantic and Nordic Seas are reflected in the climate of northwestern Europe and in winter Arctic sea ice extent. Statistical regression models show that a significant part of northern climate variability thus can be skillfully predicted up to a decade in advance based on the state of the ocean.Particularly, we predict that Norwegian air temperature will decrease over the coming years, although staying above the long-term (1981–2010) average. Winter Arctic sea ice extent will remain low but with a general increase towards 2020.
Lowest global temperature anomaly in last 2 years (since July, 2015)
The Version 6.0 global average lower tropospheric temperature (LT) anomaly for June, 2017 was +0.21 deg. C, down from the May, 2017 value of +0.44 deg. C
by Guillaume Séchet, 3 juillet 2017, in AssociationClimatoRéalistes
… dont août 1911 l’un des mois les plus chauds de l’histoire et 1947 (40°C à Paris les 27 et 28 juillet, record absolu depuis 1873). Emmanuel Leroy Ladurie indique qu’au dix-huitième siècle siècle les canicules pouvaient se répéter plusieurs étés consécutifs : ainsi les années 1705, 1706 et 1707, et le « couple brûlant » (sic) des années 1718 et 1719 « avec sauterelles africaines jusqu’au Languedoc ».
La géologie, une science plus que passionnante … et diverse
