by Tony Heller, October 15, 2017 in The Depl.Clim.Sci.Blog
October 15 used to be a warm day in the US, but temperatures have plummeted over the past century.

by Tony Heller, October 15, 2017 in The Depl.Clim.Sci.Blog
October 15 used to be a warm day in the US, but temperatures have plummeted over the past century.
by Kip Hansen, October 14, 2017 in WUWT
Temperature and Water Level (MSL) are two hot topic measurements being widely bandied about and vast sums of money are being invested in research to determine whether, on a global scale, these physical quantities — Global Average Temperature and Global Mean Sea Level — are changing, and if changing, at what magnitude and at what rate. The Global Averages of these ever-changing, continuous variables are being said to be calculated to extremely precise levels — hundredths of a degree for temperature and millimeters for Global Sea Level — and minute changes on those scales are claimed to be significant and important.
by Anthony Watts, October 2, 2017 in WUWT
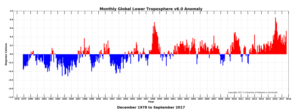
Warmest September in satellite temperature record
Boosted by warmer than normal water in the equatorial eastern Pacific Ocean that peaked in June and July, global average temperatures in the atmosphere rose to record levels in September, according to Dr. John Christy, director of the Earth System Science Center at The University of Alabama in Huntsville. Not only was it the warmest September on record, it was also the warmest month (compared to seasonal norms) in the 38-year satellite temperature record that wasn’t associated with an “officially recognized” El Niño Pacific Ocean warming event.
by Michel de Rougemont, September 30, 2017 in WUWT
(…) We are left with conjectures and other speculation, both in the recent past and for the future. For this, climatologists develop models with which they can test their hypotheses. But these models are obviously overheating. (…)
See also here
by Ross McKitrick, September 26, 2017 in ClimateEtc.
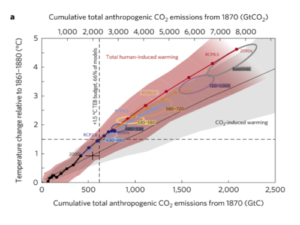
A number of authors, including the IPCC, have argued that climate models have systematically overstated the rate of global warming in recent decades. A recent paper by Millar et al. (2017) presented the same finding in a diagram of temperature change versus cumulative carbon emissions since 1870.
by C. Monckton of Brenchley, September 26, 2017 in WUWT
In the climate debate, though, it pays to read the small print. Official climatology does not usually admit its many errors: instead, we are ordered to obey the “consensus”, as the Party Line is these days rebranded. On reading the headlines, I suspected at once that the true purpose of the latest admission, by Millar et al. in the current issue of Nature Geo“science”, is to minimize and thus to conceal the true magnitude of past over-predictions.
by Forschungsverbund Berlin e.V. (FVB), September 21, in ScienceDaily
With the help of satellite observations from 188 lakes worldwide, scientists have shown that the warming of large lakes amplifies their color. Lakes which are green due to their high phytoplankton content tend to become greener in warm years as phytoplankton content increases. Clear, blue lakes with little phytoplankton, on the other hand, tend to become even bluer in warm years caused by declines in phytoplankton. Thus, contrary to previous assumptions, the warming of lakes tends to amplify their richness or poverty of phytoplankton.
See also here
by Arthur Viterio, 2016, in J Earth Science Climate Change
Earth’s climate is a remarkably “noisy” system, driven by scores of oscillators, feedback mechanisms, and radiative forcings. Amidst all this noise, identifying a solitary input to the system (i.e., HGFA MAG4/6 seismic activity as a proxy for geothermal heat flux) that explains 62% of the variation in the earth’s surface temperature is a significant finding.
See also here
by Anastasios Tsonis, September 15, 2017 in GWPF Report26 (.pdf)
This report describes this phenomenon and brings it into a modern global con- text. But the story is more than simply one of some old South American geophysical phenomenology seen from a global perspective; it is tied to an extraordinary story about new scienti c thinking, arising at the end of the 20th century, concerning the nature of change itself.
by Tony Heller, September 7, 2017
In 1974, NCAR and CRU reported the “longest-continued downward trend since temperature records began”
This cooling didn’t suit NASA’s global warming agenda, so they erased it.
by Paul Homewood, September 2, 207 in NotaLotofPeopleKnowThat
Indeed, it could be that the last 20-years of temperature recordings by the Bureau will be found not fit for purpose, and will eventually need to be discarded. This would make for a rather large hole in the calculation of global warming – given the size of Australia.
by Tony Heller, August 28, 2017 in ClimateChangeDispatch
Summer isn’t quite over yet, but it was another cool summer in the US with afternoon temperatures continuing a 125-year cooling trend.
by J. Li, J. Dodson et al., March 1, 2017 in QuaternSciReviews
We suggest that solar activity may play a key role in driving the climatic fluctuations in North China during the last 22 centuries, with its quasi ∼100, 50, 23, or 22-year periodicity clearly identified in our climatic reconstructions.
We quantitatively illustrate that precipitation (67.4%) may have been more important than temperature (32.5%)…
by Jennifer Marohasy, August 22, 2017
Our results show up to 1°C of warming. The average divergence between the proxy temperature record and our ANN projection is just 0.09 degree Celsius. This suggests that even if there had been no industrial revolution and burning of fossil fuels, there would have still been warming through the twentieth century – to at least 1980, and of almost 1°C.
Chinese Academy of Sciences : see here and here, also here
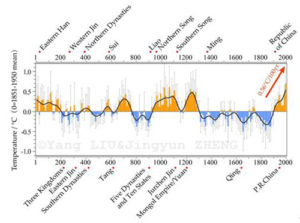
by Jennifer Marohasy, August 21, 2017
AFTER deconstructing 2,000-year old proxy-temperature series back to their most basic components, and then rebuilding them using the latest big data techniques, John Abbot and I show what global temperatures might have done in the absence of an industrial revolution. The results from this novel technique, just published in GeoResJ, accord with climate sensitivity estimates from experimental spectroscopy but are at odds with output from General Circulation Models.
by Werner Brozek, August 20, 2017 in WUWT
In order to determine if records are possible in 2017, one must know the previous records as well as the average to date and what is required for the rest of the year in order for a particular data set to set a new record.
For the five data sets I cover, records were set in 2016. For now, I am not concerned about the statistical significance of the records, nor the number of decimal places. I merely want to know if the record can be beaten this year. At the end of the year, I plan on reporting any records and how statistically significant they are.
by Paul Homewood, August 19, 2017
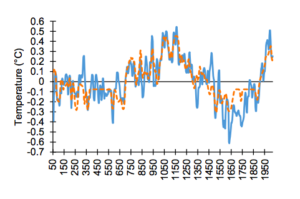
The climate industry likes to pretend that the Little Ice Age was just a local event in Europe, but studies like this one give the lie to that.
Interestingly this Tyson study also includes graphs of historical temperature trends in other parts of the world, for comparison. They all clearly show the MWP and Little Ice Age, although the peaks and troughs don’t always match.
See also here
by Kip Hansen, August 16, 2017
“Since there is no universally accepted definition for Earth’s average temperature, several different groups around the world use slightly different methods for tracking the global average over time, including:
NASA Goddard Institute for Space Studies
NOAA National Climatic Data Center
UK Met Office Hadley Centre”
by Tony Heller, August 16, 2017 in DeplorableClimSciBlog
NASA says 97% of scientists agree that their temperature graphs are accurate, and NASA, NOAA, CRU and JMA all independently agree very precisely about global temperature going back to 1880.
This is quite remarkable, considering that NASA doesn’t agree with their own data, having doubled 1880-2000 warming over the past 15 years.
by Wim Röst, August 13, in WUWT (Andy May)
Five million years ago, average temperatures were higher than they are now. During the Pliocene, the era just before the period of the Quaternary Ice Ages, ‘glacials’ did not yet exist because temperatures were too high. As cooling of the deep seas continued, temperatures became that low that large surfaces of the Northern Hemisphere became covered with snow. The earth’s albedo grew fast and large ice sheets started to develop
by Paul Homewood, August 10, 2017, in WUWT
I mentioned in my previous post that the latest draft climate report, published in June, had seemingly left out a rather embarrassing table from the Executive Summary, one that had previously been written into the Third Draft, published last December.
As the link to the Third Draft had disappeared from the NYT, I could not show it.
However, Michael Bastasch, writing over at WUWT, did have the link, so we can now compare the relevant sections.
See also here
by David Middleton, August 7, 2017 in WUWT
So… If climate change caused the Vikings to turn their plowshares into swords, abandoning their farms to become terrorists… the climate change would have been of the warming variety. I’m not a farmer, but it seems to me that global warming would have actually enhanced the Vikings’ ability to farm up around the Arctic Circle.
by JoNova, August 7, 2017 in ClimateChangeDispatch
In the mid-1990s thermometers changed right across Australia — new electronic sensors were installed nearly everywhere. Known as automatic weather sensors (AWS) these are quite different to the old “liquid in glass” type.
The electronic ones can pick up very short bursts of heat—so they can measure extremes of temperatures that the old mercury or liquid thermometers would not pick up unless the spike of heat lasted for a few minutes.
It is difficult (impossible) to believe that across the whole temperature range that these two different instruments would always behave in the exact same way.
by Willis Eschenbach, August 5, 2017 in WUWT
…
Finally, we’ve been told for years that volcanic eruptions cause COOLING … although what cooling is visible in the historical record is generally local, small, and short-lasting. But now, they say eruptions cause Northern Hemisphere winter warming? What’s up with that?
by Graham Lloyd, August 4, 2017 in Marc Morano, ClimateDepot
Recorded temperatures at the Bureau of Meteorology’s Thredbo Top automatic weather station have dropped below -10C in the past week, after action was taken to make the facility “fit for purpose”.
A record of the Thredbo Top station for 3am on Wednesday shows a temperature reading of -10.6C. This compares with the BoM’s monthly highlights for June and July, both showing a low of -9.6C.
The BoM said it had taken immediate action to replace the Thredbo station after concerns were raised that very low temperatures were not making it onto the official record.