by David Wojic, December 5, 2018 in ClimateChangeDispatch
The mainstream press coverage of the beginning of the Katowice climate summit is sad but fascinating.
There is a uniformly dogmatic sense of urgency based on fear, with very little news and a great deal of preaching.
Fear is the dominant theme.
I truly pity the people who hold these false beliefs, as they must be afraid of the future. But I am not sympathetic with the alarmism, because it makes people dangerous.
The preachers are calling on the faithful to change the world we live in, and not in a good way. Fear makes people angry and angry people are dangerous.
Here are just three examples of alarmist news coverage of the Katowice climate summit, a few among many.
New Mexico contains hundreds of historic uranium mines. Although active uranium mining in the state has ceased, rates of cardiovascular and metabolic disease remain high in the population residing close to mines within the Navajo Nation. According to a new study in ACS’ journal Environmental Science & Technology Letters, inhaled uranium in dusts from the mines could be a factor.
Volcanoes are not fed by molten magma formed in large chambers finds a new study, overturning classic ideas about volcanic eruptions.
Instead, the study suggests that volcanoes are fed by so-called ‘mush reservoirs’ — areas of mostly solid crystals with magma in the small spaces between the crystals.
Our understanding of volcanic processes, including those leading to the largest eruptions, has been based on magma being stored in liquid-filled ‘magma’ chambers — large, underground caves full of liquid magma. However, these have never been observed.
The new study, by researchers at Imperial College London and the University of Bristol and published today in Nature, suggests the fundamental assumption of a magma chamber needs a re-think.
by J.C. Maurin, 2 décembre 2018 in ScienceClimatEnergie
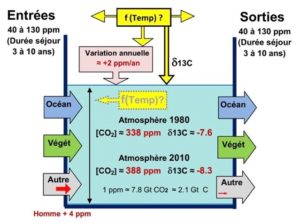
Au XVIe siècle, dans une ultime tentative pour sauver le système de Ptolémée, on se résigna enfin à admettre la rotation des planètes autour du Soleil mais on conserva le dogme de la position centrale de la Terre par rapport au Soleil. Le dernier pas vers l’héliocentrisme dut finalement être franchi, à regret. Au XXIesiècle, Le GIEC adapte discrètement son Almageste : on lit dans la version de novembre 2018 du Résumé à l’intention des décideurs dès la première page, 1er encadré de l’introduction → “L’augmentation mondiale de la concentration en dioxyde de carbone est essentiellement due à l’utilisation des combustibles fossiles et aux changements d’affectation des terres”. Fin de cette première page → « La source principale de l’augmentation de la concentration du dioxyde de carbone dans l’atmosphère depuis l’époque préindustrielle provient de l’utilisation des combustibles fossiles ». La certitude absolue, naguère affichée, d’une origine 100% anthropique dans la hausse du CO2atmosphérique disparaît donc. Un modèle mixte est désormais implicitement admis. A cinq siècles de distance, le dernier pas reste toujours difficile à franchir. Le présent article aide à trouver le chemin de Damas.
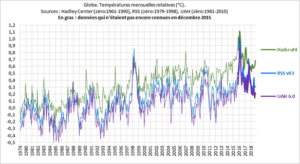
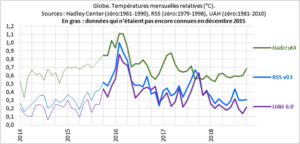
Figure 1. Rappels des observations (1/4) et corrélations (2/4)
by Kenneth Richard, December 3, 2018 in NoTricksZone
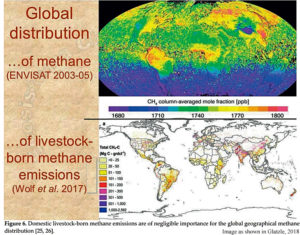
Agrobiologist and scientific researcher Dr. Albrecht Glatzle, author of over 100 scientific papers and two textbooks, has published research that shows “there is no scientific evidence, whatsoever, that domestic livestock could represent a risk for the Earth’s climate” and that the “warming potential of anthropogenic GHG [greenhouse gas] emissions has been exaggerated”.
More than two miles below the ocean’s surface, microbes, worms, fishes, and other creatures great and small thrive. They rely on the transport of dead and decaying matter from the surface (marine snow) for food at these dark depths.
Up near the sea surface, carbon dioxide from the atmosphere is incorporated in the bodies of microscopic algae and the animals that eat them. When they die, these organisms sink to the depths, carrying carbon with them.
This supply of carbon to the deep sea isn’t steady. At times, months’ to years’ worth of marine snow falls to the abyss during very short “pulse” events.
In a new study published in the Proceedings of the National Academy of Sciences (PNAS), MBARI scientists and their collaborators show that there has been an increase in pulse events off the coast of California. They also show that, although such episodes are very important to the carbon cycle, they are not well represented in global climate models.
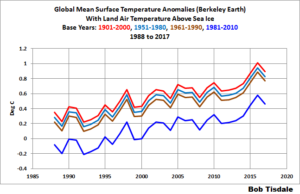
Most of us are familiar with the World Meteorological Organization (WMO)-recommended 30-year period for “normals”, which are also used as base years against which anomalies are calculated. Most, but not all, climate-related data are referenced to 30-year periods. Presently the “climatological standard normals” period is 1981-2010. These “climatological standard normals” are updated every ten years after we pass another year ending in a zero. That is, the next period for “climatological standard normals” will be 1991-2020, so the shift to new “climatological standard normals” will take place in a few years.
But were you aware that the WMO also has another recommended 30-year period for “normals”, against which anomalies are calculated? It’s used for the “reference standard normals” or “reference normals”. The WMO-recommended period for “reference normals” is 1961-1990. And as many of you know, of the primary suppliers of global mean surface temperature data, the base years of 1961-1990 are only used by the UKMO.
While there’s little cobalt mining in China itself (1 percent of the world’s total output in 2017), Chinese companies have snapped up cobalt mines abroad in recent years, particularly in the Democratic Republic of Congo, the largest source of the metal.
More honesty and less hubris, more evidence and less dogmatism, would do a world of good
Dr. Jeffrey Foss
“What can I do to correct these crazy, super wrong errors?” Willie Soon asked plaintively in a recent e-chat. “What errors, Willie?” I asked.
“Errors in Total Solar Irradiance,” he replied. “The Intergovernmental Panel on Climate Change keeps using the wrong numbers! It’s making me feel sick to keep seeing this error. I keep telling them – but they keep ignoring their mistake.”
Astrophysicist Dr. Willie Soon really does get sick when he sees scientists veering off their mission: to discover the truth. I’ve seen his face flush with shock and shame for science when scientists cherry-pick data. It ruins his appetite – a real downer for someone who loves his food as much as Willie does.
Paper Reviewed
Cross, E.L., Harper, E.M. and Peck, L.S. 2018. A 120-year record of resilience to environmental change in brachiopods. Global Change Biology24: 2262-2271.
…
In light of all their findings, Cross et al. conclude that “these rhynchonelliform brachiopods have therefore been unaffected in their abilities to construct and maintain their extensive skeletons by the change in ocean acidity and temperature over the last 120 years.” And this is a noteworthy conclusion, given that C. inconspicua is one of the most calcium-carbonate-dependent species globally, and is therefore presumed to be highly susceptible to ocean acidification. It would thus appear that proper incorporation of species’ adaptation and/or acclimation potentials is essential if scientists are to get predictions of the impacts of ocean acidification on marine life correct.
Germany’s task force on planning the definite phase-out of coal-fired power production has scrapped plans to present a decision before the end of this year.
Several days after three eastern German federal states had demanded better and more detailed plans to support coal mining regions, the so-called coal commission has decided to “conclude its work on 1 February 2019”.
The task force set up a working group from its ranks to draw up further concrete proposals for coal regions and to hold talks on these with both the federal and state governments, the commission said in a press release.
Summary: Volume II of the Fourth National Climate Assessment (NCA) has dominated the news in the weeks since its release. One of the major findings that journalists headlined was the effect of climate change on the US economy. Ten percent is vivid number to grab the attention of Americans still skeptical after thirty years of dire warnings about climate change. Unfortunately it is a dubious story, as explained in these tweets by Roger Pielke Jr.
by P. Homewood, December 2, 2018 in NotaLotofPeopleKnowThat
The BBC have now stopped even trying to camouflage their bias on climate change, with this latest piece of propaganda:
…
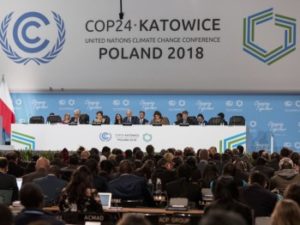
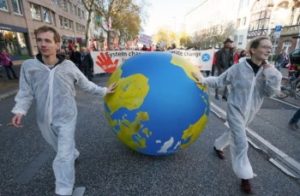
Representatives from nearly 200 countries are gathering in Poland for talks on climate change – aimed at breathing new life into the Paris Agreement.
The UN has warned the 2015 Paris accord’s goal of limiting global warming to “well below 2C above pre-industrial levels” is in danger because major economies, including the US and the EU, are falling short of their pledges.
But scientists at the Intergovernmental Panel on Climate Change (IPCC) – the leading international body on global warming – last month argued the 2C Paris pledge didn’t go far enough. The global average temperature rise actually needed to be kept below 1.5C, they said.
So how warm has the world got and what can we do about it?
Draft of article to be submitted for journal publication.
Well, I hope you are not overdosing on the issue of sea level rise. But this paper is somewhat different, a philosophy of science paper. Sort of how we think about thinking.
I would appreciate any comments, as well as suggestions as to which journals I might submit to. I have two in mind, but am open to suggestions (and I may need backups).
Thanks in advance for your comments.
Sea level rise: What’s the worst case?
Abstract. The objective of this paper is to provide a broader framing for how we bound possible scenarios for 21st century sea level rise, in particular how we assess and reason about worst-case scenarios. This paper integrates climate science with broader perspectives from the fields of philosophy of science and risk management. Modal logic is used as a basis for describing construction of the scenario range, including modal inductivism and falsification. The logic of partial positions and strategies for speculating on black swan events associated with sea level rise are described. The rapidly advancing front of background knowledge is described in terms of how we extend partial positions and approach falsifying extreme scenarios of 21st century atmospheric CO2 concentrations, warming and sea level rise. The application of partial positions and worst-case scenarios in decision making strategies is described for examples having different sensitivities to Type I versus Type II errors.
We have looked at quality, long term records from three different regions. Two of these are on opposite sides of the North Atlantic, one is in the South Pacific. The two regions bordered by the North Atlantic are similar, but not identical. The record from Australia is only similar in that temperature has varied over time and has warmed in the recent past.
In all three regions there is no evidence of any strong correlation to CO2. There is ample evidence to support a conjecture of little to no influence.
There is ample evidence, widely shown in other studies, of localized influence due to development and population growth. The CET record has a correlation of temperature to CO2 of 0.54, which is the highest correlation of any individual record in this study. This area is also the most highly developed. While this does not constitute proof, it does tend to support the supposition the weak CO2 signal is enhanced by a coincidence between rising CO2 and rising development and population.
The efficacy of combining US records with those records from Greenland, Iceland, and the UK may be subject to opinion. However, there is little doubt combining records from Australia would create an extremely misleading record. Like averaging a sine curve and a cosine curve.
It appears the GISS data set does a poor job of estimating the history of temperature in all three regions. It shows a near perfect correlation to CO2 levels which is simply not reflected in any of the individual or regional records. There are probably numerous reasons for this. I would conjecture the reasons would include the influence of short-term temperature record bias, development and population growth bias, and data estimation bias. However, a major source of error could be attributed to the simple mistake of averaging regions where the records simply are too dissimilar for an average to yield useful information.
by P. Homewood, November 30, 2018 in NotaLotofPeopleKnowThat
…
I wholeheartedly agree with David’s comments, in particular the need to show graphs.
I am sometimes accused of cherry picking or coming to different conclusions to others. But what I always try to do is actually show the graph, so readers can form their own opinions.
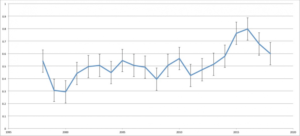
While we are on the topic, I will put up that Woodfortrees graph, which I posted yesterday. According to Woodfortrees, the warming trend since 1950 has been 0.012C/yr, or 1.2C/C.
Yet the BBC report, referred to by Dr Whitehouse, actually states that:
If the trend continues, the WMO says temperatures may rise by 3-5C by 2100.
This claim clearly is not compatible with the historical data
Fig 2 shows the same data with error bars from which it can be seen that 2018 is statistically equivalent to some years before the El Nino event.
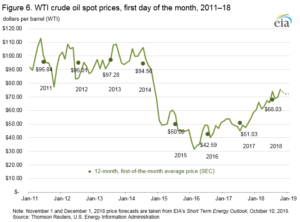
Stronger oil and natural gas prices combined with continuing development of shales and low permeability formations drove producers of crude oil and natural gas in the United States to report new all-time record levels of proved reserves for both fuels in 2017. Total U.S. oil reserves in 2017 exceeded a brief, one-year, 47-year-old record, highlighting the importance of crude oil development in shales and low permeability plays, mainly in the Southwest. The new record for natural gas extends a longer-term trend of development, mainly in shale plays in the Northeast. Both U.S. proved reserves of crude oil and natural gas are approximately double their levels from a decade ago. These new proved reserves records were established in 2017 despite production of crude oil at levels not seen since 1972, and record natural gas production.
The unexpected results of a 20-year study into reef fisheries published in the journal Nature Ecology and Evolution this week showed fisheries being maintained despite extreme coral bleaching. Remarkably, rapid proliferation of fishes with low dependence on corals led to catches remaining stable or even increasing.
But the results also showed fishing success was ‘patchy’ and more dependent on fewer species.
Around six million people fish on coral reefs. Each year their catch — estimated to be between 1.4 and 4.2 million tonnes — provides a critical source of food and income for many millions more.
Here, we reconstructed Phanerozoic PCO2 from a single proxy: the stable carbon isotopic fractionation associated with photosynthesis (Ɛp) that increases as PCO2 increases. This concept has been widely applied to alkenones, but here, we expand this concept both spatially and temporally by applying it to all marine phytoplankton via a diagenetic product of chlorophyll, phytane. We obtained data from 306 marine sediments and oils, which showed that Ɛp ranges from 11 to 24‰, agreeing with the observed range of maximum fractionation of Rubisco (i.e., 25 to 28‰). The observed secular PCO2 trend derived from phytane-based Ɛp mirrors the available compilations of PCO2over the past 420 Ma, except for two periods in which our higher estimates agree with the warm climate during those time periods. Our record currently provides the longest secular trend in PCO2 based on a single marine proxy, covering the past 500 Ma of Earth history
…
Fig. 2Ɛp calculated from phytane in Witkowski et al., 2018
by H. Schreuder, November 28, 2018 in ClimateChangeDipsatch
After decades of alarm calls over the impact of human emissions of carbon dioxide (CO2) on global temperatures and climate change, a glaring lack of factually demonstrated and scientifically proven evidence remains.
The evidence presented has been based on computer modeling of temperatures from global weather stations, a larger percentage of which are sited in towns and cities and no data, numerous studies show.
For the 70% of oceans, seas, and lakes, satellite measurements are routinely adjusted to take account of anomalies and sea level rise alarm, expressed in measurements of millimeters per century, does not quantify in that tidal gauges are subjected to landmass upheavals and/or subsidence, none of which can be taken to represent empirical evidence.See Also: New study shows coastlines gaining land despite sea level alarmism) …
This report reflects 18 months of work on this topic. Why have I devoted so much time to the sea level rise issue? First, I regard sea level rise to be the most consequential potential impact of predicted global warming. Second, there is a great deal of public confusion about the issue, including decision makers. Third, a number of CFAN’s clients have queried me about a range of specific concerns that they have regarding sea level rise (and I have been doing consulting on this topic).
Why do I think an independent assessment of the sea level rise issue by yours truly is needed, given the plethora of international and national assessment reports? My clients are concerned about the alarmist predictions they have encountered. I have seen various ‘experts’ make public statements projecting 21stcentury sea level to be as high as 9 m [30 feet]. My clients are looking for someone that they trust to provide an objective assessment that focuses on their issues of concern.
The levels of oxygen dramatically rose in the atmosphere around 2.4 billion years ago, but why it happened then has been debated. Some scientists think that 2.4 billion years ago is when organisms called cyanobacteria first evolved, which could perform oxygen-producing (oxygenic) photosynthesis.
Other scientist think that cyanobacteria evolved long before 2.4 billion years ago but something prevented oxygen from accumulating in the air.
Cyanobacteria perform a relatively sophisticated form of oxygenic photosynthesis — the same type of photosynthesis that all plants do today. It has therefore been suggested that simpler forms of oxygenic photosynthesis could have existed earlier, before cyanobacteria, leading to low levels of oxygen being available to life.
Now, a research team led by Imperial College London have found that oxygenic photosynthesis arose at least one billion years before cyanobacteria evolved. Their results, published in the journal Geobiology, show that oxygenic photosynthesis could have evolved very early in Earth’s 4.5-billion-year history.