Uncertain Certainty: Germany’s Potsdam Climate Institute Humiliated After One-Year El Nino Forecast Model Flops

by P. Gosselin, Nov 15, 2020 in WUWT


Last year Germany’s Potsdam Institute (PIK) boasted that it had a superior El Niño one-year forecasting model, claiming 80% certainty. Today, a year later, its forecast emerges totally wrong and the prestigious institute is left humiliated. 

Hat-tip: Snowfan

In 2019, Germany’s Potsdam Climate Institute (PIK) boasted that it had a superior El Niño forecasting model, claiming one year in advance and with 80% certainty, there would be an El Niño event late in 2020 (upper curve is just an El Niño illustration). But the PIK model forecast flopped totally. The opposite has in fact emerged. Chart source: BOM (with additions).

One year ago, together with researchers of the Justus Liebig University Giessen (JLU), and Bar-Ilan University in Ramat Gan in Israel, Germany’s alarmist yet highly regarded Potsdam Institute for Climate Research (PIK) boldly declared in a press release there would “probably be another ‘El Niño’ by the end of 2020.”

East African Rift System is slowly breaking away, with Madagascar splitting into pieces

by Virginia Tech, Nov 13, 2020 in ScienceDaily


The African continent is slowly separating into several large and small tectonic blocks along the diverging East African Rift System, continuing to Madagascar — the long island just off the coast of Southeast Africa — that itself will also break apart into smaller islands.

These developments will redefine Africa and the Indian Ocean. The finding comes in a new study by D. Sarah Stamps of the Department of Geosciences for the journal Geology. The breakup is a continuation of the shattering of the supercontinent Pangea some 200 million years ago.

Rest assured, though, this isn’t happening anytime soon.

“The rate of present-day break-up is millimeters per year, so it will be millions of years before new oceans start to form,” said Stamps, an assistant professor in the Virginia Tech College of Science. “The rate of extension is fastest in the north, so we’ll see new oceans forming there first.”

Visualizing All of Earth’s Satellites: Who Owns Our Orbit?

by T. Wood, Oct 20, 2020 in VisualCapitalist


Visualizing All of Earth’s Satellites

For centuries, humans have looked to space and the stars for answers. The fascination is more than philosophical—it’s coupled with the need to solve problems here on Earth.

Today, there are seemingly countless benefits and applications of space technology. Satellites, for instance, are becoming critical for everything from internet connectivity and precision agriculture, to border security and archaeological study.

Space is Open for Business

Right now, there are nearly 6,000 satellites circling our tiny planet. About 60% of those are defunct satellites—space junk—and roughly 40% are operational.

As highlighted in the chart above, The Union of Concerned Scientists (UCS), determined that 2,666 operational satellites circled the globe in April of 2020.

Over the coming decade, it’s estimated by Euroconsult that 990 satellites will be launched every year. This means that by 2028, there could be 15,000 satellites in orbit.

Tree rings may hold clues to impacts of distant supernovas on Earth

by University of Colorado at Boulder, Nov 11, 2020 in ScienceDaily


Massive explosions of energy happening thousands of light-years from Earth may have left traces in our planet’s biology and geology, according to new research by University of Colorado Boulder geoscientist Robert Brakenridge.

The study, published this month in the International Journal of Astrobiology, probes the impacts of supernovas, some of the most violent events in the known universe. In the span of just a few months, a single one of these eruptions can release as much energy as the sun will during its entire lifetime. They’re also bright — really bright.

“We see supernovas in other galaxies all the time,” said Brakenridge, a senior research associate at the Institute of Arctic and Alpine Research (INSTAAR) at CU Boulder. “Through a telescope, a galaxy is a little misty spot. Then, all of a sudden, a star appears and may be as bright as the rest of the galaxy.”

A very nearby supernova could be capable of wiping human civilization off the face of the Earth. But even from farther away, these explosions may still take a toll, Brakenridge said, bathing our planet in dangerous radiation and damaging its protective ozone layer.

To study those possible impacts, Brakenridge searched through the planet’s tree ring records for the fingerprints of these distant, cosmic explosions. His findings suggest that relatively close supernovas could theoretically have triggered at least four disruptions to Earth’s climate over the last 40,000 years.

The results are far from conclusive, but they offer tantalizing hints that, when it comes to the stability of life on Earth, what happens in space doesn’t always stay in space.

“These are extreme events, and their potential effects seem to match tree ring records,” Brakenridge said.

.

Tree rings (stock image).
Credit: © CrispyMedia / stock.adobe.com

Modern Climate Change Science

by A. May, Nov 12, 2020 in WUWT


The first modern theoretical estimates of ECS were reported in 1979 in the so-called “Charney Report” (Charney, et al., 1979). They reported, on page 2, a theoretical ECS of 1.5°C to 4.5°C per doubling of the CO2 atmospheric concentration. This estimate included an estimate of water vapor feedbacks, the effect of ice and their assumed uncertainties. Absent any water vapor feedback their computed value was 1°C per doubling of CO2. They also supply a likely value of 2.4°C on page 9, although on page 2 they offer a value “near 3.0.” The page 9 value is not far off from the empirical estimate of 2°C made by Guy Callendar in 1938, but significantly higher than the 1.2°C to 1.95°C (17% to 83% range, best estimate 1.5°C) given by Nic Lewis and Judith Curry (Lewis & Curry, 2018).

The IPCC, in their AR5 report (Bindoff & Stott, 2013), estimate ECS as lying between 1.5°C and 4.5°C and provide no best estimate. This range is precisely the same as the Charney Report made 34 years earlier. While the empirical, observation-based, estimates have narrowed significantly, the theoretical range has not changed, despite thousands of government-funded scientists spending billions of dollars trying to do so. The data is very much the same today and churning it faster with more powerful computers and billions of dollars doesn’t seem to matter. It works the same way with manure.

Digging deeply into the AR5 internals, as Monckton, et al. did in MSLB15, a paper entitled, “Why Models run hot: results from an irreducibly simple climate model” (Monckton, Soon, Legates, & Briggs, 2015), we see that the elements of the AR5 theoretical calculations suggest that the range is narrowing in a downward direction. Given the political environment at the IPCC, one can easily suspect that the politicians do not want to admit the theoretical risks of CO2-caused climate change are lessening. As more empirical estimates of the CO2 effect appear and more theoretical work is done, one wonders how long the politicians can support the clearly inflated range of 1.5°C to 4.5°C?

Estimates of ECS have been declining for a long time, as shown in 2017 by Nicola Scafetta and colleagues. Figure 1 is from their paper:

The decline in estimates of ECS from 2000 to 2015. Source: Scafetta, Mirandola, and Bianchini, 2017.

MULTIPLE COLD RECORDS FELL IN CALIFORNIA MONDAY

by Cap Allon, Nov 10, 2020 in Electroverse


After months of EOTW articles regarding California’s summer heat and largely self-inflicted wildfires, record COLD has now swept The Golden State — and the MSM has fallen eerily quiet

Before Monday rewrote the record books in western California, back-to-back weekend storms on Friday and Sunday brought frigid temperatures and heavy snow to much of the state, reports ktvu.com.

A whopping 18 inches of snow blanketed the Sierra-at-Tahoe ski resort and a healthy 10 inches accumulated at Sugar Bowl over the weekend, prompting a travel advisory throughout the Sierra Nevada.

Weekend Snowfall Totals [ktvu.com].

Forwarding to Monday, a number of low temperature records were broken.

It dropped to 38F (3.3C) at the Oakland Airport Monday morning, a reading that smashed the old record of 41F set in 2009 (solar minimum of cycle 23).

Gilroy, located in Santa Clara County, also set new low Monday — the city’s official reading of 31F (-0.6C) in the early hours of Nov 9 busted the old record of 34F (1.1C) set back in 1986 (solar minimum of cycle 21).

How ancient dust from the sea floor helps to explain climate history

by UNIVERSITY OF OLDENBURG, Nov 11, 2020 in WUWT


During the last Ice Age about 20,000 years ago, iron-containing dust acted as a fertilizer for marine phytoplankton in the South Pacific, promoting CO2 sequestration and thus the glacial cooling of the Earth. But where did the dust come from? Researchers led by Dr. Torben Struve, geoscientist at the University of Oldenburg, Germany, have investigated this open question of climate history, which is also relevant with respect to current climate change.

Using sediment cores from the sea floor, they found that a large part of the dust deposited in the southern South Pacific at that time had travelled an extremely long way. Up to 80 percent of the dust came from what is now north-west Argentina, from where it was transported almost completely around the globe by the prevailing westerly winds. After a voyage of up to 20,000 kilometres, it contributed significantly to the increased input of iron into the glacial South Pacific. The dust input from Australia, which dominates in the South Pacific today, played only a minor role. The research team has published these new insights into the mechanisms of natural iron input into the Southern Ocean in the journal Nature Communications.

“We have analysed the chemical fingerprint of the dust and compared it with geological data from several continents. This was laborious work, like a jigsaw puzzle,” says Struve, a post-doctoral scientist in the research group “Marine Isotope Geochemistry” at the University’s Institute for Chemistry and Biology of the Marine Environment (ICBM). The team included researchers from his group as well as colleagues from the Alfred Wegener Institute – Helmholtz Centre for Polar and Marine Research, Bremerhaven (Germany), and from Columbia University, New York (USA).

North Atlantic Cycle Change? Northern Europe October Temperature Trends Suggest Autumn Coming Sooner

by P. Gosselin, Nov 11, 2020 in NoTricksZone


Today we look at October mean temperatures for the emerald island country of Ireland, the Scandinavian country of Sweden and Finland.

Global warming alarmists claim that the globe is warming, which intuitively would tell us summers should be getting longer, which in turn would mean the start of fall is getting pushed back. In such a case, September and October temperatures should be warming, but they are not!

Cooling Ireland

First we plot the mean temperature for 7 stations in Ireland for the month of October, for which the Japan Meteorological Agency (JMA) has sufficient data going back 25 years:

Data source: JMA

Seven of 7 stations in Ireland have seen a strong cooling trend for October since 1995.

NASA’S JAMES HANSEN, 1989: “NEW YORK CITY’S WEST SIDE HIGHWAY WILL BE UNDERWATER BY 2009”

by Cap Allon, Nov 5, 2020 in Electroverse


NASA climate scientist James Edward Hansen is where all this nonsense started–or at least he’s the one responsible for devising the hokey theory politicians, activists, and political-activists would go on to fall-for/exploit for decades to come.

“The greenhouse effect is here,” pronounced Hansen back on June 23, 1988 during his Congressional testimony on man-made global warming — an announcement that “shook the political establishment,” reported grist.org. George H. W. Bush, in the middle of a heated presidential campaign, vowed to use the “White House effect” to battle the “greenhouse effect.”

Hansen had told the Senate Energy and Natural Resources Committee there is only a “1 percent chance” that he is wrong in blaming rising temperatures around the world on the buildup of man-made gases in the atmosphere.

A 1 percent chance that he is wrong?

In a field as complex and unknown as Earth’s climate?

When many of his peers and even colleagues at the time were already casting doubt on his assumptions and “leaps”?

Something was off from the very start.

And so to highlight what a soothsayer James Edward Hansen is not, I’ve compiled a few of the man’s ludicrous -and in many cases laughable- predictions below–oh, and I’ve assumed Hansen applied a 99 percent probability to all of his prophesies, because, well, why wouldn’t he of… the man presents all the confidence of one in contact with a divine being.

HANSEN, 1989: “NEW YORK CITY’S WEST SIDE HIGHWAY UNDERWATER BY 2009”

Fake Invisible Catastrophes & Threats of Doom

by P. Moore, Sept 24, 2020 in Gofundme


I am a co-founder Of Greenpeace in 1971-1986. I left because they became a fundraising racket using sensationalism, misinformation and fear. I became a sensible environmentalist and have spent 36 years promoting the balance of environmental, social and economic priorities. I am writing a new book based on the fact that most of the scare stories today are based on things that are invisible or remote or both. Therefore the public must rely on activists, media, politicians, and scientists, all who have a huge financial and/or political stake in the “narrative” they are pushing. This includes climate, tree, coral reefs, polar bears, GMOs, extinction, etc.
The book is based on this essay:
https://www.dropbox.com/s/u9dd56qo16naqcy/Fake%20Invisible%20Catastrophes%20and%20Threats%20of%20Doom%20%28Essay%29.docx?dl=0

The Guardian: Joe Biden’s $1.7 Trillion Investment Could Reduce Global Warming by 0.1C

by E. Worall, Nov 8, 2020 in WUWT


The Guardian has inadvertently revealed the utter futility of throwing trillions of dollars of borrowed government money into the bottomless renewable energy pit.


Hey I can play this game too – if I get $1700 of that cash, I promise to cut back on eating Chilli beef. Paying a billion people to eat less chilli beef would likely have a comparable impact on global warming to spending the money on renewables. The EPA estimates CH4 accounts for 10% of observed global warming. The study I linked estimates human activity like raising beef cattle and eating chilli beans is responsible for up to 40% of detected CH4 emissions.

Alternatively the cash could be used to give all the cattle in the world that special seaweed supplement the CSIRO discovered, which is supposed to cut back on intestinal methane production.

To put this level of expenditure into perspective, the cost of launching a 0.03C manned mission to Proxima Centauri using technology developed in the 1950s has been estimated at around $2 trillion. I’m not saying that building a starship is a reasonable use of $2 trillion of taxpayer’s money, but the first step in mankind’s expansion throughout the galaxy would surely be a lot more fun than spending all that money on reducing global temperature by an amount which cannot even be directly measured.

And of course, the obvious point – if it costs $1.7 trillion to reduce global warming by 0.1C, we now have a Guardian provided method of estimating the cost of eliminating our alleged impact on the global climate, reducing global warming by 1.0C: 1.7 x 1.0C / 0.1C = $17 trillion.

Perhaps the dumbest article title ever: “The Arctic hasn’t been this warm for 3 million years”… AEUHHH???

by D. Middleton, Nov 6, 2020 in WUWT


The sad thing is that this was apparently written by two geoscience professors.


Figure 1. “The oxygen isotopes in the ice imply that climate was stable during the last interglacial period, with temperatures 5 °C warmer than today.” North Greenland Ice Core Project members, 2004

How to Scare and Deceive without Lying: JPL Cries Wolf about Polar Glacial Melt

by C. Beisner, Nov 6, 2020 in WUWT


Yesterday NASA’s Jet Propulsion Laboratory published “The Anatomy of Glacial Ice Loss.” For the most part it’s an interesting, though not particularly revolutionary, discussion of the various forces that add to and subtract from glacial ice. Nothing wrong with that.

But its authors took the opportunity to insert a poison pill, a little bit of fearmongering, in a video caption:

Did you catch that little trick? “Combined, the two regions also contain enough ice, that if it were to melt all at once, would raise sea levels by nearly 215 feet ….”

Well, yes, but at what rate is the ice from the two regions melting, and at what rate can we, with any confidence, predict they’ll continue to melt, and over what period of time?

There is absolutely no chance of their melting “all at once”—barring, I suppose, Earth’s collision with some enormous asteroid that sends Earth careening into the Sun!

So, how fast is the ice melting?

For Greenland, about 0.1% of its ice mass per decade—1 percent per century.

For Antarctica, about 0.0045% per decade—1% in 2,200 years.

Combined, those contribute to sea-level rise of about 1 mm per year, i.e., 3.94 inches per century.

(See “Lying with Statistics: The National Climate Assessment Falsely Hypes Ice Loss in Greenland and Antarctica.”)

So, if the actual rate is about 3.94 inches (0.3283 foot) per century, how long would it take to raise sea level by 215 feet? The answer: 215 ft. / 0.3283 ft. per century = 654.889 centuries, or 65,488.9 years.

New Study Effectively Eliminates Confidence In Human Attribution For Modern Global Warming

by K. Richard, Nov 5, 2020 in NoTricksZone


The forcing uncertainties and lack of observational measurements in the top-to-bottom global ocean preclude an assessment that modern warmth is due to anthropogenic activities.

Key points from a new paper (Gebbie, 2021):

• 93% of the changes to the Earth’s energy budget, manifested as warming of the Earth system, are expressed in the global ocean. Just 1% of global warming is atmospheric.

• Even with the advent of “quasi-global” temperature sampling of the ocean since 2005 (ARGO), these floats “do not measure below 2,000-m depth.” This means that temperature changes in “approximately half the ocean’s volume” are still not being measured today.

• To detect the effects of anthropogenic forcing, it would require energy budget imbalance measurement precision of 0.1 W/m² at the top of the atmosphere (TOA). Uncertainty in the forcing changes affecting climate are ±4 W/m², meaning that uncertainty is about 80 times greater than an anthropogenic signal detection.

• Past changes in global ocean heat content, such as the last deglaciation, have been 20 times larger than modern changes.

• Ocean heat storage during the Medieval Warm Period (Medieval Climate Anomaly, or MCA) was much greater than modern. Modern global ocean heat uptake is “just one-third” of what is required to reach the levels attained during Medieval times.

Sea level rise and Antarctica

by Jim Steele, Nov 4, 2020 in WUWT


California’s and other American coastal towns are engaged in divisive arguments regards rising sea levels. Although observed sea levels rose less than 8 inches (0.08 inches per year) since 1900, some modelers forecast much bleaker futures. They predict a 2.4-foot rise for every 1°F rise above preindustrial temperatures, then accelerating to nearly 4.5 feet for every 1°F additional increase. Why a dramatic acceleration in sea level? It’s based primarily on dire models, typically presented to coastal planning commissions as ‘best science’, suggesting increasing ice instability and Antarctica ice sheet collapse. “Antarctica has the potential to contribute more than 3.3 feet of sea-level rise by 2100 and more than 49 feet by 2500.”

Those models have prompted some citizens to argue we must abandon the coasts via managed retreat. Others argue we should build better sea walls. But how high? Others rightfully ask, “how trustworthy are those models?” Model predictions of a collapsing Antarctica ice sheet are not based on observations.  Models of Antarctica’s catastrophic ice collapse are attempts to explain ancient sea levels such as the 30-foot higher levels 120,000 years ago.

There are good reasons toquestion catastrophic models. For one, away from the coast Antarctica’s surface temperatures average −70 °F. Antarctica’s extremely cold surfacesrequire global warming to increase many, many times more before surface glaciers could ever melt. For another, although greenhouse theory predicts increasing CO2  concentrations will raise temperatures, greenhouse theory also predicts added CO2  has a cooling effect on Antarctica (Wijngaarden & Happer 2020, Schmithüsen 2015).


The cement for coral reefs

by University of Erlangen-Nuremberg  Nov 2020, in ScienceDaily


Coral reefs are hotspots of biodiversity. As they can withstand heavy storms, they offer many species a safe home, and at the same time, they protect densely populated coastal regions as they level out storm-driven waves. However, how can these reefs that are made up of often very fragile coral be so stable? A team of researchers from Friedrich-Alexander Universität Erlangen-Nürnberg (FAU) and the University of Bayreuth have now discovered that a very specific type of ‘cement’ is responsible for this — by forming a hard calcareous skeleton, coralline red algae stabilise the reefs, and have been doing so for at least 150 million years.

The wide variety of life they support is immediately apparent on images of tropical coral reefs. Their three-dimensional scaffolding provides a habitat for a large number of species. However, the skeletons of the coral are often so fragile that they would not be able to withstand heavy storms by themselves. Even if scientists have long suspected that coralline red algae provide support to reefs with their calcareous skeletons, this is the first time that this link has been proven.

Coralline red algae have been supporting coral reefs for at least 150 million years

The researchers from FAU and the University of Bayreuth were able to prove this supporting function by analysing more than 700 fossilised reefs from 150 million years of the Earth’s history. ‘The coralline red algae form a calcareous skeleton and cement the coral reefs together,’ explains Dr. Sebastian Teichert from the Chair of Palaeoenvironmental Research at FAU. ‘However, several crises over the course of millions of years have limited their capacity to do so.’

Successful adaptive strategies against plant grazers


After nearly a decade away, La Niña weather system is back…

by C. Rotter, nov 1, 2020 in WUWT

Many will be familiar with El Niño – the ocean-warming phenomenon that affects global weather patterns – but how about La Niña, which is linked to cooler sea temperatures?

According to the World Meteorological Organization (WMO), La Niña is back in the central and eastern equatorial Pacific Ocean, after nearly a decade’s absence.

UNDP/Joe HitchcockThe low-lying island Pacific Ocean nation, Tuvalu, is particularly susceptible to a rise in sea levels caused by climate change.    29 October 2020Climate Change

This is expected to result in sea surface temperatures between two and three degrees Celsius cooler than average, said Dr. Maxx Dilley, Deputy Director in charge of Climate Services Department at WMO.

“These coolings of these large ocean areas have a significant effect on the circulation of the atmosphere that’s flowing over them. And the changes in the atmosphere in turn affect precipitation patterns around the world.”

Uneven effects

Study suggests no more CO2 warming

by C. Rotter, Oct 26, 2020 in WUWT


By David Wojick |October 26th, 2020|Climate

Precision research by physicists William Happer and William van Wijngaarden has determined that the present levels of atmospheric carbon dioxide and water vapor are almost completely saturated. In radiation physics the technical term “saturated” implies that adding more molecules will not cause more warming.

In plain language this means that from now on our emissions from burning fossil fuels could have little or no further impact on global warming. There would be no climate emergency.  No threat at all. We could emit as much CO2 as we like; with no effect.

This astounding finding resolves a huge uncertainty that has plagued climate science for over a century. How should saturation be measured and what is its extent with regard to the primary greenhouse gases?

In radiation physics the term “saturation” is nothing like the simple thing we call saturation in ordinary language, just as the greenhouse effect is nothing like how greenhouses work. Your paper towel is saturated when it won’t pick up any more spilled milk. In contrast greenhouse gases are saturated when there is no more milk left to pick up, as it were, but it is far more complex than this simple analogy suggests.

Happer is probably best known to our readers as a leading skeptical scientist. He co-founded the prestigious CO2 Coalition and recently served on the staff of the National Security Council, advising President Trump. But his career has been as a world class radiation physicist at Princeton. His numerous peer reviewed journal articles have collectively garnered over 12,000 citations by other researchers.

In this study Professors Happer and van Wijngaarden (H&W) have worked through the saturation physics in painstaking detail. Their preprint is titled “Dependence of Earth’s Thermal Radiation on Five Most Abundant Greenhouse Gases“. They have gone far beyond the work done to date on this complex problem.

To begin with, while the standard studies treat the absorption of radiation by greenhouse molecules using crude absorption bands of radiation energy, H&W analyze the millions of distinct energies, called spectral lines, which make up these bands. This line by line approach has been an emerging field of analysis, often giving dramatically new results.

….

….

Clearly this is work that the climate science community needs to carefully consider. This may not be easy given that three major physics journals have refused to publish it. The reviews have been defensive and antagonistic, neither thoughtful nor helpful. Alarmism is in control of the journals, censoring contrary findings, hence the preprint version.

3 More New Studies Show Modern Arctic Sea Ice Extent Is Greater Than Nearly Any Time In The Last 10,000 Years

by K. Richard, Oct 29, 2029 in NoTricksZone


For years scientists have been using biomarker evidence (IP25, PIP25) to reconstruct the Arctic’s sea ice history. The evidence shows modern (20th-21st century) Arctic sea ice is at its greatest extent since the Holocene began.

Scientists (Wu et al., 2020) have determined that from about 14,000 to 8,000 years ago, when CO2 lingered near 250 ppm, the Beaufort Sea (Arctic) was “nearly ice free throughout the year” (<0.2 PIP25) and ~4°C warmer than today in winter.

With CO2 at ~400 ppm, this region is 70-100% ice-covered (>0.8 PIP25) for all but 1-2 summer months in the modern (1988-2007) era.

….

Roger Revelle – the backstory of the father of Atmospheric CO2 monitoring

by A. May, Oct 321, 2020 in WUWT


Roger Revelle was an outstanding and famous oceanographer. He met Al Gore, in the late 1960s, when Gore was a student in one of his classes at Harvard University. Revelle was unsure about the eventual impact of human carbon dioxide emissions on climate, but he did show that all carbon dioxide emitted by man would not be absorbed by the oceans. For an interesting discussion of Revelle’s work in this area see this post on “The Discovery of Global Warming,” by Spencer Weart (Weart, 2007). The original paper, on CO2 absorption by the oceans, published in 1957 by Roger Revelle and Hans Suess, is entitled: “Carbon Dioxide Exchange Between Atmosphere and Ocean and the Question of an Increase of Atmospheric CO2, during the Past Decades” (Revelle & Suess, 1957). This meant that human emissions of carbon dioxide would accumulate in the atmosphere and that the CO2 atmospheric concentration would increase, probably causing Earth’s surface to warm at some unknown rate. This is not an alarming conclusion, as Revelle well knew, but Al Gore turned it into one.

One of Revelle’s good friends was Dr. S. Fred Singer. Singer was a professor of environmental science at the University of Virginia and both Revelle and Singer had been science advisors in the U.S. Department of the Interior. They first met in 1957 and were more than professional colleagues, they were personal friends (Singer, 2003). Unfortunately, Revelle passed away in July 1991 and Singer passed away in April 2020, so we will refer to them and their friendship in the past tense. Both were leading Earth scientists and at the top of their fields, it was natural they would become friends. They also shared an interest in climate change and chose to write an article together near the end of Revelle’s life.


Indeed, ten years later, CO2 emissions were still increasing, but the world had started to cool as shown in Figure 1. This casts considerable doubt on the idea that human emissions somehow control global warming, since some other factor, presumably natural, is strong enough to reverse the overall warming trend for ten years. Revelle was correct to encourage the government to wait for ten more years. Just a year before their paper was published the IPCC reported that warming to date fell within the range of “natural variability” and that the detection of a human influence on climate was “not likely for a decade or more.” (IPCC, 1990, p. XII).

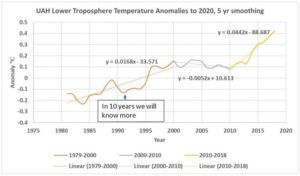
Figure 1. In 1990 and 1991, respectively, the IPCC and Roger Revelle and colleagues said it was too early to do anything about possible man-made climate change, they thought we would know more in 10 years. The plot is smoothed with a 5-year running average to reduce the effect of El Nino and La Nina events. This makes the longer term trends easier to see.

The West Intends Energy Suicide: Will It Succeed?

by T. Doshi, Oct 10, 2020 in Forbes


Suicide is viewed as a crime in many countries. In a court of law, it is a serious charge and the evidence needs to be conclusive for such an accusation to stand (e.g., did you actually see him attempt to jump off the bridge?). But when societies (or at least their leaders) attempt it, one can say that it safely falls under the rubric of the sovereign right to misrule. In the hallowed tradition of Western liberal democracy, so long as its political leaders are elected in free and fair elections, misrule leading to societal death by suicide is merely an unfortunate outcome of either gross negligence or culpable intention led by, say, an ideology of de-industrialization. Nevertheless, let us proceed with the case for the prosecution.

The Circumstantial Evidence Of Societal Suicide

The first piece of evidence is an astonishing article published last week in the Boston Review by a professor of anthropology in Rutgers University . The good professor opined that Zimbabwe and Puerto Rico “provide models for what we might call ‘pause-full’ electricity”. The West, he continues, has created a vast infrastructure for generating and consuming electricity 24/7, 365 days a year. Since this is based on “planet-destroying fossil fuels and nuclear power”, we need to emulate the aforementioned poor countries and save the climate by giving up the demand for the constant supply of electricity.

To be fair, the professor also noted that the Zimbabweans and Puerto Ricans did not choose to accept electricity rationing but were imposed upon by the gross negligence and corruption of their governments. The professor cannot be lightly dismissed, and the Boston Review shares its domicile with MIT and Harvard University, the temples of wisdom in modern Western civilization. And the Review has its share of kudos, at least for those of a particular persuasion: “When it comes to publishing fresh and generative ideas, Boston Review has no peer” says Robin D. G. Kelley, Professor of American History at the University of California, Los Angeles and Naomi Klein, activist and New York Times NYT-0.5% best-selling author, opines that “Boston Review is so good right now.”

Let us move on to our second piece of evidence, this time from the other side of the “climate emergency” aisle.  Professor Fritz Vahrenholt is a giant among environmental circles in Germany. (The country is well known as the world’s leading champion for all things environmental and for pushing Europe to “net zero emissions by 2050”.) Prof. Vahrenholt holds a doctorate in chemistry and started his professional career at the Federal Environmental Agency in Berlin (responsible for the chemical industry) before joining the Hessian Ministry of the Environment. From 1984 until 1990 he served as state secretary for environment, from 1991 till 1997 as minister for energy and environment in the state of Hamburg.

One day before the publication of the Boston Review article on October 5th, Prof Vahrenholt stated baldly in a German TV interview that climate science was “politicized”, “exaggerated”, and filled with “fantasy” and “fairy tales”. He pronounced that “The [Paris] Accord is already dead. Putin says it’s nonsense. […] The Americans are out. The Chinese don’t have to do anything. It’s all concentrated on a handful of European countries. The European Commission in massively on it. And I predict that they will reach the targets only if they destroy the European industries.” He lambasted Germany as a country “in denial when it comes to the broader global debate taking place on climate science”. He went on to characterize Europe’s recent push for even stricter emissions reduction targets to madness akin to Soviet central planning that is doomed to fail spectacularly.

Les chercheurs prenant le plus l’avion sont… les experts du climat

by Le Point, Oct 29,  2020


Selon une étude britannique, les climatologues voyagent en moyenne davantage en avion que les scientifiques spécialisés dans d’autres domaines.

Les arroseurs arrosés. Les climatologues alertent régulièrement et, à raison, sur les effets sur le climat des déplacements en avion, fortement émetteurs de gaz à effet de serre. Mais une étude publiée en ce mois d’octobre dans la revue Global Environmental Change vient mettre le doigt sur certains de leurs comportements. Selon cette étude britannique coordonnée par l’université de Cardiff, et relayée par Nature et Courrier International, les experts en réchauffement climatique sont les scientifiques qui voyagent le plus souvent en avion, en comparaison avec leurs collègues d’autres disciplines. Au total, plus de 1 400 chercheurs, provenant de 59 pays différents et de domaines scientifiques divers, ont été interrogés.

En moyenne, les experts du climat, qui représentaient environ 17 % des personnes sollicitées, prennent l’avion à raison de cinq fois par an. En comparaison, les chercheurs spécialisés dans d’autres disciplines disent effectuer quatre trajets par an en avion. Les vols effectués par les climatologues sont davantage domestiques qu’internationaux. Toutefois, ils avancent souvent des raisons professionnelles pour ces trajets, ce qui n’est pas forcément le cas de leurs autres collègues scientifiques. Les professeurs spécialisés dans le dérèglement climatique voyagent en avion environ neuf fois par an en moyenne, contre huit fois pour leurs collègues d’autres spécialités.

“Where’s the sea ice?” Right where it’s been for most of the Holocene.

by D. Middleton, Oct 30, 2020 in WUWT


This is sort of a sequel yesterday’s post: Where’s the sea ice? 3 reasons the Arctic freeze is unseasonably late and why it matters.

What a difference a day can make! Looks like it’s starting to crust over:

Figure 0. Daily sea ice extent map, October 29, 2020. (NSIDC)

Two key takeaways:

  1. Maximum Holocene sea ice extent occurred within the past 500-1,000 years at every location.
  2. The current sea ice extent is higher at all of the locations than over 50% to 85% of the Holocene.

While this doesn’t tell us what the sea ice extent was in million km2, it does tell us that the modern sea ice extent is larger than it was over most of the Holocene Epoch. It also tells us that the areas of currently seasonal sea ice extent have been seasonal or reduced over most of the past 5,000 years and ice-free or nearly ice-free over the prior 3,000 years or so. Here’s is the Kinnard graph plotted at the same horizontal scale as the Stein cross section:

Can China, the world’s biggest coal consumer, become carbon neutral by 2060?

by D. Normile, Sep 29, 2020 in Science AAAS


China’s surprise pledge last week to cut its net carbon emissions to zero within 40 years has reignited hopes of limiting global climate change to tolerable levels. The country is the world’s largest producer of carbon dioxide (CO2), accounting for 28% of global emissions, and its move may inspire other countries to follow suit. But observers warn that China faces daunting challenges in reaching its goals. Kicking its coal habit will be particularly hard.

“We aim to have CO2 emissions peak before 2030 and achieve carbon neutrality before 2060,” Chinese President Xi Jinping told the United Nations General Assembly via a video link on 22 September. That’s “a very significant and encouraging announcement,” says Josep Canadell, an earth system scientist at Australia’s Commonwealth Scientific and Industrial Research Organisation. He says the new targets “won’t likely let us to stop at 1.5° Celsius [of global warming],” the preferred target set in the 2015 Paris agreement. “But below 2° might still be consistent with [Xi’s] announcement.” China’s commitment also “ratchets up pressure on other major emitters” to set more ambitious targets “while further isolating the Trump administration in its climate myopia,” Vance Wagner of Energy Foundation China wrote in a piece published online by the nonprofit China Dialogue.

China had previously said its CO2 emissions would peak “around” 2030, a target most analysts considered within reach. But achieving carbon neutrality before 2060 will require drastically reducing the use of fossil fuels in transportation and electricity generation and offsetting any remaining emissions through carbon capture and storage or planting forests.

La géologie, une science plus que passionnante … et diverse