Biden’s climate ‘fix’ is fantastically expensive and perfectly useless-Bjorn Lomborg

by P. Homewood, Feb 214, 2021 in NotaLotofPeopleKnowThat


Across the world, politicians are going out of their way to promise fantastically expensive climate policies. President Biden has promised to spend $500 billion each year on climate — about 13 percent of the entire federal revenue. The European Union will spend 25 percent of its budget on climate.

Most rich countries now promise to go carbon-neutral by mid-century. Shockingly, only one country has made a serious, independent estimate of the cost: New Zealand found it would optimistically cost 16 percent of its GDP by then, equivalent to the entire current New Zealand budget.

The equivalent cost for the US and the EU would be more than $5 trillion. Each and every year. That is more than the entire US federal budget, or more than the EU governments spend across all budgets for education, recreation, housing, environment, economic affairs, police, courts, defense and health.

Tellingly, the European Commission Vice President Frans Timmermans recently admitted that climate policies would be so costly, it would be a “matter of survival for our industry” without huge, protective border taxes.

Climate change is a real, manmade problem. But its impacts are much lower than breathless climate reporting would suggest. The UN Climate Panel finds that if we do nothing, the total impact of climate in the 2070s will be equivalent to reducing incomes by 0.2-2 percent. Given that by then, each person is expected to be 363 percent as rich as today, climate change means we will “only” be 356 percent as rich. Not the end of the world.

Climate policies could end up hurting much more by dramatically cutting growth. For rich countries, lower growth means higher risks of protests and political breakdown. This isn’t surprising. If you live in a burgeoning economy, you know that you and your children will be much better off in the coming years. Hence, you are more forgiving of the present.

….

More trees do not always create a cooler planet, Clark University geographer finds

by Clark University, Feb 14, 203221 in WUWT


WORCESTER, Mass. — New research by Christopher A. Williams, an environmental scientist and professor in Clark University‘s Graduate School of Geography, reveals that deforestation in the U.S. does not always cause planetary warming, as is commonly assumed; instead, in some places, it actually cools the planet. A peer-reviewed study by Williams and his team, “Climate Impacts of U.S. Forest Loss Span Net Warming to Net Cooling,” published today (Feb. 12) in Science Advances. The team’s discovery has important implications for policy and management efforts that are turning to forests to mitigate climate change.

It is well established that forests soak up carbon dioxide from the air and store it in wood and soils, slowing the accumulation of greenhouse gases in the atmosphere; however, that is not their only effect on climate. Forests also tend to be darker than other surfaces, said Professor Williams, causing them to absorb more sunlight and retain heat, a process known as “the albedo effect.”

“We found that in some parts of the country like the Intermountain West, more forest actually leads to a hotter planet when we consider the full climate impacts from both carbon and albedo effects,” said Professor Williams. It is important to consider the albedo effect of forests alongside their well-known carbon storage when aiming to cool the planet, he adds.

Urban Heat Island Effects on U.S. Temperature Trends, 1973-2020: USHCN vs. Hourly Weather Stations

by Roy Spencer, Feb 11, 2021 in GlobalWarming


SUMMARY: The Urban Heat Island (UHI) is shown to have affected U.S. temperature trends in the official NOAA 1,218-station USHCN dataset. I argue that, based upon the importance of quality temperature trend calculations to national energy policy, a new dataset not dependent upon the USHCN Tmax/Tmin observations is required. I find that regression analysis applied to the ISD hourly weather data (mostly from airports)  between many stations’ temperature trends and local population density (as a UHI proxy) can be used to remove the average spurious warming trend component due to UHI. Use of the hourly station data provides a mostly USHCN-independent measure of the U.S. warming trend, without the need for uncertain time-of-observation adjustments. The resulting 311-station average U.S. trend (1973-2020), after removal of the UHI-related spurios trend component, is about +0.13 deg. C/decade, which is only 50%  the USHCN trend of +0.26 C/decade. Regard station data quality, variability among the raw USHCN station trends is 60% greater than among the trends computed from the hourly data, suggesting the USHCN raw data are of a poorer quality. It is recommended that an de-urbanization of trends should be applied to the hourly data (mostly from airports) to achieve a more accurate record of temperature trends in land regions like the U.S. that have a sufficient number of temperature data to make the UHI-vs-trend correction.

The Urban Heat Island: Average vs. Trend Effects

In the last 50 years (1970-2020) the population of the U.S. has increased by a whopping 58%. More people means more infrastructure, more energy consumption (and waste heat production), and even if the population did not increase, our increasing standard of living leads to a variety of increases in manufacturing and consumption, with more businesses, parking lots, air conditioning, etc.

UK National Temperature record at Cambridge Botanic Garden –An examination of the data.

by C. Rotter, Feb 13, 2021 in WUWT


Guest Post by Tony Brown

Section 1 Introduction

A visit to the Botanical gardens in Cambridge was made by the author of this paper on August 7th 2020 between 10.15AM to 12.25pm.  The purpose was to look at the site of the Stevenson screen there,  following the establishment at this location of the highest ever recorded UK instrumental  temperature, confirmed by the Met Office as 38.7 C ( 101.6 Fahrenheit ) taken at the gardens on 25 July 2019, and to determine the possible effects on this record caused by urbanisation.  From the botanic garden web site we note:

 “Analysis of the Garden’s weather records show that over the last 100 years our average temperature has risen by 1.2 Celsius and the hottest day, highest monthly and yearly average have all occurred within the last 20 years. The highest ever temperature recorded at the Garden before this new record was 36.9 C, recorded on 10 August, 2003.”  * See; “Section 5; Temperature trends.”

Cambridge University Botanic Garden records highest ever UK temperature – Cambridge Botanic Garden

Some context is provided by firstly examining the past and present urbanisation of the gardens, the location of the Stevenson screen and there then follows an examination of various temperature recordings locally to determine what affect if any the urbanisation may have had.

The visit  was  made during one of the hottest spells of the 2020 summer and  in similar conditions to the record, in as much it had been hot in the days running up to the record with  prolonged sunshine and light winds and these were mirrored on the day of the visit. The preceding day, August 6th 2020 was partially cloudy and very warm at 27C, close by at Cambridge Airport.

China Facing Winter Blackouts

by P. Homewood, Dec 23, 2020 in NotaLotofPeopleKnowThat


There’s an interesting story emerging from China:

BEIJING: Tens of millions across China are facing power shortages in below-freezing winter temperatures, as three provinces impose curbs on electricity use due to surging demand and a squeezed coal supply.

Residents, factories and businesses in Hunan, Zhejiang and Jiangxi provinces have been ordered to ration electricity with some areas citing a shortfall in coal supplies, according to local media reports and government notices.

China’s rebound from the Covid-19 pandemic has been driven by energy intensive industries such as construction, heaping pressure on the power grid and coal supplies, said Lauri Myllyvirta, lead analyst at the Centre for Research on Energy and Clean Air.

Earlier this month, Hunan authorities ordered all billboards and outdoor lighting on buildings to power off for long periods each day and a temperature cap on indoor heating at entertainment venues.

Hunan faces a shortfall of 3-4 million kilowatts of electricity this winter, local officials admitted last week, as demand soars due to unusually cold weather that will hit as low as -10°C.

Office workers in provincial capital Changsha complained on social media about being forced to climb dozens of flights of stairs and freezing indoor temperatures as a result of frequent power outages.

“My office heating has already been stopped, and there were blackouts on Dec 1, 3 and 5. Temperatures will drop to -8°C around New Year’s Day, will I freeze to death in Hunan?” one Weibo user wrote last week.

Meanwhile in Zhejiang province, factories in the manufacturing hub of Yiwu have been told to stop operations and streetlights have been turned off at night as part of an emissions-saving drive by the local government, according to media reports and photos circulated on Weibo.

Polar bear sea ice habitat highs and lows in early February

by Polar Bear Science, Feb 10, 2021


Sea ice across the Arctic in the first week of February is a mix of highs and lows. Bering Sea is back up to almost normal coverage, as is the Barents Sea. However, ice coverage on the East Coast of Canada is the lowest its been in four decades. This is not yet a worry for polar bears because harp seals don’t pup until mid-March in this region so there is at least four weeks of potential ice growth that can happen before the seals are forced to pup on much reduced ice – where polar bears are sure to find them.

CMIP6 and AR6, a preview

by Andy May, Feb 11, 2021 in WUWT


The new IPCC report, abbreviated “AR6,” is due to come out between April 2021 (the Physical Science Basis) and June of 2022 (the Synthesis Report). I’ve purchased some very strong hip waders to prepare for the events. For those who don’t already know, sturdy hip waders are required when wading into sewage. I’ve also taken a quick look at the CMIP6 model output that has been posted to the KNMI Climate Explorer to date. I thought I’d share some of what I found.

India to overtake EU as world’s third largest energy consumer by 2030: IEA

by P. Homewood, Feb 20, 2021 in NotaLofPeopleKnowThat


India will overtake the European Union as the world’s third-largest energy consumer by 2030, the International Energy Agency (IEA) said on Tuesday as it forecast India accounting for the biggest share of energy demand growth over the next two decades.

In its India Energy Outlook 2021, IEA saw primary energy consumption almost doubling to 1,123 million tonnes of oil equivalent as the Gross Domestic Product (GDP) expands to USD 8.6 trillion by 2040.

India at present is the fourth-largest global energy consumer behind China, the United States and the European Union.

Underpinned by “a rate of GDP growth that adds the equivalent of another Japan to the world economy by 2040”, India will overtake the European Union by 2030 to move up to the third position, it said in the report.

India accounts for nearly one-quarter of global energy demand growth from 2019-40 — the largest for any country. Its share in the growth in renewable energy is the second-largest in the world, after China, IEA said.

“By 2040, India’s power system is bigger than that of the European Union, and is the world’s third-largest in terms of electricity generation; it also has 30 per cent more installed renewables capacity than the United States,” it said.

A five-fold increase in per capita car ownership will result in India leading the oil demand growth in the world. Also, it will become the fastest-growing market for natural gas, with demand more than tripling by 2040.

Hematite reconstruction of Late Triassic hydroclimate over the Colorado Plateau

by Lepre, J & Olsen P.E., Feb 21, 2021 PNAS


Significance

Hematite provides much of the color for the classic Triassic–Jurassic “red beds” of North America and elsewhere. Measuring the spectrum of visible light reflected and absorbed by the red beds, we demonstrate that the hematite concentrations faithfully track 14.5 million years of Late Triassic monsoonal rainfall over the Colorado Plateau of Arizona and use this information to assess interrelationships between environmental perturbations, climate, and the evolution of terrestrial vertebrates. The research challenges conventional ideas that the hematite has limited use for interpreting the ancient past because it is a product of natural chemical alterations that occurred long after the beds were initially deposited.

Abstract

Hematite is the most abundant surficial iron oxide on Earth resulting from near-surface processes that make it important for addressing numerous geologic problems. While red beds have proved to be excellent paleomagnetic recorders, the early diagenetic origin of hematite in these units is often questioned. Here, we validate pigmentary hematite (“pigmentite”) as a proxy indicator for the Late Triassic environment and its penecontemporaneous origin by analyzing spectrophotometric measurements of a 14.5-My–long red bed sequence in scientific drill core CPCP-PFNP13-1A of the Chinle Formation, Arizona. Pigmentite concentrations in the red beds track the evolving pattern of the Late Triassic monsoon and indicate a long-term rise in aridity beginning at ∼215 Ma followed by increased oscillatory climate change at ∼213 Ma. These monsoonal changes are attributed to the northward drift of the Colorado Plateau as part of Laurentia into the arid subtropics during a time of fluctuating CO2. Our results refine the record of the Late Triassic monsoon and indicate significant changes in rainfall proximal to the Adamanian–Revueltian biotic transition that thus may have contributed to apparent faunal and floral events at 216 to 213 Ma.

Delingpole: Study Disputes That Earth Is in a ‘Climate Emergency’

by P. Homewood, Feb 9, 2021 in NotaLotofPeopleKnowThat


There is no “climate emergency”, according to a study for the Global Warming Policy Foundation by independent scientist Dr Indur Goklany.

Goklany concludes:

While climate may have changed for the warmer:

• Most extreme weather phenomena have not become more extreme, more deadly, or more destructive

• Empirical evidence directly contradicts claims that increased carbon dioxide has reduced human wellbeing. In fact, human wellbeing has never been higher

• Whatever detrimental effects warming and higher carbon dioxide may have had on terrestrial species and ecosystems, they have been swamped by the contribution of fossil fuels to increased biological productivity. This has halted, and turned around, reductions in habitat loss

The report will make hugely depressing reading for all the prominent environmental activists — from the Pope and Doom Goblin Greta Thunberg to the Great Reset’s Klaus Schwab — who have been pushing the “climate emergency” narrative. It is an article of faith for the globalist elite and their useful idiots in the media, in politics, in business, and the entertainment that the world is on course for climate disaster which only radical and costly international action can prevent.

Continue reading “Delingpole: Study Disputes That Earth Is in a ‘Climate Emergency’”

Journal Nature Refutes PIK’s Fantasy-Rich Science That A Warmer Arctic Causes Extreme Cold Snaps

by P. Gosselin, Feb 9, 2021 in NoTricksZone


The polar vortex theory takes a beating: The claim a warm Arctic is behind the brutally cold winter conditions at the mid latitudes is shown by a Nature study to be scientifically baseless.

Now that Europe and North America are getting blasted by unusually severe winter weather, which climate alarmists predicted 20 years ago would be a thing of the past, the alarmists are desperate to find an explanation to escape embarrassment.

PIK science suggests warmth begets cold

They’ve come up with the polar vortex explanation: the bitter cold we are now experiencing at the middle latitudes is in fact due to the warmer Arctic, they say. And this wreaks havoc on the jet stream which in turn results in cold Arctic blasts dipping deep into the middle latitudes. Yes, cold winters are in fact exactly what we should expect in a rapidly warming world!

Levermann and Rahmstorf

For example the two media front men Anders Levermann and Stefan Rahmstorf of the Potsdam Climate Institute (PIK) have been telling this to the ever gullible German media outlets, like Bild and Spiegel. Yet, many suspect it’s scientific fraud designed to fool the public and to hide the fact that their global warming predictions are in reality glaring failures.

Journal Nature refutes fantasy-rich PIK explanation

For example a recent paper appearing in Nature titled “Weakened evidence for mid-latitude impacts of Arctic warming“, authored by Blackport et al, refutes this highly fantasy-rich hypothesis pitched by the two PIK scientists.


“Climate Adaptation Summit” turns out to be a fundraising event

by D. Wojick, Fab 6, 2021 in CFACT/CLINTEL


The recent Climate Adaptation Summit 2021 was not about helping nations against the effects of climate change. It was all about finding huge amounts of money. Even worse, it was about planning on finding money, not actually finding it. Even more embarrassing, in some cases it was just about thinking about planning. In fact its primary product was an Agenda. Climate Summits are like that. However, world leaders call it thinking big’.

Climate adaptation is proactive and that is its big strength. It is proactive to the combination of gradual changes (think of the gradually increasing sea level) and excessive events (think of all types of extreme weather). Using Darwin, if mankind does not adapt to these changes in his environment, extinction will be his fate as happened so often to other species in the past.

Climate is a long term statistic, typically 30 years, or more. In this case it is mostly the long term frequency of various extreme weather events, the usual litany of floods, droughts, heat waves, etc., plus there is the usual sea level rise.

The real thing is that adaptation is not about preventing these extreme events, but it is about adapting to those events. For instance, dont build houses in flood planes or build dikes to keep them dry. Keep in mind that with any form of climate adaptation, the cause of climate change is of no importance.

What does matter, in a very bad way, is that humans are being blamed for all bad weather. This supports the nonsensical thing called mitigation, where human well being is sacrificed in a foolish attempt to end bad weather.

Our friends at the Climate Intelligence Foundation (CLINTEL) have made it a central policy that adaptation is the way to go. In commenting on CAS 2021 they point out that adaptation is actually very profitable, increasing the prosperity and safety of nations.

Here is what they say: “The world should focus much more on climate adaptation and much less on mitigation. This is the conclusion of the global CLINTEL following the international climate summit that took place in the Netherlands over the past two days. Adaptation has already amply proven its value, while mitigation turns out to be inefficient and expensive.

Scientists Discover Plate Tectonics… Again

by D. Middleton, Feb 5, 2021 in WUWT


An upwelling of rock beneath the Atlantic may drive continents apart
The Mid-Atlantic Ridge may play a more active role in plate tectonics than thought

By Maria Temming

FEBRUARY 4, 2021

An upsurge of hot rock from deep beneath the Atlantic Ocean may be driving the continents on either side apart.

The Americas are moving away from Europe and Africa by a few centimeters each year, as the tectonic plates underlying those continents drift apart. Researchers typically think tectonic plates separate as the distant edges of those plates sink down into Earth’s mantle, creating a gap (SN: 1/13/21). Material from the upper mantle then seeps up through the rift between the plates to fill in the seafloor.

But new seismic data from the Atlantic Ocean floor show that hot rock is welling up beneath a seafloor rift called the Mid-Atlantic Ridge from hundreds of kilometers deep in Earth’s mantle. This suggests that material rising up under the ridge is not just a passive response to tectonic plates sliding apart. Rather, deep rock pushing toward Earth’s surface may be driving a wedge between the plates that helps separate them, researchers report online January 27 in Nature.

A better understanding of plate tectonics — which causes earthquakes and volcanic eruptions — could help people better prepare for these natural disasters (SN: 9/3/17).

Climate Researcher’s New E-Book: IPCC Significantly Overstates CO2, “The Sorry State Of Climate Science”

by P. Gosselin, Feb 5, 2021 in NoTricksZone


This is an outstanding reference. Using the table of contents the reader can conveniently look up the topic that’s of interest. The ebook has been downloaded over 10,000 times so far.

The 449-page book contains 120 figures and 177 equations and concludes that climate change is mostly about politically-fanned fear, and based very little on hard science.

Predictions of gloom haven’t come true

According to Poyet, a geologist, the worse climate predictions have been made for 50 years and none of them has ever become true. For example, despite the unsupported claims that the Maldives islands would be submerged by 2050, 97% of them have grown so far, for various reasons having nothing to do with “climate change”.

Also 50 years ago, the first Earth Day promoted ice age fears, and environmentalist Nigel Calder (later a prominent AGW skeptic) warned: “The threat of a new ice age must now stand alongside nuclear war as a likely source of wholesale death and misery for mankind.”

IPCC ignores vast majority of the science

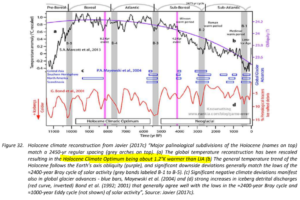
While IPCC-affiliated scientists claim man to been behind the climate change of the past decades, Poyet’s book shows that this can only be concluded if one ignores all other factors. Fig 12, of his book, for example, depicts the natural fluctuations witnessed during the Holocene.


Solving the mystery of why atmospheric carbon dioxide was lower during ice ages

by M. Floyd, June 13, 2019 in PhysOrg


Since scientists first determined that atmospheric carbon dioxide (CO2) was significantly lower during ice age periods than warm phases, they have sought to discover why, theorizing that it may be a function of ocean circulation, sea ice, iron-laden dust or temperature.

Yet no based on existing evidence has been able to explain why CO2 levels were as much as one-third lower when an ice age settled in.

A new study published this week in Science Advances provides compelling evidence for a solution—the combination of sea water variation and iron from dust off Southern Hemisphere continents.

Interview: Climate Change – A Different Perspective with Judith Curry

by J. Curry, Jan 30, 2021 in WUWT


My recent interview on the Strong and Free podcast.

I recently did an interview with Christopher Balkaran on his Strong and Free podcast [link]

While I wasn’t previously aware of Balkaran or his podcast, you can see why I agreed to this interview, from these excerpts from the ‘About’ page:

“I created the Strong and Free Podcast to explore news topics by gathering multiple perspectives together and allowing people and organizations to discuss their opinions with detail. This allows for a nuanced conversation. It also means putting aside my own bias to explore these to the fullest. It means making all guests feel welcomed to share their opinions safely, without fear that the host will paint them into a corner, or make them sound incoherent. I want this place to be truly safe. I believe everyone, even those I disagree with, deserve to be treated with respect and to be on the Podcast to share their perspective. It also means having a concrete discussion on issues and determining the best way forward.  As long as we restore thoughtful approaches to the biggest issues of our time our conversations will have deep, valuable meaning. And, we enrich our own opinion.”

We covered a lot of topics that I think will provide good fodder for discussion and debate here.

Here is a transcript of the interview (quicker to read than to listen to the hour long podcast).  I edited the transcript eliminate thousands of ‘like’, ‘you know’, ‘okay’ (I am really a much better writer than speaker).  I also edited to increase overall coherency of what was said.

Transcript:

The spiralling environmental cost of our lithium battery addiction

by A. Katwala, Aug 5, 2018 in Wired


Here’s a thoroughly modern riddle: what links the battery in your smartphone with a dead yak floating down a Tibetan river? The answer is lithium – the reactive alkali metal that powers our phones, tablets, laptops and electric cars.

In May 2016, hundreds of protestors threw dead fish onto the streets of Tagong, a town on the eastern edge of the Tibetan plateau. They had plucked them from the waters of the Liqi river, where a toxic chemical leak from the Ganzizhou Rongda Lithium mine had wreaked havoc with the local ecosystem.

There are pictures of masses of dead fish on the surface of the stream. Some eyewitnesses reported seeing cow and yak carcasses floating downstream, dead from drinking contaminated water. It was the third such incident in the space of seven years in an area which has seen a sharp rise in mining activity, including operations run by BYD, the world’ biggest supplier of lithium-ion batteries for smartphones and electric cars. After the second incident, in 2013, officials closed the mine, but when it reopened in April 2016, the fish started dying again.


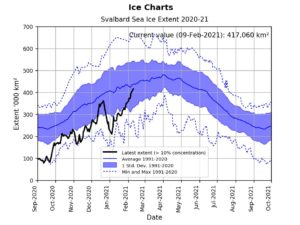
ANTARCTICA SUFFERING COLDEST JANUARY SINCE 1978 + GLOBAL SEA ICE GROWING EXPONENTIALLY

by Cap Allon, Jan 29, 2021 in Electroverse


The start of 2021 in Antarctica has been an unusually chilly one. In fact, the first half of January has been the coldest since 1978, according to data compiled by @LpdlcRamirez and @peikko763 on Twitter.

As of Jan. 19, the month-to-date temperature anomaly across Antarctic is approx. -0.5C, making this the continents coldest first 3-or-so-weeks of Jan. since 1978 (solar minimum of cycle 20), according to research conducted by @peikko163 on Twitter, who also notes that the Southern Hemisphere as a whole is suffering anomalous January chills not seen since 2012.

But this chill of solar minimum isn’t just confined to the Southern Hemisphere either, the mercury ACROSS the planet is tumbling. In one month global temperatures dropped by a whopping 0.26C: from 0.53C above the 1981-2010 avg. in Nov. 2020 to just 0.27C above the avg. in Dec. 2020 (UAH). This drop was in spite of a warming Arctic–a region expected to “heat” during times of otherwise “global” cooling (more on that below).

The Sun appears to be sliding into its next Grand Solar Minimum cycle–a multidecadal spell of reduced solar output where the solar disc can be devoid of sunspots for months or even years at a time. The result on Earth’s climate will be one of violent swings between extremes due to a weakening of the jet streams: intense bursts of heat will linger in one area, while a teeth-chattering chill will dominate nearby, and then the regions will “switch” — it is this unpredictable chopping and changing that will hasten the failure of our modern food production systems: crops will fail, on a large scale, and famine could quickly ensue.

Overall, Earth’s temperature trends colder during a Grand Solar Minimum, as the Sun’s output sinks lower and lower (increased cloud nucleation being one likely forcing). However, not ALL regions experience the chill: as with the previous GSM (the Maunder Minimum 1645-1715), areas such as the Arctic, Alaska, and S. Greenland/N. Atlantic actually warmed while the rest of the planet cooled — NASA reveals the phenomenon in their Maunder Minimum temperature reconstruction map:

The Rational Climate e-Book, By Patrice Poyet

P. Homewood, Jan 27, 2021 in NotaLotofPeopleKnowThat


I am delighted to give a plug to Patrice Poyet’s new e-Book, The Rational Climate e-Book.

It can be downloaded for free on the link below:

https://www.researchgate.net/publication/347150306_The_Rational_Climate_e-Book/link/5fe21ddb92851c13feb1763d/download

Patrice is a geologist, a geochemist and an applied computer scientist with an interest in various domains like Earth and Planetary Sciences, Astronomy, Finance and Trading, Integration in Manufacturing and Design, Simulation and Defense Systems, etc The development of computer systems has given him the chance to take part in a wide variety of projects in very different areas of expertise. Patrice published 37 articles mostly in peer-reviewed scientific journals, 6 books jointly-reviewed with colleagues, 6 peer-reviewed chapters in books, 64 papers in peer-reviewed conferences, one D.Sc. thesis (1986), and 32 scientific and technical reports for demanding public and private clients (e.g. French Navy, EC-funded R&D projects, CIEH, etc.) and acted as an expert reviewer for several EC R&D projects. He is now using his initial training as a geochemist and his passion for Earth and Space sciences to completely revisit the subject of climate and paleo-climates. The result is this free 431 pages e-Book that addresses all aspects of the subject.

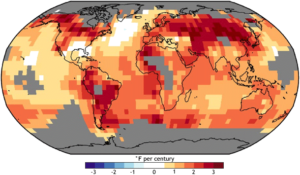
Does “global warming” mean it’s warming everywhere?

by C. Kennedy, Oct 29, 2020 in NOAAClimate.gov


No, “global warming” means Earth’s averageannual air temperature is rising, but not necessarily in every single location during all seasons across the globe.  It’s like your grades. If one semester you get all Bs and Cs, and the next you get all As and Cs, your grade point average rises, even though you didn’t improve in every class.

That’s the way it is with Earth’s near-surface temperature as atmospheric greenhouse gas levels climb. Temperature trends across the entire globe aren’t uniform because of the diverse geography on our planet—oceans versus continents, lowlands versus mountains, forests versus deserts versus ice sheets—as well as natural climate variability. When you’re zoomed in on a particular place, you may not be able to see the overall trend.

It is only when scientists calculate the average of temperature changes from every place on Earth over the course of a year to produce a single number, and then look at how that number has changed over time that a very clear, global warming trend emerges. In other words, it’s only when we “zoom out” to the planet-wide scale that the trend is obvious: despite a few, rare areas experiencing an overall cooling trend, the vast majority of places across the globe are warming.


The reason a “zoomed out” view makes the long-term trend so clear is that Earth’s annual average temperatures from year to year are found to be very stable when nothing is forcing it to change. Today, though, every decade since 1960 has been warmer than the last, and the last three decades each have been the warmest on record. Relative to geologic time, the warming that has occurred—1.8°F (1°C) over a span of about 120 years—is an unusually large temperature change in a relatively short span of time.

Meet The Team Shaking Up Climate Models

by C. Rotter, Jan 26, 2021 in WUWT


A new team tries a new approach to Climate Modeling using AI and machine learning. Time will tell if a positive effort or extremely complicated exercise in curve fitting. Their goal is regional scale predictive models useful for planning. Few admit publicly that these do not exist today despite thousands of “studies” using downscaled GCM’s.

“There are some things where there are very robust results and other things where those results are not so robust,” says Gavin Schmidt, who heads NASA’s respected climate modeling program at the Goddard Institute for Space Studies. But the variances push skeptics to dismiss the whole field.

“There’s enough stuff out there that people can sort of cherry-pick to support their preconceptions,” says Dr. Hausfather. “Climate skeptics … were arguing that climate models always predict too much warming.” After studying models done in the past 50 years, Dr. Hausfather says, “it turns out they did remarkably well.”

But climate modelers acknowledge accuracy must improve in order to plot a way through the climate crisis. Now, a team of climatologists, oceanographers, and computer scientists on the East and West U.S. coasts have launched a bold race to do just that.

They have gathered some of the brightest experts from around the world to start to build a new, modern climate model. They hope to corral the vast flow of data from sensors in space, on land, and in the ocean, and enlist “machine learning,” a kind of artificial intelligence, to bring their model alive and provide new insight into what many believe is the most pressing threat facing the planet.

Their goal is accurate climate predictions that can tell local policymakers, builders, and planners what changes to expect by when, with the kind of numerical likelihood that weather forecasters now use to describe, say, a 70% chance of rain.

Japanese Climate Scientist Kyoji Kimoto: “Climate Change Governed By The Sun”, CO2 Lesser Role!

by P. Gosselin, Jan 22, 2021 in NoTricksZone


I’ve compiled a list of six examples how the sun impacts climate across the globe.

1. Climate periods based on a double Hale (44-45 years) cycle of solar activity.

In 1977 Australian geologist Rhodes W. Fairbridge found a 45-year periodicity of beach ridge located at the Hudson Bay. It has been formed with storms in Hudson Bay caused by a wavier jet stream.

I have found a 44-year periodicity of heavy snowfall in Japan caused by the wavier jet stream as follows. The time series coincide quite well with that of Fairbridge (1977).

1833   Tempo famine, Dalton minimum (1795-1830)
1877   Seinan war (44 years later)
1918   Rice riot, Gleissberg minimum (1898-1923) (41 years later)
1963   38 heavy snowfall (45 years later)
2006  Heisei 18 year heavy snowfall, Gleissberg or Dalton minimum (43 years)

The climate history of 20th century can be divided with the following 5 periods based on the double Hale cycle above using aa-index of geomagnetism associated with solar activity. The Pacific Climate Shift occurred at 1977 with solar activity increase & a positive PDO index.

1900-1918: Little Ice Age (LIA)
1919-1962: 1st Modern Warm Period (1st MWP)
1963-1976: Temporal Cold Period  (TCP, New Ice Age Coming, see below)
1977-2005: 2nd Modern Warm Period (2nd MWP)
2006 – present: New Cold Period (NCP)

Studies Show Glaciers Worldwide Were Smaller Than Today

by Die Late Sonne, Feb 26, 2021 in ClimateChangeDispatch


Former Iceland Prime Minister fed up with climate tourism: Glaciers used to be smaller than today

By Die kalte Sonne
[German text translated by P. Gosselin]

Many glaciers are currently shrinking, as they have always done in the past when the climate warmed up. What’s the news on the glacier front?

In August 2019, the Okjokull Glacier disappeared in Iceland with great media attention. The BBC reported:

Climate change: Iceland holds funeral for melted glacier

The glacier called Okjokull is the first in the country to be lost to climate change, after the warmest July ever on record. Iceland loses about 11 billion tonnes of ice per year, and scientists have warned that there are about 400 other glaciers also at risk. They fear all of the island’s glaciers will be gone by 2200. Glaciers cover about 11% of Iceland’s surface.”

Read more at the BBC.

However, the glacier had not formed until the Little Ice Age. See our article “The cycle is full: the death of an Icelandic glacier that did not exist even during the Medieval Warm Period“. Iceland’s prime minister from 2013-2016, David Gunnlaugsson, dislikes activism. In The Spectator, Gunnlaugsson wrote on November 23, 2019:

Iceland’s melting glaciers are nothing to panic about

Ocean forcing drives glacier retreat in Greenland

by M. Wood et al., Jan 01, 2021 in AAAS OPEN ACCESS


INTRODUCTION

The Greenland Ice Sheet has contributed substantially to sea-level rise over the past few decades. Since 1972, approximately two-thirds of the ice sheet’s contribution to sea-level rise resulted from increased glacier flux with the remaining one-third from anomalous surface melt (1). Before 2000, anomalous ice discharge was the dominant driver of mass loss, but in recent years, increasingly negative surface mass balance anomalies have contributed to a larger proportion of the total mass loss from the ice sheet (1). The acceleration in mass flux has been partially attributed to a warming of subsurface waters around Greenland near the end of the 1990s (2, 3) and increased runoff, resulting in enhanced water mixing and melt at glacier margins, destabilization of terminus regions (4, 5), ice front retreat (6, 7), and, in most cases, accelerated ice flow (8). The increase in flow speed, combined with enhanced surface melt, results in increased glacier thinning, which is conducive to further retreat (9). Other processes may have additionally contributed to the glacier retreat, e.g., increases in basal lubrication, melting of the ice mélange in front of glaciers, or weakening of glacier shear margins, but quantitative evidence about their impact has been limited (1012).

The warming of subsurface waters at the turn of the 21st century was caused by the spreading of ocean heat from the subpolar gyre during a transition in the North Atlantic Oscillation (NAO) from a high positive phase to a low-to-negative phase (3). In this shift, the North Atlantic subpolar gyre expanded, enhancing ocean heat fluxes through the coastal Irminger and West Greenland currents, yielding warmer subsurface waters on the continental shelf of all seven major basins of Greenland (Fig. 1). Since 2010, the NAO has transitioned back to a more positive phase, yielding a relative cooling of the ocean waters, however, not sufficiently to bring back ocean heat fluxes to the levels of the 1990s (13).

“DO NOT TRAVEL” WARNINGS ISSUED AS HEAVY SNOW BLANKETS MAJORITY OF BRITAIN

by Cap Allon, Jan 25, 2021 in Electroverse


According to the UK Met Office, snowfall in Britain will be a thing of the past by 2040-2060 — a ludicrous, fear-mongering prophesy, and one almost as stupid as the claims made by senior climatologist Dr David Viner of the Climate Research Unit (CRU) of the University of East Anglia.

Back in 2000, and as reported by the Telegraph (since deleted), Viner said: within a few years winter snowfall will become “a very rare and exciting event,” adding that “children just aren’t going to know what snow is.”

Frustratingly, these hacks are never called to task, their mistakes and dud-research seldom analysed or investigated. Instead, the cycle is simply one of rinse and repeat: the global warming cabal call-up their next set of “higher-educated” brainwashees who go on to use the exact same flawed upside down pyramid built on the work of just a few climate modelers to make the exact same tired-old doomsday predictions–such as “the end of snow”.

Just yesterday, January 25, a severe weather warning was in place across a large portion of the UK as heavy snow threatened.

The pow-pow duly arrived early Sunday morning with some regions, particularly those in central England and Wales, registering accumulations of 5+ inches (13+ cm) in just an hour and a half.

La géologie, une science plus que passionnante … et diverse