Researchers at Purdue University in the US have developed a new technology that promises to be a game-changer in the extraction of rare earths.
THE GLOBAL MARKET OF RARE EARTH METALS HAS BEEN VALUED AT $4 BILLION PER YEAR BUT 70% OF THE PRODUCTION IS CONCENTRATED IN CHINA
In a paper published in the journal Green Chemistry, the scientists explain that the patented extraction and purifying processes use ligand-assisted chromatography and are shown to remove and purify rare earth metals from coal ash, recycled magnets and raw ore safely, efficiently and with virtually no detrimental environmental impact.
This is key because, at present, many companies across the world don’t even dare to consider extracting REE due to the damages caused to the environment by acid-based separation and purification of these elements.
“About 60% of rare earth metals are used in magnets that are needed in almost everyone’s daily lives. These metals are used in electronics, aeroplanes, hybrid cars and even windmills,” Nien-Hwa Linda Wang, whose lab developed the technology, said in a media statement. “We currently have one dominant foreign source for these metals and if the supply were to be limited for any reason, it would be devastating to people’s lives. It’s not that the resource isn’t available in the US, but that we need a better, cleaner way to process these rare earth metals.”
See also Two-zone ligand-assisted displacement chromatography for producing high-purity praseodymium, neodymium, and dysprosium with high yield and high productivity from crude mixtures derived from waste magnets (here)
Although shallow magma storage at Erta Ale volcano hints at a rift-to-ridge transition, the tectonic future of the Afar region is far from certain.
Standing next to a lava lake at the summit of a massive volcano, Christopher Moore, a Ph.D. candidate at the School of Earth and Environment at the University of Leeds in the United Kingdom, could see the red haze of lava flows a few kilometers away. This might seem like a rare sight, but at Ethiopia’s Erta Ale, it’s business as usual.
Are such behaviors the first signs of a tectonic transition? This question is part of what Moore has been studying at Erta Ale. The entire Afar region in eastern Africa finds itself in the middle of changes that could split the continent, forming a new ocean basin. The magmatism at Erta Ale might be offering signs of this switch by mimicking the characteristics of a mid-ocean ridge.
The East African Rift valley, the Red Sea, and the Gulf of Aden are clearly visible in this Landsat 8 image, taken on 8 November 2019. Credit: NASA/Erik Klemetti
However, there isn’t agreement about how close the Afar region is to this tectonic transition. The geophysical characteristics of magma storage at Erta Ale could point to the region’s conversion to an incipient oceanic spreading center, but the petrology of the erupting lava might be telling us that we aren’t there yet.
UPDATE: Changed emphasis from Northern Hemisphere extratropics to entire Northern Hemisphere (h/t John Christy)
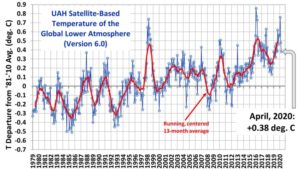
In April, 2020, the Northern Hemisphere experienced its 2nd largest 2-month drop in temperature in the 497-month satellite record.
The Version 6.0 global average lower tropospheric temperature (LT) anomaly for April, 2020 was +0.38 deg. C, down from the March, 2020 value of +0.48 deg. C.
The Northern Hemisphere temperature anomaly fell from +0.96 deg. C to 0.43 deg. C from February to April, a 0.53 deg. C drop which is the 2nd largest 2-month drop in the 497-month satellite record. The largest 2-month drop was -0.69 deg. C from December 1987 to February 1988.
The linear warming trend since January, 1979 has now increased to +0.14 C/decade (but remains statistically unchanged at +0.12 C/decade over the global-averaged oceans, and +0.18 C/decade over global-averaged land).
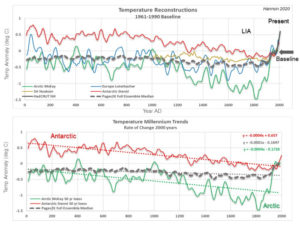
There have been recent discussions about ‘flattening the curve’ and some curves are easier to flatten than others. The Pages 2K Consortium calculates global mean temperature in a manner that flattens the long-term trend and makes present day temperatures appear warmer relative to past temperatures. Across the globe, temperature reconstructions show cooling millennial temperature trends with one exception, the Pages 2K global mean.
Millennial Temperature Trends Show Global Cooling
Global mean surface temperature anomalies were recently calculated by the Pages 2K Consortium led by Nuekom, 2019. Their statistical means are a conglomeration of seven different averaging methods for 7000 proxy records over the past 2000 years. The median across all global mean methods is plotted as a dashed line in Figure 1 and compared to Pages 2K’s published regional reconstructions. All means demonstrate similar trends as the median and will be simply be referred to as the global mean(s).
Regional temperature reconstructions are chosen that utilize similar proxy datasets used in the global mean calculation. The Arctic reconstruction by McKay incorporates a balance of proxy records consisting of ice cores, tree rings, lake and marine sediments north of 60 deg N. The Northern Hemisphere (NH) European reconstruction by Luterbacher is tree ring proxy based. And Stenni’s Antarctic reconstruction uses predominantly ice core isotopes.
The Pages 2K global mean appears to be reasonable compared to regional reconstructions from Present through the Little Ice Age (LIA) until about 1250 AD. Although it is difficult to see how the mean compares to regional reconstructions during the Present when using a 1961-1990 baseline as all reconstructions converge creating the “hockey stick” effect. Pre-1250 AD, the global mean appears to parallel NH Europe temperatures largely ignoring the Antarctic.
Figure 1: Top graph are surface temperature reconstructions with a 50-year loess filter plotted with Pages 2K global mean of the 7000-member ensemble across all methods. Bottom graph shows linear trends over the past 2000 years.
The Temperature of the Global Lower Atmosphere plunged 0.38C through March and April, halving its February above baseline high of 0.76C to 0.38C — the second-largest two-month drop in the UAH temperature dataset.
The largest two month drop remains the 0.69C observed back in 1987. And note how the global average temperature back in 1987 –before both the drop AND the inception of the global warming scare— is EXACTLY the same as it is now:
A continuation of this sharp downward plunge (seen in March and April, 2020) is highly probable over the coming months (with the odd bump on the way), and we can now consider a reading below baseline by the end of the year “likely”.
For a more in-depth look at the data check out this video from the Oppenheimer Ranch Project:
The northern hemisphere surface temperature was expected to drop substantiallyaccording to NCEP, but this of course will not keep global warming alarmists from sounding the warming alarms.
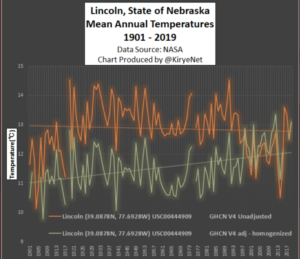
But a look at the unadjusted data from some rural US stations tells us that there has been no warming.
Today we look at temperature data from NASA of some stations along the northern US with a Brightness Index (BI) of 0, meaning rural locations with no urban heat island effects. We want to see the trend over the past 100 or so years.
Plotted are the USHCN Version 4 versus Version 4 adjusted.
The first plots are the data from Lincoln, Nebraska going back to 1901:
Note how a modest cooling trend was changed to a warming trend. Very ealy temperatures were cooled by 2°C!
Next we move to the Livingston, Montana station, where here as well a modest cooling trend was transformed into warming by massively adjusting past temperatures downward also by more than 2°C:
by P. Homewood, May 2, 2020 in NotaLotofPeopleKnowThat
A
…
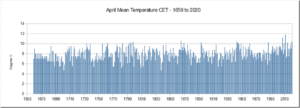
In other words, all we have had is “weather”, and of the type we have had plenty of times in the past.
What has made the month much warmer than average is the persistence of this weather. Indeed this has been the pattern all year, with daily temperatures consistently above average, but within the normal band.
Inland waters such as rivers, lakes, and reservoirs play an important role in the global carbon cycle.
Calculations that scale up the carbon dioxide emissions from land and water surface areas do not take account of inland waters that dry out intermittently.
This means that the actual emissions from inland waters have been significantly underestimated—as shown by the results of a recent international research project led by scientists at the Helmholtz Centre for Environmental Research (UFZ) in Magdeburg and the Catalan Institute for Water Research (ICRA).
The study was published in Nature Communications.
“The interaction of local conditions like temperature, moisture, and the organic matter content of the sediments is crucial, and it has a bigger influence than regional climate conditions,” Keller explains.
So what do the results of the study mean for the future assessment of carbon dioxide emissions from inland waters? “Our study shows that carbon dioxide emissions from inland waters have been significantly underestimated up until now,” says Koschorreck.
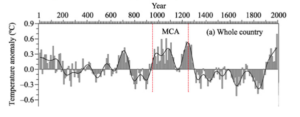
For China as a whole, the longest warm period during the last 2000 years occurred in the 10th–13th centuries’
Abstract: The Medieval Climate Anomaly (MCA, AD950-1250) is the most recent warm period lasting for several hundred years and is regarded as a reference scenario when studying the impact of and adaptation to global and regional warming. In this study, we investigated the characteristics of temperature variations on decadal-centennial scales during the MCA for four regions (Northeast, Northwest, Central-east, and Tibetan Plateau) in China, based on high-resolution temperature reconstructions and related warm-cold records from historical documents. The ensemble empirical mode decomposition method is used to analyze the time series. The results showed that for China as a whole, the longest warm period during the last 2000 years occurred in the 10th–13th centuries, although there were multi-decadal cold intervals in the middle to late 12th century. However, in the beginning and ending decades, warm peaks and phases on the decadal scale of the MCA for different regions were not consistent with each other. On the inter-decadal scale, regional temperature variations were similar from 950 to 1130; moreover, their amplitudes became smaller, and the phases did not agree well from 1130 to 1250. On the multi-decadal to centennial scale, all four regions began to warm in the early 10th century and experienced two cold intervals during the MCA. However, the Northwest and Central-east China were in step with each other while the warm periods in the Northeast China and Tibetan Plateau ended about 40–50 years earlier. On the multi-centennial scale, the mean temperature difference between the MCA and Little Ice Age was significant in Northeast and Central-east China but not in the Northwest China and Tibetan Plateau. Compared to the mean temperature of the 20th century, a comparable warmth in the MCA was found in the Central-east China, but there was a little cooling in Northeast China; meanwhile, there were significantly lower temperatures in Northwest China and Tibetan Plateau.
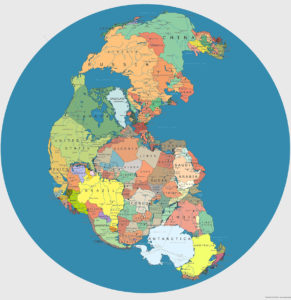
Cet article fait suite aux trois récents articles publiés par le Prof. Maurin sur SCE (1/3, 2/3, 3/3), et traite de l’évolution géologique de la plaque Antarctica.
Voir également L’Antarctique géologique (1/2).
3/ Situation récente à l’échelle géologique
3.1. Isolation de la plaque Antarctique
Nous arrivons ainsi à la situation actuelle avec l’Arctique et l’Antarctique, situation décrite dans les parties 1 à 3 des articles de M. Maurin (parties 1/3, 2/3 et 3/3). D’où proviennent les glaciations actuelles ? Pour les comprendre il faut remonter au début de l’ère cénozoïque en considérant l’Antarctique qui était en position polaire (Scotese, 2001).
La plaque antarctique, partie intégrante de l’ensemble des continents formant le Gondwana est entourée dès le Jurassique (Figs. 7 et 12, inL’Antarctique géologique 1/2) de rides médio-océaniques (excepté la péninsule antarctique qui provient d’une limite de plaque convergente active avec failles transformantes séparant la plaque Antarctique et la plaque Scotia). En conséquence, la plaque Antarctique est actuellement en expansion par rapport aux plaques adjacentes, et fut particulièrement stable et isolée par rapport aux événements tectoniques du Mésozoïque et du Cénozoïque (ici).
Dans ce contexte, et en remontant le temps, il faut noter l’individualisation, dès l’Ordovicien, de la péninsule antarctique avec des montagnes de plus de 3200 m d’altitude constituant aujourd’hui la région la plus au nord de l’Antarctique occidental et s’étendant au-delà du cercle polaire. Cette chaîne de montagnes prolonge les Andes de l’Amérique du Sud dans la continuité d’une dorsale sous-marine caractérisée par un gradient géothermique élevé (voir plus loin). Ainsi on voit que l’Antarctique, depuis longtemps et encore aujourd’hui, participe à un jeu de tectonique des plaques encore active avec des effets locaux (notamment variations du gradient géothermique).Ce gradient géothermique est un élément important à prendre en considération dans la dynamique glaciaire car il favorise la fonte et ensuite le glissement des glaces.
Notons que Arctowski (in Fogg 1992) avait déjà suggéré en 1901 que les Andes étaient présentes dans la pointe nord de la péninsule antarctique (Graham Land) .
3.2. Englacement de la plaque Antarctique
…
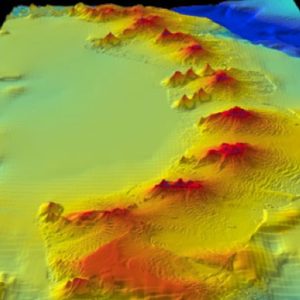
Fig. 16 : Image des fonds marins d’une chaîne de 800 km de long de plusieurs volcans actifs de 1000 m de haut situés à proximité de la partie nord du continent antarctique. D’après Kamis, 2016.
The mainstream media won’t give a toss, but the ENTIRE Aussie continent is set for an early, bone-chilling taste of winter as a meridional jet stream flow (brought on by historically low solar activity) kicks brutal Antarctic air anomalously far north.
On Thursday and Friday this week, the maximum temperature in Melbourne –for example– is forecast to plummet to the lowest recorded level in April since 1996 (solar minimum of cycle 22) — a chilly 13C (55.3F)
Even NASA agrees, in part at least, with their forecast for this upcoming solar cycle (25) revealing it will be “the weakest of the past 200 years,” with the agency correlating previous solar shutdowns to prolonged periods of global cooling here.
The whole thing is nothing but pure propaganda. It most certainly is not factual, nor does it explain to kids the real implications of the policies proposed by the likes of Greta.
Indeed, the suggestions of “how we can help” are infantile and risk making children think think that is all they need to do.
They may be seven year olds, but they should be treated with more respect and honesty.
I don’t know who produced this presentation or if it is officially approved. If anyone has any more info, please let me know.
Time and again climate alarmists have used computer models to claim that rising CO2 and rising temperatures should be negatively impacting various ecosystems, including forests. Given that these two parameters have supposedly reached unprecedented heights in modern history, reason suggests that this hypothesis of ecosystem decline should be presently evident in observational data. But is it?
Thanks to the work of Lamont et al. (2020) this question can be answered — at least for a mangrove forest ecosystem in New South Wales, Australia.
What the five Australian researchers did in their study was to examine the biomass change of two mangrove forest sites over the period 1989-2018. The two sites included a tall gallery forest composed of Avicennia marina (i.e., Site 1) and an interior, higher elevation, stunted mixed community of A. marina and Aegiceras corniculatum (i.e., Site 2). Data originally gathered in a 1989 survey were compared with new data obtained by Lamont et al. in 2018 and thereafter analyzed for possible trends.
Results of the analysis are summarized in the figure below, showing large gains in both aboveground and below ground biomass between the two survey dates at both mangrove forest sites. Of particular note is “a greater than seven-fold increase in mean aboveground biomass” at Site 2, and “a six-fold and 12-fold increase [in total below-ground root mass] at Site 1 and Site 2, respectively.” Such large biomass increases, not surprisingly, were estimated by the authors to have contributed to large gains in carbon sequestration. In extrapolating such gains to the entire New South Wales region, they estimate mangrove forests have sequestered “at least about 1.8 Tg C” over the past 70 years.
The above findings represent incredible growth benefits reaped by mangrove forest ecosystems during a time of rising atmospheric CO2 and rising temperature, which findings are pretty much the opposite of the doom and gloom predictions offered by climate alarmists.
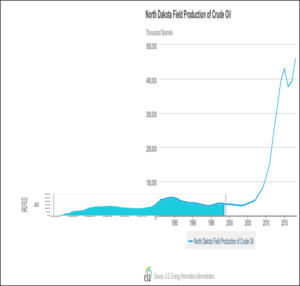
Continental Resources has also declared force majeure on current contracts to deliver crude oil at current prices. Legal experts are dubious regarding their force majeure claim. Continental, one of the most financially successful “shale” players, does not hedge production and was, therefore, highly exposed to the sudden price drop.
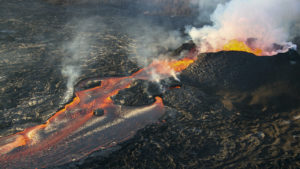
In May 2018, Hawaii’s Kilauea volcano let loose its largest eruption in 200 years, spewing plumes of ash high into the air, and covering hundreds of homes in lava. The eruption terrified local residents, but it gave scientists a once-in-a-lifetime opportunity to study the volcano’s explosive behavior. Now, a new study claims that extreme rainfall boosted underground pressures and was the “dominant factor” in triggering the eruption.
It’s not the first time rainfall has been linked to volcanic activity, says Jenni Barclay, a volcanologist at the University of East Anglia who was not involved in the new work. Previous research suggests storms passing over Mount St. Helens may have played a role in explosive activity between 1989 and 1991. And intense rains fell shortly before and during the activity of Montserrat’s Soufrière Hills volcano from 2001 to 2003. Rain may have also triggered eruptions of Réunion’s Piton de la Fournaise volcano. Still, Barclay believes rain is, at best, a contributing factor to volcanic eruptions and not the main driver. “It’s a series of coincident events that have led to the triggering of this larger episode,” she says.
Researchers on the new study used satellite data from NASA and Japan’s space agency to estimate rainfall during the first months of 2018, before the start of the eruption. More than 2.25 meters of rain fell on the volcano in the first months of 2018, the researchers found. They created a model to show how the accumulated rainfall could seep into the pore spaces in rocks deep underground, boosting pressures that eventually caused fissures in the volcano’s flank to open up and release magma. When they looked at records of previous Kilauea eruptions going back to 1790, they found that 35—more than half—started during the nearly 6-month rainy season.
Hawaii’s Kilauea volcano erupted on 3 May 2018, leading to a massive outpouring of lava that devastated the southeastern part of the island. USGS HAWAIIAN VOLCANO OBSERVATORY
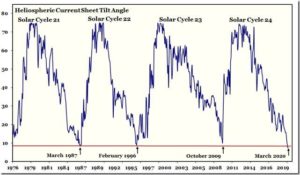
The heliospheric current sheet has flattened meaning that Solar Cycle 24 is over and we are now in Solar Cycle 25.
Figure 1: Heliospheric current sheet tilt angle 1976 -2020
The solar cycle isn’t over until the heliospheric current sheet has flattened. The data is provided by the Wilcox Solar Observatory at Stanford University. There were no observations from about 19 December to 5 February; so the values in between have been interpolated from the rotations before and after.
Victoria Falls, located at the border of Zambia and Zimbabwe on the Zambezi River, is not only one of the seven wonders of the world and classified as the biggest waterfall in the world, but it is also a tourist destination that allows the economies of both African countries to thrive.
The Kololo tribe, which resided in the area in the 1800s, named the falls “Mosi-oa-Tunya,” meaning “the smoke that thunders.” Both the indigenous name and the name Victoria Falls, given by Scottish explorer David Livingstone, are recognized officially.
AccuWeather Senior Meteorologist Jim Andrews said the climate of the upper Zambezi River watershed is tropical, seasonal and continental, with “sharply distinct” wet and dry seasons.
by A. Préat, 24 avril 2020 in ScienceClimatEnergie
Cet article traite de l’évolution géologique de la plaque Antarctica, et fait suite aux trois récents articles publiés dans SCE par le Prof. Maurin sur la cryosphère actuelle (1/3, 2/3, 3/3).
1/ Les glaces fascinent …
Les glaces fascinent depuis longtemps les climatologues qui y voient un monde à part, aujourd’hui elles sont suivies ‘à la loupe’ car elles témoigneraient en tout ou en partie du processus de réchauffement actuel. Elles sont l’objet d’une attention médiatique constante. Pourtant elles furent souvent absentes de la Planète, elles apparurent plusieurs fois et disparurent autant de fois au cours de l’histoire géologique, le plus souvent suivant des modalités différentes à l’échelle temporelle et spatiale.
Il n’est pas possible ici de retracer la longue histoire des glaces qui commence au Précambrien, au moins à la transition Archéen et Protérozoïque (avec la glaciation huronienne, il y a environ 2,4 Ga, pour l’échelle détaillée des temps géologiques voir ici, et ci-dessous (Fig. 1) pour une version simplifiée) et se poursuit avec des aléas divers avec un recouvrement des glaces sur l’ensemble de la Planète à la fin du Néoprotérozoïque, donc y compris dans la zone équatoriale, donnant lieu au fameux ‘Snowball Earth’ ou hypothèse de la Terre boule de neige ou encore ‘Terre gelée’ (glaciation marinoenne qui a fait suite à la -ou les ? glaciation(s) sturtienne(s)- il y a 635 Ma. Ensuite viendra la glaciation Gaskiers vers 580 Ma, c’est-à-dire vers la fin du Précambrien. Cet épisode marinoen d’englacement généralisé perdura plus d’une dizaine de millions d’années avec des calottes de glace sur l’équateur (ici) et est à l’origine du nom de l’avant-dernière période du Précambrien, à savoir le Cryogénien (partie supérieure du Protérozoïque entre 850 Ma et 635 Ma, cf. Fig. 1). Entre ces deux grandes glaciations précambriennes (celles de l’huronien et du marinoen), soit sur un peu plus de 1,5 Ga aucune autre glaciation n’a encore? été rapportée, ce qui supposerait que pendant cet intervalle de temps le climat s’est maintenu dans des conditions plutôt chaudes, avec une régulation thermique ‘sans faille’ (Ramstein, 2015). Notons également pour être complet la présence de glaciers locaux à 2,9 Ga dans l’Archéen d’Afrique du Sud (glaciation ‘pongolienne’) (ici).
Climate science research and assessments have misused scenarios for more than a decade. Symptoms of this misuse include the treatment of an unrealistic, extreme scenario as the world’s most likely future in the absence of climate policy and the illogical comparison of climate projections across inconsistent global development trajectories. Reasons why this misuse arose include (a) competing demands for scenarios from users in diverse academic disciplines that ultimately conflated exploratory and policy relevant pathways, (b) the evolving role of the Intergovernmental Panel on Climate Change – which effectively extended its mandate from literature assessment to literature coordination, (c) unforeseen consequences of employing a nuanced temporary approach to scenario development, (d) maintaining research practices that normalize careless use of scenarios in a vacuum of plausibility, and (e) the inherent complexity and technicality of scenarios in model-based research and in support of policy. As a consequence, the climate research community is presently off-track. Attempts to address scenario misuse within the community have thus far not worked. The result has been the widespread production of myopic or misleading perspectives on future climate change and climate policy. Until reform is implemented, we can expect the production of such perspectives to continue. However, because many aspects of climate change discourse are contingent on scenarios, there is considerable momentum that will make such a course correction difficult and contested – even as efforts to improve scenarios have informed research that will be included in the IPCC 6th Assessment.
Keywords: climate, scenarios, assessment, research integrity
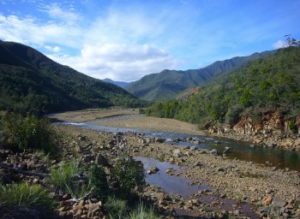
The regional climate in Southernmost South America is heavily influenced by the proximity to the oceans. This generates rather weak seasonal cycles with cool to cold summers and moderate to cold winters, especially on the western Pacific side. Slightly more pronounced, continental seasonal cycles are observed in the East of the Andes. While annual mean air temperatures across the region are decreasing from North to South precipitation patterns show very pronounced east-west gradients. The distinctive gradients in precipitation are caused by the north-south striking mountain ranges of the Patagonian Andes, and the northwest-southeast stretching mountain chains of the Cordillera Darwin. Both mountain ranges enforce heavy precipitation on the west and southwest exposed flanks by uplift and dry foehn-like conditions on the leesides (e.g., Holmlund and Fuenzalida, 1995; Schneider et al., 2003; Rasmussen et al., 2007) which produces extremely high drying ratios (Escobar et al., 1992; Carrasco et al., 2002; Smith and Evans, 2007). At inter-annual to decadal time scales atmospheric teleconnections such as the El Niño Southern Oscillation (ENSO) (Schneider and Gies, 2004), Southern Annular Mode (SAM), and Pacific Decadal Oscillation (PDO) are influencing spatial and temporal patterns of both, precipitation and air temperature. For example, positive SAM modes (Garreaud, 2009; Weidemann, Sauter, Kilian et al.) and the PDO (Villalba et al., 2003) are associated with higher air temperatures. Langhamer et al. show that the source of precipitation in the Southern Andes also depends on these teleconnections.
An important aspect is that Patagonia and Tierra del Fuego, together with the sub-Antarctic islands are the only regions where direct proximity between Antarctica and land masses north of the Southern Ocean is given. Such linkages are for example explored with investigations by Hebel et al. on the biosphere and Oppedal et al. for the regional glacier history.
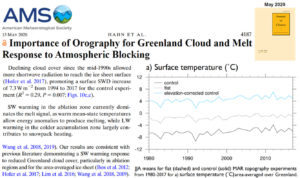
Scientists now acknowledge cloud cover changes “control the Earth’s hydrological cycle”, “regulate the Earth’s climate”, and “dominate the melt signal” for the Greenland ice sheet via modulation of absorbed shortwave radiation. CO2 goes unmentioned as a contributing factor.
by M. McCrae, April 21, 2020 in ClimateChangeDispatch
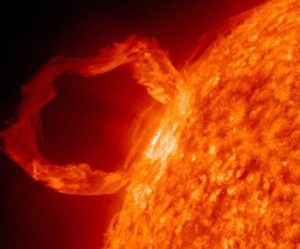
Our planet is constantly bathed in the winds coming off the blistering sphere at the center of our Solar System.
But even though the Sun itself is so ridiculously hot, once the solar winds reach Earth, they are hotter than they should be – and we might finally know why.
We know that particles making up the plasma of the Sun’s heliosphere cool as they spread out. The problem is that they seem to take their sweet time doing so, dropping in temperature far slower than models predict.
“People have been studying the solar wind since its discovery in 1959, but there are many important properties of this plasma which are still not well understood,” says physicist Stas Boldyrev from the University of Wisconsin–Madison.
“Initially, researchers thought the solar wind has to cool down very rapidly as it expands from the Sun, but satellite measurements show that as it reaches the Earth, its temperature is 10 times larger than expected.”
The research team used laboratory equipment to study moving plasma, and now think the answer to the problem lies in a trapped sea of electrons that just can’t seem to escape the Sun’s grip.
The expansion process itself has long been assumed to be subject to adiabatic laws, a term that simply means heat energy isn’t added or removed from a system.
This keeps the numbers nice and simple but assumes there aren’t places where energy slips in or out of the flow of particles.
Unfortunately, an electron’s journey is anything but simple, shoved around at the mercy of vast magnetic fields like a roller coaster from Hell. This chaos leaves plenty of opportunities for heat to be passed back and forth.
The topic of global warming and climate change is far more scientifically complex than the public is led to believe.
Myriads of newspaper, magazine and TV items over decades have tended to simplify the science to the point at which the general public believes that it is all so simple that any fool can see what is happening. Public groups often accuse world leaders and scientists of being fools, if they do not instantly act on simple messages projected by individuals or public groups.
One often hears phrases like: ‘The science is settled.’ It is not. Even more worrying is that the reality of the correct science is actually very different to much of the simple public perception.
An additional complicating factor is that there are political groupings wanting to change the world social order and who are using the climate change issue as a vehicle to achieve these objectives. They want the ‘science’ to say what they want it to say and are not interested in the truth. Sections of the public, with noble good intentions, then frequently do not realize that they are being induced by such elements to unwittingly support a political agenda, which in reality is unrelated to the climate issue.
I found myself in an informal social debate on these topics, with some people getting rather heated. Attempts to cool the conversation temperature were not so successful. The political aspects of the climate change issue, as always, entered into the discussion. Points like: ‘saving mankind from disaster’ were made with much emotion, and UN and various government political votes on the science were referred to, as if a political vote settled the scientific facts.
Sadly, so much of the climate debate is the result of votes and not of sound science, as determined by scientific methodology and protocol which has been developed over centuries.