by Kevin Murphy in Judith Curry, January 28, 2019 in ClimateEtc.
A response to: “Is RCP8.5 an impossible scenario?”. This post demonstrates that RCP8.5 is so highly improbable that it should be dismissed from consideration, and thereby draws into question the validity of RCP8.5-based assertions such as those made in the Fourth National Climate Assessment from the U.S. Global Change Research Program.
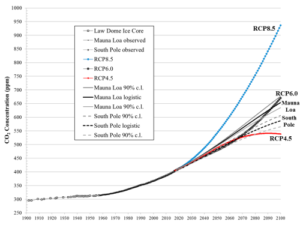
Analyses of future climate change since the IPCC’s 5th Assessment Report (AR5) have been based on representative concentration pathways (RCPs) that detail how a range of future climate forcings might evolve.
Several years ago, a set of RCPs were requested by the climate modeling research community to span the range of net forcing from 2.6 W/m2 to 8.5 W/m2 (in year 2100 relative to 1750) so that physics within the models could be fully exercised. Four of them were developed and designated as RCP2.6, RCP4.5, RCP6.0 and RCP8.5. They have been used in ongoing research and as the basis for impact analyses and future climate projections.
…
Figure 2. History and forecasts of CO2 concentration. RCP8.5 is defined by 936 ppm in 2100.
Charismatic Swiss meteorologist Jörg Kachelmann posted a comment at Twitterwhere he wondered what flagship German ZDF television was thinking when its evening news announced the polar vortex was some sort of new phenomenon arising from global warming.
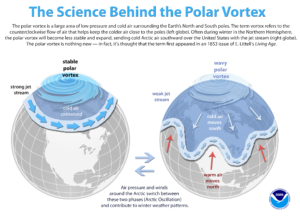
Recently in the media we’ve been hearing a lot about the junk science that a warmer Arctic is somehow miraculously producing extreme cold over vast neighboring continents.
NOAA: “Polar vortex nothing new […] term appeared in 1853”
…
The science behind the polar vortex.(NOAA)Download
Paleoclimatic records indicate that most of Greenland was ice-free within the last 1.1 million years even though temperatures then were not much warmer than conditions today. To explain this, the researchers point to there being more heat beneath the ice sheet in the past than today.
Data show that when the Iceland hot spot — the heat source that feeds volcanoes on Iceland — passed under north-central Greenland 80 to 35 million years ago, it left molten rock deep underground but did not break through the upper mantle and crust to form volcanoes as it had in the west and east. The Earth’s climate then was too warm for Greenland to have an ice sheet, but once it cooled the ice sheet formed, growing and shrinking successive with ice ages.
by SCE-info, 31 janvier 2019 in ScienceClimatEnergie
Chers Collègues scientifiques signataires de la pétition (ici),
Vous avez signé une pétition en tant qu’académique scientifique. Tous les signataires le sont-ils ? Avez-vous remarqué des signataires qui n’ont pas existé ou qui sont décédés ? Trofik Lysenkom, inconnu sur Google, par contre Trofim Lysenko a bien existé (1898-1976) et reste de triste mémoire dans le monde scientifique. Outre cet aspect cocasse, il y a plus grave : en tant que signataires vous cautionnez que la science est dite (‘the science is settled’) et si tel est bien le cas alors vous ignorez de très nombreuses publications scientifiques, émanant de scientifiques de ‘haut vol’ qui montrent que le doute est permis, qu’il doit rester la règle en science, et que la climatologie ne se résume pas aux énoncés simplistes de la pétition (qui ne mentionne aucune références pour argumenter). Bien entendu vous avez peut-être lu des articles et vous vous êtes fait une opinion. Dans ce cas, vous avez exercé votre esprit critique et vous avez tout compris de la climatologie. Il n’y a donc plus de doute pour vous, et du fait de votre signature la science est effectivement dite. L’essentiel des politiques et médias, bien qu’ils n’aient pas une grande connaissance scientifique, pensent comme vous.
Dans cet article, qui se veut une ouverture au débat, nous allons donner notre point de vue aux questions qui ont suscité votre adhésion. Nous ne ferons pas de politique, notre site Science, Climat et Energie (SCE) ayant une vocation scientifique. Nous souhaitons cependant que ceux qui n’ont pas fait l’effort de lire la manière dont les publications sont validées par le GIEC aillent consulter le site du GIEC.
Vous l’aurez compris, la climatologie est une science jeune, fort complexe, et contrairement aux affirmations et ‘matraquages’ quotidiens, elle est loin d’être comprise.
There has been almost a death watch going on for Chicago, looking for an all time new all-time low temperature record to beat the previous -27°F. For those wishing for a new datapoint, Chicago didn’t beat the all time record, but did set a new record for the day…
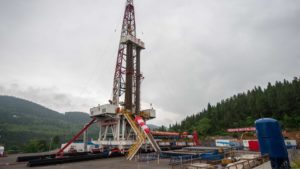
Scientists have developed an ‘energy rod’ that can fire multiple shock waves to frack sedimentary rock at depths of up to 3.5km
China has the world’s largest reserves of natural gas but current mining technology makes most of it inaccessible
China is planning to apply the same technology used to detonate a nuclear bomb over Hiroshima during the second world war to access its massive shale gas reserves in Sichuan province. While success would mean a giant leap forward not only for the industry but also Beijing’s energy self-sufficiency ambitions, some observers are concerned about the potential risk of widespread drilling for the fuel in a region known for its devastating earthquakes.
Despite being home to the largest reserves of shale gas on the planet – about 31.6 trillion cubic metres according to 2015 figures from the US Energy Information Administration, or twice as much as the United States and Australia combined – China is the world’s biggest importer of natural gas, with about 40 per cent of its annual requirement coming from overseas.
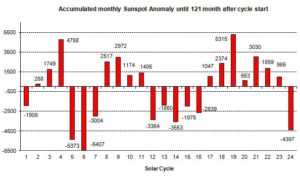
Our sun was also very sub-normally active in December last year. We are writing the 121st month since the beginning of cycle number 24, in December 2008, and since 2012 (when we started the blog here) we could only reformulate the opening sentence once: In September 2017 when the sun was 13% more active than the long-term (since 1755) average.
All other months were below average. With the sunspot number (SSN) of 3.1 for the monthly average for December and a total of 24 days without any spot (throughout the second half of the month the sun was spotless) we are in the middle of the cycle minimum.
…
Fig. 2: The sunspot activity of our sun since cycle 1 (1755). The numbers are calculated by adding the monthly differences with respect to the mean (blue in Fig.1) up to the current cycle month 121.
La révolution bolivarienne financée par le pétrole a complètement appauvri le Venezuela. Les idéologues socialistes avaient tout faux depuis le début.
…
Le paradoxe est encore plus étrange car le pays est très riche en ressources naturelles. Avec 303 milliards de barils (18 % du total mondial), le Venezuela détient les plus grandes réserves prouvées de brut au monde, loin devant l’Arabie Saoudite qui en possède 266. Pour mesurer leur ampleurs, observons que ces réserves correspondent à celles combinées de la Russie, des États-Unis et de l’Iran. Il possède également 6 400 milliards de m3 de gaz naturel – 3,3 % des réserves mondiales – soit près de quatre fois les réserves de la Norvège, considérée en Europe comme un grand du gaz.
La plupart des réserves de pétrole prouvées du Venezuela sont situées dans le bassin du fleuve Orinoco, où 220,5 milliards de barils de pétrole lourd gisent, pratiquement inexploités. Même s’il n’est pas de première qualité, c’est quand même du pétrole. La principale zone de production se trouve dans le bassin de Maracaibo, où l’on pompe près de 50 % du pétrole vénézuélien.
A message to French Yellow Vests that greens and EU supporters can field large groups of demonstrators. But half the pro-climate action marchers were school children.
I’m disgusted by how greens seem to think it is OK to use children as political pawns in their nasty game.
The school children, half of the climate action marchers, have no idea about the real world. They have never experienced the misery of watching their meagre weekly pay packets taxed away by distant green politicians who have no empathy or concern for the problems of ordinary people.
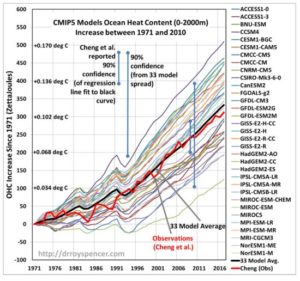
I wanted to expand upon something that was mentioned in yesterday’s blog post about the recent Cheng et al. paper which was widely reported with headlines suggesting a newer estimate of the rate of ocean warming is 40% higher than old estimates from the IPCC AR5 report in 2013. I demonstrated that the new dataset was only only 11% warmer when compared to the AR5 best estimate of ocean warming during 1971-2010.
The point I want to reemphasize today is the huge range in ocean warming between the 33 models included in that study. Here’s a plot based upon data from Cheng’s website which, for the period in question (1971-2010) shows a factor of 8 range between the model with the least ocean warming and the model with the most warming, based upon linear trends fitted to the model curves:
Yearly ocean heat content (OHC) changes since 1971 in 33 models versus the recent Cheng reanalysis of XBT and Argo ocean temperature data for the surface to 2,000m layer. The vertical scale is in both ZettaJoules (10^21 Joules) and in deg. C (assuming an ocean area of 3.6 x 10^14 m^2). The Cheng et al. confidence interval has been inflated by 1.43 to account for the difference between the surface area of the Earth (Cheng et al. usage) and the actual ocean surface area.
Researchers from Leipzig cooperate with scientists from Punta Arenas (Chile) to learn more about the relationship between air pollution, clouds and precipitation.
Leipzig/Punta Arenas. How do airborne particles, so-called aerosols, affect the formation and life cycle of clouds and precipitation? In order to come one step closer to solving this question, atmospheric scientists from the Leibniz Institute for Tropospheric Research (TROPOS) and the Leipzig Institute for Meteorology (LIM) at Leipzig University will observe the atmosphere at one of the cleanest places in the world for at least a year. The choice fell on Punta Arenas because the city is located on a comparable geographical latitude as Germany and will thus enable comparisons between the northern and southern hemispheres. The measurement campaign is part of the International Year of Polar Prediction (YOPP), which aims to improve weather and climate forecasts for the polar regions through intensive measurements.
From the LA times, a bold move, but unlikely they can pull it off.
Germany to close all 84 of its coal-fired power plants, will rely primarily on renewable energy
…
…
The decision to quit coal follows an earlier bold energy policy move by the German government, which decided to shut down all of its nuclear power plants by 2022 in the wake of Japan’s Fukushima disaster in 2011.
…
The initial targets are considerable, calling for a quarter of the country’s coal-burning plants with a capacity of 12.5 gigawatts to be shut down by 2022. That means about 24 plants will be shut within the first three years. By 2030, Germany should have about eight coal-burning plants remaining, producing 17 gigawatts of electricity, the commission said.
A “Siberian Express” weather disturbance currently crossing the Arctic Ocean will meet up with the semi-permanent winter “polar vortex” over Canada, pushing a record-breaking cold air mass into the Upper Plains and Midwest U.S. by Wednesday.
Chicago All-Time Record Low?
Both the European (ECMWF) and U.S. (GFS) weather forecast models are in agreement that by Wednesday morning temperatures in the Chicago suburbs will be approaching -30 deg. F. The all-time official record low for the Chicago metro area was -27 deg. F (O’Hare) on January 20, 1985, and that 34 year old record could fall as the ECMWF model is forecasting -32 deg. F for Thursday morning while the GFS model is bottoming out at -26 deg. F on Wednesday morning. Of course, these forecasts will change somewhat in the coming days as the cold wave approaches.
by S. Beech, January 25, 2019 in ClimateChangeDispatch
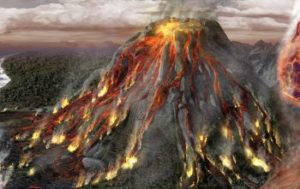
A massive volcanic eruption in Scotland on the same scale as the infamous Krakatoa blast may have contributed to prehistoric global warming.
Scientists say that global temperatures spiked around 56 million years ago.
And a new study suggests that a major explosive eruption from the Red Hills on the Isle of Skye may have been a contributing factor to the massive climate disturbance.
Large explosive volcanic eruptions can have lasting effects on climate and have been held responsible for severe climate effects in Earth’s history.
One such event occurred around 56 million years ago when global temperatures increased by up to 8 degrees Celcius (46 degrees Fahrenheit.)
The event has been named the Paleocene-Eocene Thermal Maximum (PETM).
by Jean, N. 25 janvier 2019 in ScienceClimatEnergie
En octobre 2017 un article signé Carl Brehmer[1] et traitant de la théorie de l’effet de serre radiatif était publié sur le site web de l’association anglaise Principia Scientific International[2]. Dans cet article, l’auteur utilisait des données fournies par les stations météorologiques SURFRAD et démontrait que la théorie de l’effet de serre ne pouvait pas expliquer les observations. Si l’auteur a raison, il s’agit encore d’un sérieux problème pour la théorie. Dans le présent article nous allons suivre les pas de Carl Brehmer mais nous allons faire nos propres calculs en employant une autre méthodologie. Arriverons-nous aux mêmes conclusions?
.
Figure 1. Les stations SURFRAD de la NOAA aux Etats-Unis
A careful look at the early 20th century global warming, which is almost as large as the warming since 1950. Until we can explain the early 20th century warming, I have little confidence IPCC and NCA4 attribution statements regarding the cause of the recent warming.
This is an issue that has long interested me. Peter Webster wrote a previous post Mid 20th Century Global(?) Warming, which focused on the warm bump that culminated in the 1940’s. My interest in this period was reignited while working on my report Sea Level and Climate Change. Then, the recent paper by Zanna et al. discussed in Ocean Heat Content Surprises further made the wheels turn.
In response to the Ocean Heat Content thread, David Appell posted a link to this paper on twitter:
A very large majority of establishment academic climate scientists have succumbed to a virulent infectious disease – the CO2 Derangement Syndrome. Those afflicted by this syndrome present with a spectrum of symptoms .The first is an almost total inability to recognize the most obvious Millennial and 60 year emergent patterns which are trivially obvious in solar activity and global temperature data.
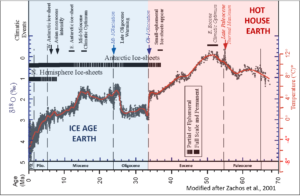
Note how the PETM (55 Ma) is about as far from a CO2 analog to modern times as it possibly could be… unless the PETM stomata data are correct, in which case AGW is even more insignificant than previously thought.
Regarding temperatures, the PETM is also about as far from being an analog to modern times as it possibly could be.
Figure 2. High latitude SST (°C) From benthic foram δ18O. Funny how the PETM is often cited as a nightmarish version of a real-world RCP8.5… While the warmer EECO is a climatic optimum. (Zachos et al., 2001). Note: Older is to the right.
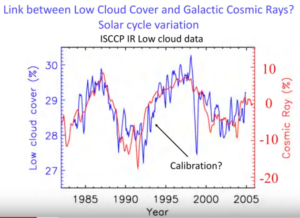
Danish Professor Henrik Svensmark is a leading physicist of cosmic radiation. At the end of last year he made a presentation at the 12th International Climate Conference in Munich, where he demonstrated that the climate is indeed modulated in large part by cloud cover, which in turn is modulated by solar activity in combination with cosmic rays.
His theory is that cosmic rays, which are extremely fast-flying particles – which originate from dying supernovae – travel through the cosmos, strike the Earth’s atmosphere and have a major impact on cloud cover and thus climate on the Earth’s surface.
This, Svensmark says, has been confirmed in numerous laboratory experiments.
There are a number of statements in Cheng et al. (2019) ‘How fast are the oceans warming’, (‘the paper’) that appear to be mistaken and/or potentially misleading. My analysis of these issues is followed by a reply from the paper’s authors.
Contrary to what the paper indicates:
Contemporary estimates of the trend in 0–2000 m depth ocean heat content over 1971–2010 are closely in line with that assessed in the IPCC AR5 report five years ago
Contemporary estimates of the trend in 0–2000 m depth ocean heat content over 2005–2017 are significantly (> 95% probability) smaller than the mean CMIP5 model simulation trend.
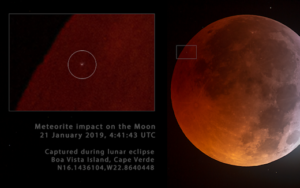
This is a treat. On Jan. 21st, a meteoroid slammed into the Moon. We know this because many amateur astronomers witnessed the explosion and recorded video and photos. The fireball was visible against the shadowy backdrop of a total lunar eclipse. Video of the event follows.
We know this because many amateur astronomers witnessed or photographed the explosion. Petr Horálek was one of them; he captured the fireball from Boa Vista, one of the islands of Cape Verde …
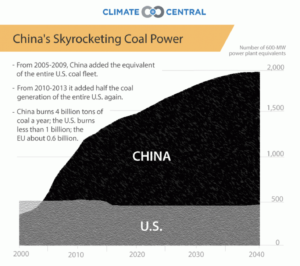
BEIJING (Reuters) – China’s December coal output climbed 2.1 percent from the year before, government data showed, hitting the highest level in over three years as major miners ramped up production amid robust winter demand and after the country started up new mines.
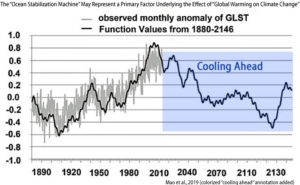
Four climate scientists assert (1) the last ~130 years of temperature changes fit “perfectly” into statistical indices of natural variation, and (2) a long-term deep cooling of the Earth system has recently commenced.
An analysis published in the journal Atmospheric and Climate Sciences by 4 climate scientists reveals the 1880-2013 temperature changes fit “perfectly” (0.9 correlation) into a calculation utilizing 15,295 periodic functions of natural variation.
Après trois années de baisse, les émissions américaines de CO2 liées à l’énergie auraient augmenté de 3,4% en 2018 selon les dernières estimations du cabinet Rhodium Group. Explications.
Une hausse des émissions malgré la baisse de consommation de charbon
Les émissions américaines de CO2 liées à l’énergie auraient connu en 2018 (+ 3,4%) leur deuxième plus forte hausse annuelle des deux dernières décennies, après 2010 (+ 3,8% dans un contexte de reprise économique après la crise de 2008) selon les dernières estimations de Rhodium Group publiées le 8 janvier.
La consommation de charbon a pourtant significativement baissé aux États-Unis en 2018 selon l’EIA. Dans le secteur électrique, le « King Coal » s’efface peu à peu au profit du gaz naturel, plus compétitif (avec l’exploitation du gaz de schiste) : la part du charbon dans la production nationale d’électricité aurait atteint 28% en 2018 (et pourrait encore diminuer à 26% en 2019), contre 35% pour le gaz naturel selon le Short-Term Energy Outlook de l’EIA publié en décembre dernier.
La géologie, une science plus que passionnante … et diverse